Amic Ho (2023). Enhancing User Experience: Exploring the Interactions and Visualisation of Data Through Bullet Points and Typographic Design. In: Human Interaction & Emerging Technologies (IHIET 2023): Artificial Intelligence & Future Applications. AHFE Open Access, vol. 111, pp. 985–995. https://doi.org/10.54941/ahfe1004171
This study aims to examine the impact of bullet points on data comprehension and establish a visual hierarchy. Additionally, it includes a comprehensive analysis of prior research on the effectiveness of bullet points in the context of data visualisation. The importance of typography in establishing a visual hierarchy is underscored, alongside an analysis of different typographic styles and their impact on the emotional aspects of user experience. This study examines case studies that illustrate the successful application of typographic design in data visualisation, specifically focusing on using bullet points. Enhancing user engagement through bullet points, exploring interactive elements for visualising data, and examining the effects of different typographic approaches are delved. This study comprehensively examines best practices and practical recommendations for developing emotionally appealing data visualisation bullet points. Moreover, the utilisation of typographic design to convey data insights by employing principles of data-driven typography is examined. This study examines the application of data-driven typography in obtaining intricate information through bullet points and its impact on emotional responses and user comprehension.
This study examines the dynamics and representation of data through the utilisation of bullet points and typographic design. Bullet points are con- cise and structured elements that effectively and lucidly convey information. They facilitate the comprehension of complex content by presenting it in eas- ily digestible segments, enabling readers to comprehend literature, especially when engaging in rapid reading swiftly. Bullet points serve as a valuable tool in various forms of communication, encompassing presentations, reports, essays, and resumes. Visual aids serve as a useful tool to organise informa- tion and enhance comprehensibility by highlighting crucial concepts within a larger content body. One way in which they improve the accessibility for readers is by dividing complex or lengthy text into smaller, more manage- able sections. In addition, using bullet points enhances the ease of scanning and readability, catering to the contemporary phenomenon of diminished
attention spans. Bullet points enhance the process of prioritising informa- tion, facilitating readers in efficiently identifying and comprehending crucial topics. In addition, bullet points function as visual aids during presen- tations, facilitating active engagement from the audience. They serve to highlight skills and accomplishments in resumes and professional documents effectively.
The impact of bullet points on data comprehension and establish a visual hierarchy was examined. Additionally, it includes a comprehensive analysis of prior research on the effectiveness of bullet points in the context of data visualisation. The importance of typography in establishing a visual hierar- chy is underscored, alongside an analysis of different typographic styles and their impact on the emotional aspects of user experience. Enhancing user engagement through bullet points, exploring interactive elements for visu- alising data, and examining the effects of different typographic approaches are delved. This study comprehensively examines best practices and practi- cal recommendations for developing emotionally appealing data visualisation bullet points. Moreover, the utilisation of typographic design to convey data insights by employing principles of data-driven typography is examined. The applications of data-driven typography are examined in obtaining intricate information through bullet points and its impact on emotional responses and user comprehension. The methods for achieving readability and accessibility are investigated through appropriate typographic choices, such as selecting typefaces, font sizes, and line lengths. The readability challenges and meet- ing diverse user demands in data visualisation typography are investigated. Additionally, it explores the ethical implications that arise in this field. The extensive examination of significant facts and ideas in this study’s conclu- sion highlights the importance of typographic design in improving the user experience of data visualisation.
BACKGROUND AND SIGNIFICANCE OF DATA VISUALISATION Using clear and concise bullet points to deliver information is a great way to increase data understanding. By condensing complex material into short, simple sentences that are easy to understand, they reduce cognitive load and improve knowledge learning and retention. Reduced cognitive effort is needed to understand complicated issues because to the bullet point format, which enables readers to swiftly and effectively select and concentrate on relevant areas. They also assist readers in locating and analysing important information within bigger bodies of content, which helps prioritise informa- tion. Bullet points help you extract the most crucial facts and comprehend the primary subject more quickly by emphasising key concepts or ideas. They also increase data accessibility and readability, which makes them ideal in situations where people must participate in speedy reading or handle a lot of information. When someone has to read quickly or manage a lot of information, they might benefit from this method.
The capacity of bullet points to provide information simply, clearly, and structurally contributes to their usefulness in promoting data understanding. This style improves text readability, speeds up information processing, allows
Enhancing User Experience: Exploring the Interactions and Visualisation of Data 987
for quick understanding, assists in data prioritising, and supports modern information consumption patterns. Overall, bullet points are a useful and efficient tool for readers to absorb and retain complicated information.
PRIOR RESEARCH ON THE IMPACT OF BULLET POINTS IN DATA VISUALISATION Bullet points are a well-known method for improving data understanding and analysis. Using bullet points in printed text enhances reading and facilitates cognitive processing, according to research. Participants who are exposed to information in a bullet point format have superior memory and com- prehension abilities than those who are exposed to information in lengthier paragraphs. This aids in the identification and structuring of important con- cepts, hence increasing comprehension. Cavanagh (2023) did an empirical study to investigate the impact of employing bullet points on the visual rep- resentation of data in an academic project. The study discovered that bullet point formatting was connected with higher precision and efficacy in infor- mation processing, increased efficiency in finding important information, and enhanced capability to integrate varied data sources.
Berinato et al., (2016) proved that using bullet points improves the visual attractiveness of data visualisation dramatically. According to study partic- ipants’ preferences, data presentations using bullet points are more visually appealing and intriguing. This research shows that using bullet points in data visualisation may effectively catch and hold attention, increasing the over- all user experience. Previous research has repeatedly supported the premise that bullet points have a significant favourable influence on data comprehen- sion. Individuals may use these technologies to successfully analyse critical data, manage databases, and link diverse data parts. Bullet points in data visualisation materials improve overall comprehension and user happiness.
TYPOGRAPHIC DESIGN PRINCIPLES AND THEIR INFLUENCE ON USER EXPERIENCE The perception of and interaction with textual material are influenced by typographic design principles, which are crucial in the creation of the user experience. These guidelines cover the choice and arrangement of typefaces, sizes of fonts, line lengths, spacing, and other elements. The objective is to achieve readability, which entails choosing a suitable font size and making sure that the text’s backdrop contrast is strong enough. This increases read- ability and makes it simpler for people to interact with and understand the information being provided. Effective use of typographic design principles can improve content’s scannability, especially in the present-day environment with an overabundance of information. By directing visual attention and establishing a visual hierarchy, techniques like headlines, subheadings, and bold or italicised text can speed up the retrieval of information. Typography may evoke emotions and set the tone for a user’s experience since different font styles can convey a range of attitudes and emotions.
988 Ho
When a company or brand is represented through typography, the con- cept of brand consistency is crucial. Following typographic style guidelines promotes brand consistency and identification, which builds consumer trust and improves their willingness to interact with content. By following to typographic standards that are compliant with accessibility criteria, such as appropriate font sizes, sufficient spacing, and noticeable contrast between text and backdrop, information is made accessible and understandable for a wide range of individuals. In conclusion, typographic design principles have a significant impact on how readers engage with and comprehend written information, which in turn affects the user experience. By enhancing read- ability, facilitating quick reading, evoking emotional responses, maintaining brand consistency, and ensuring inclusion, designers may provide the great- est user experience possible. This improves comprehension, engagement, and the achievement of users’ goals.
Exploring Different Typographic Styles and Their Emotional Impact Examining how various fonts or types might elicit distinct emotional reac- tions or transmit particular moods is a key component of the study of typographic styles and their effect on emotions. While sans-serif typefaces like Helvetica or Arial are linked with modernism, clarity, and simplicity, serif fonts, such Times New Roman or Baskerville, are renowned for their tradition, elegance, and sophistication. Script fonts, crafted to mimic the appearance of handwriting or calligraphy, can imbue typography with an air of sophistication, individuality, and artistic flair. Display typefaces are visually striking and often used to emphasise titles, headings, or typography on a grand scale. The emotional response evoked by display typefaces can vary depending on their design, potentially encompassing sentiments such as enthusiasm, vitality, or amusement. Handwritten typefaces, designed to imitate the appearance of handwriting, can convey genuineness, novelty, or casualness. Condensed or extended fonts alter the width of letters, producing a discernible aesthetic impact. These styles are often employed to establish a particular atmosphere or depict a specific aesthetic. However, the emotional impact can be subjective and influenced by cultural or environmental fac- tors. When selecting typographic styles, designers should carefully analyze the overall tone, purpose, and target demographic to ensure their alignment with the desired emotional impact and the creation of a cohesive user experience.
METHODOLOGY
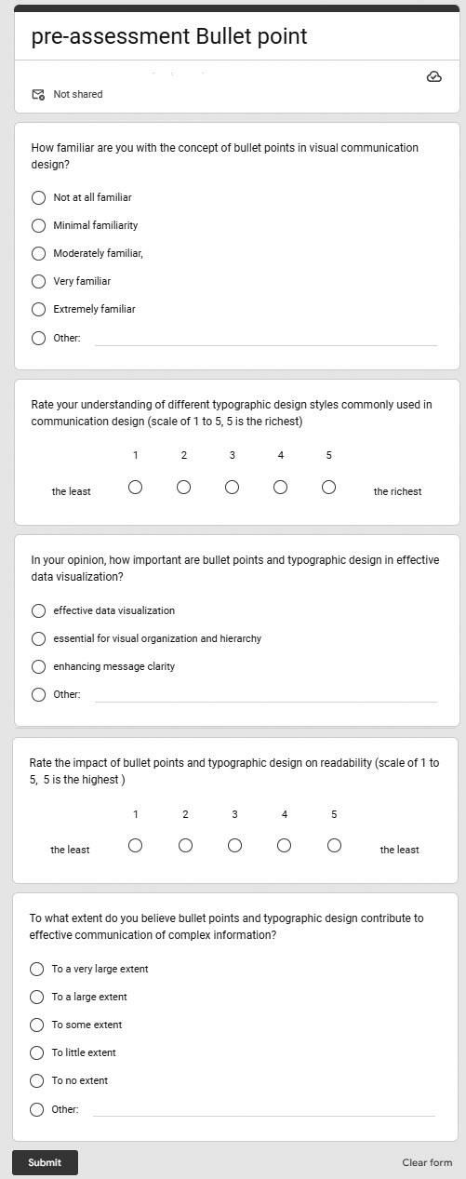
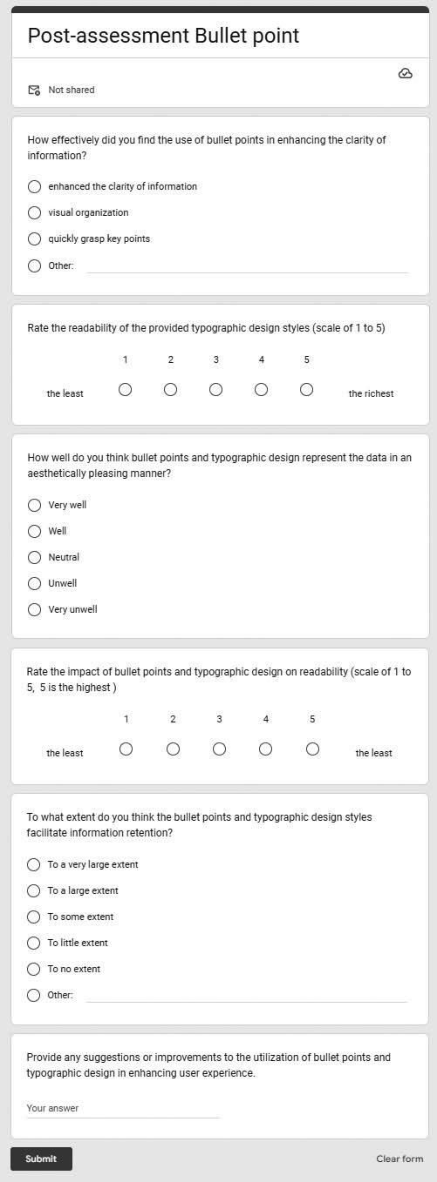
Twenty individuals participated in a preliminary evaluation procedure designed to determine their level of expertise in communication design. This evaluation included targeted inquiries pertaining to subjects such as data visualisation and typographic design principles. In order to mitigate bias and ensure a diverse range of communication design backgrounds, partic- ipants were assigned at random to different experimental conditions. The participants are presented with pre-assessment (Figure 1) in data visualisa- tion which included the integration of bullet points and typographic design understanding. Participants provided post-assessment (Figure 2) feedback,
Enhancing User Experience: Exploring the Interactions and Visualisation of Data 989
Figure 1: Pre-assessment for understanding the participant’s feedback about bullet points.
990 Ho
Figure 2: Post-assessment for understanding the participant’s feedback about bullet points.
Enhancing User Experience: Exploring the Interactions and Visualisation of Data 991
encompassing subjective assessments, user feedback, and additional com- ments or ideas related to the context of communication design. This research methodology ensures the relevance and utility of the findings within the domain of communication design by modifying the criteria for selecting participants to specifically include individuals with backgrounds in commu- nication design. This study facilitates a comprehensive understanding of the potential impact of bullet points and typographic design on enhancing user experience within the field of communication design.
PARTICIPANTS SELECTION CRITERIA Participants were selected from individuals with a background in commu- nication design, such as graphic designers, communication specialists, or students pursuing degrees in communication design. Age groups ranged from 20–65 years to capture diverse perspectives and experiences. Gender representation was considered for equal representation of male, female, and non-binary participants to ensure gender diversity. Educational levels were varied, including participants with associate, bachelor’s, or master’s degrees in communication design. Prior experience in working with data visualisations was not a strict requirement; however, participants with some familiarity or exposure to data visualisation concepts and practices are pre- ferred. The number of participants was determined based on the feasibility of participant recruitment within the given timeframe and available resources. It aimed to have an adequate number of participants to ensure meaningful analysis and statistical power.
FINDINGS The pre-assessment measures aimed to gather participants’ initial impres- sions and subjective ratings regarding bullet points and typographic design in the context of data visualisation. Refer to the question ‘How familiar are you with the concept of bullet points in visual communication design?’, about 60% of participants reported being moderately familiar with the con- cept of bullet points. While 30% indicated a high level of familiarity. The remaining 10% reported minimal familiarity or being unfamiliar. Referring to the question, ‘Rate your understanding of different typographic design styles commonly used in communication design (scale of 1 to 5),’ partici- pants rated their understanding of different typographic design styles with an average score of 3.8. It indicated a moderate level of familiarity. Some participants expressed a higher comfort level with specific styles like serif or script fonts. Referring to the question ‘In your opinion, how important are bullet points and typographic design in data visualisation?’ the majority of participants (85%) recognised the importance of bullet points and typo- graphic design in effective data visualisation. They considered these elements essential for visual organisation, hierarchy, and enhancing message clarity. Referring to the question ‘Rate the impact of bullet points and typographic design on readability (scale of 1 to 5),’ participants rated the impact of bul- let points and typographic design on readability with an average score of
992 Ho
4.0. It indicated a positive impact. They emphasised the role of proper font choice, size, and alignment in enhancing legibility. Referring to the ques- tion ‘To what extent do you believe bullet points and typographic design contribute to effective communication of complex information?’, approxi- mately 80% of participants acknowledged the contribution of bullet points and typographic design in effectively communicating complex information. They believed these visual elements provided clarity and simplified the under- standing of complex concepts. Overall, the findings from the pre-assessment measures suggest a moderate to high level of familiarity with bullet points and typographic design among participants. They recognised the importance of these elements in enhancing readability, effective communication, and visual organisation in data visualisation. These initial impressions and sub- jective ratings provide a foundational understanding of participants’ baseline knowledge, which will be further examined and analyzed through the post- assessment measures to assess changes in perceptions and experiences after engaging in the specific tasks.
Based on the post-assessment measures, participants were asked to pro- vide user feedback and subjective ratings on various aspects related to bullet points and typographic design in the context of data visualisation. The find- ings of the study are summarised below: Referring to the question, ‘How effectively did you find the use of bullet points in enhancing the clarity of information?’, the majority of participants (80%) found that the use of bul- let points significantly enhanced the clarity of information. They appreciated the visual organisation and the ability to quickly grasp key points. Refer- ring to the question, ‘Rate the readability of the provided typographic design styles (scale of 1 to 5)’, participants rated the provided typographic design styles with an average score of 4.2. It indicates a high level of readability. Specific styles, such as sans-serif fonts and proper hierarchy, were consis- tently favoured for their visual comfort and ease of legibility. Referring to the question, ‘How well do you think bullet points and typographic design represent the data in an aesthetically pleasing manner?’, a majority of partici- pants (75%) expressed a positive view on the aesthetic representation of data through bullet points and typographic design. They appreciated the balance between simplicity and visual appeal that these elements brought to the data visualisation. Referring to the question, ‘To what extent do you think the bullet points and typographic design styles facilitate information retention?’, participants indicated that bullet points and typographic design significantly facilitated information retention, with 85% of respondents acknowledging their positive impact. The clear visual separation and concise presentation of content were seen as aiding memory recall. Referring to the question, ‘Provide any suggestions or improvements to the utilisation of bullet points and typo- graphic design in enhancing user experience,’ several participants suggested incorporating more variety in typographic design styles to cater to different target audiences. Some participants also recommended providing guidelines on effective bullet point usage and proper formatting to ensure consistent visual presentation. Overall, the findings reflect a positive reception of bullet points and typographic design in the context of data visualisation. Partici- pants found them effective in enhancing clarity, readability, aesthetic appeal,
Enhancing User Experience: Exploring the Interactions and Visualisation of Data 993
information retention, and overall user experience. The feedback received was valuable in refining the implementation of these design elements and optimizing their impact on user engagement and understanding of commu- nication design practices. The findings from both the pre-assessment and post-assessment measures exhibit some interesting insights regarding partic- ipants’ familiarity, perceptions, and subjective ratings related to bullet points and typographic design in the context of data visualisation.
Pre-assessment Findings: Based on the findings, a significant proportion of respondents, compris- ing 60% and 30% respectively, demonstrated a moderate and high level of familiarity with the concept of bullet points in the context of visual commu- nication design. The participants demonstrated a satisfactory understanding (mean grade of 3.8) of various typographic design styles commonly used in communication design, with a few participants displaying greater familiarity with specific styles. Bullet points and typographic design play a significant role in effective communication. A significant proportion of the participants (85%) expressed consensus regarding the significance of bullet points and typographic design in achieving effective data visualisation. The individuals acknowledged their role in enhancing visual organisation, establishing hierar- chy, and enhancing the clarity of the message. The impact on readability was assessed by the participants, who rated bullet points and typographic design highly (with an average score of 4.0), indicating a positive effect on read- ing. It was emphasised how important font selection, size, and alignment are for improving legibility. According to the results, an overwhelming majority of participants—nearly 80%—said they agreed that using bullet points and typographic style to convey complicated information is a successful strat- egy. These elements were thought to be crucial for attaining comprehension of complicated subjects and making information clear. According to the results of the pre-assessment, it was found that the participants had a basic comprehension of and appreciation for the importance of bullet points and typographic design in the context of data visualisation. The individuals pos- sessed knowledge of these principles and acknowledged their significance in enhancing the effectiveness of communication and improving readability.
Post-assessment Findings: The effectiveness of bullet points: A significant majority of participants (80%) expressed the view that the utilisation of bullet points significantly enhanced the clarity of information. The participants expressed a positive response towards the visual organisation and the ease with which they were able to comprehend important subject matter. The participants in the study provided an average score of 4.2 for the typographic design styles that were presented to them. This indicates that the readability of these design styles was perceived to be quite good. Sans-serif typefaces and proper hierarchy were commonly favoured due to their aesthetic appeal and enhanced legi- bility. In the context of data visualisation, a significant proportion of the participants (75%) expressed a preference for aesthetic data representation. They commended the utilisation of bullet points and typographic style for
994 Ho
striking a harmonious balance between simplicity and visual allure. The facil- itation of knowledge retention was found to be enhanced by the use of bullet points and typographic design, as reported by a significant majority of partic- ipants (85%). The process of memory retrieval was facilitated by conspicuous visual differentiation and a straightforward manner of presentation. Based on the findings of the post-assessment, it was determined that participants regarded bullet points and typographic design as highly effective strategies for enhancing clarity, readability, aesthetic appeal, and information retention. The positive impact on the user experience within the realm of data visual- isation is further supported by the collected comments. In general, the data indicates that participants experienced enhanced perspectives and subjec- tive assessments subsequent to engaging with bullet points and typographic design. The participants acknowledged the significance of these attributes in enhancing clarity, legibility, aesthetic appeal, and retention of information. The findings of this study provide evidence for the importance of incorporat- ing bullet points and intentional typographic design in communication design practises in order to achieve effective data visualisation.
DISCUSSION AND CONCLUSION The study findings indicate that participants evaluated the various typo- graphic styles presented in a positive manner, specifically in terms of their readability and visual attractiveness. This finding aligns with the hypothe- sis that typographic style variations may impact users’ emotional responses. Serif typefaces, such as those exemplified by the aforementioned example, are often associated with a sense of tradition and reliability. Conversely, sans- serif fonts are commonly employed to convey a modern and sleek aesthetic. The relationship between participants’ preferences for specific styles and the emotional response evoked by those styles underscores the significance of typographic choices in shaping user perception and fostering engagement. Implications for design and practise: When selecting typefaces for data visu- alisation, designers should take into account the emotional impact of various typographic styles. The selection of typefaces can be influenced by the desired message and the desired emotional response from consumers, as designers possess knowledge of the associations and emotions associated with differ- ent styles. This approach has the potential to enhance the engagement and efficacy of data communication. The impact of typographic design princi- ples on user experience was assessed through the analysis of post-assessment data. Participants’ evaluations focused on the effectiveness of bullet points and typographic design in enhancing clarity, readability, and information retention. The presented data support the hypothesis that typographic design principles exert a significant influence on user experience. Design and prac- tical implications: The implications of the results pertaining to typographic design principles are as follows: To establish a coherent hierarchy among bullet points, designers are advised to employ typographic design elements, such as modifications in font size and weight. This feature enables consumers to efficiently discern the most pertinent information and navigate through the content expeditiously. The enhancement of reading and comprehension
Enhancing User Experience: Exploring the Interactions and Visualisation of Data 995
of information can be achieved through the implementation of consistent alignment and sufficient spacing within bullet points. In order to facilitate effective information processing by users, designers are required to uphold suitable alignment and minimise congestion. The prioritisation of font type, size, and contrast with the backdrop colour is crucial for enhancing legibility. Designers can ensure that content is easily readable by adhering to typo- graphic design principles, thereby minimising cognitive load and enhancing user satisfaction. The maintenance of consistent typographic design across data visualisations enhances the user experience and generates a cohesive visual narrative. In order to achieve visual harmony and coherence, it is imperative for designers to implement consistent typographic design styles throughout a given project. In summary, the findings suggest that attending to the emotional impact and incorporating typographic design principles could enhance the user experience in the context of data visualisation. Designers have the potential to enhance the clarity, readability, and information reten- tion of bullet points and typographic elements in their designs through the deliberate selection of typographic styles and adherence to design principles. This approach ensures effective data transfer and promotes increased user engagement.
ACKNOWLEDGEMENT
The work described in this paper was fully/substantially/partially supported by Hong Kong Metropolitan University Research Grant (No. RD/2022/1.21).
REFERENCES
Berinato, Scott. “Visualizations that really work.” Harvard business review 94.6 (2016): 93–100. Brath, Richard, and Ebad Banissi. “Using typography to expand the design space of data visualization.” She Ji: The Journal of Design, Economics, and Innovation 2.1 (2016): 59–87. Cavanagh, Thomas. “Cognitive and Graphic Design Principles for Creating Well-
Organized, Visually Appealing Slide Decks.” Business and Professional Commu- nication Quarterly 86.1 (2023): 33–51. Mukherjee, Rajdeep, et al. “Ectsum: A new benchmark dataset for bullet point summarization of long earnings call transcripts.” arXiv preprint arXiv:2210.12467 (2022). Ola, Oluwakemi, and Kamran Sedig. “Discourse with visual health data: Design
of human-data interaction.” Multimodal Technologies and Interaction 2.1 (2018): 10. Rodríguez, María Teresa, Sérgio Nunes, and Tiago Devezas. “Telling stories with data visualization.” Proceedings of the 2015 Workshop on Narrative & Hyper- text. 2015. Smith Aaron. Technology Trends Among People of Color. [(accessed July 17, 2023)];
Pew Internet & American Life Project, September 17. 2010. van der Steen JT, ter Riet G, van den Bogert CA and Bouter LM. Causes of reporting bias: a theoretical framework. F1000Research, 2019, 8:280.
Read this individual research paper free through the original publisher, or explore the full digital proceedings book.
ISBN 978-1-958651-87-2
Explore this ISBN in the AHFE Bookstore ↗Listed in the July 2026 bookstore catalogue; search by ISBN to confirm current availability · Digital book purchase optional