Hiroshi Watanabe, Hiroyasu Ujike (2026). Effects of Luminance and Animation Type on Glare and Visibility of Dynamic Signs: An Ergonomic Study Considering Age-Related Differences. In: Human Factors and Ergonomics In Design. AHFE Open Access, vol. 210, pp. 195–203. https://doi.org/10.54941/ahfe1007440
Increased luminance enhances sign visibility and readability, but excessive luminance can induce discomfort glare, particularly among older adults. However, few systematic investigations have examined the combined effects of luminance, animation type, and age. This study explores how luminance and animation type (flash vs. slide) affect perceived glare, visibility, and readability in different age groups. Six luminance levels (15.9–1,237 cd/m2) were tested. Based on stimulus size, the glare index at 762 cd/m2 was calculated to be 30.42, categorized as “intolerable.” Dynamic signs were evaluated by 15 participants in their 20s and 15 in their 60s. After 5 minutes of dark adaptation, the participants rated glare, visibility, and readability on seven-point scales and completed a comprehension task. Three-way analysis of variance (Age Group × Animation Type × Luminance) was performed. The results showed that comprehension accuracy exceeded 80% in all conditions, suggesting that animation does not necessarily impair recognition. Perceived glare increased with luminance, with an age-by-luminance interaction indicating that younger adults felt more glare at high luminance than older adults. Notably, older participants rated slide animations as significantly more visible and readable than flash animations. These findings suggest that, for older adults, slide animations at moderate luminance provide an optimal balance between visibility and comfort.
Dynamic signs are information display systems that change their visual attributes (position, luminance, color, and shape) or contents to enhance visibility and conspicuity for guidance and warnings (Watanabe et al., 2021, 2025). While these systems are increasingly implemented in public spaces, ergonomic guidelines specifying requirements for visibility, safety, and accessibility remain limited (International Organization for Standardization, 2021).
Although high luminance and contrast improve sign visibility, it is essential to establish upper limits in order to maintain visual comfort. Previous research on discomfort glare has addressed various contexts, including office lighting (Luckiesh and Guth, 1949) and electronic displays (Takahashi et al., 2007).
196 Watanabe and Ujike Most of these studies utilized the Unified Glare Rating (UGR; International Organization for Standardization, 2002) to quantify the relationship between luminance and subjective discomfort. Furthermore, the correlation between glare sensitivity and aging has been extensively documented, noting that older adults are generally more susceptible to discomfort (Friedland et al., 2017). However, there is a lack of ergonomic research focusing on dynamic signs that occupy a relatively large visual field, such as those projected or displayed on large LED screens.
Although traditional glare studies predominantly focus on static light sources, dynamic signs introduce temporal and spatial transitions, such as flash and slide motion. These motion characteristics may modulate the perception of glare and visual comfort differently than static stimuli. In particular, the slide motion, common in modern digital signage, has not been sufficiently evaluated in terms of its interaction with luminance and observer age.
Accordingly, the purpose of this study was to clarify how luminance levels and animation types (flash vs. slide) affect perceived glare and readability across different age groups. By integrating glare sensitivity with motion characteristics, this research aims to provide new ergonomic insights for the design of accessible and comfortable dynamic sign systems.
METHOD
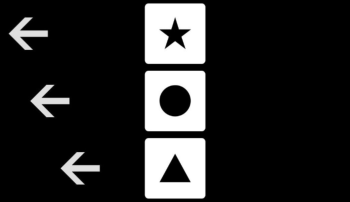
Stimuli: Dynamic Signs The dynamic signs used in this study consisted of three pictograms and three arrows (Figure 1), following the design employed in previous studies (Watanabe et al, 2021, 2025). In these earlier tasks, participants navigated a T-junction in a VR-reproduced underground mall, identifying the direction and distance of a destination indicated by a star mark. In the configuration shown in Figure 1, the star indicates that the destination is to the left. The relative distances between the pictograms and arrows imply the proximity to the destination; in this instance, the destination is at the farthest location from the intersection. The direction of the arrows, the implied distance, and the slots assigned to each pictogram were randomized for each trial.
For this experiment, the arrows either blinked or slid at a frequency of 2 Hz for a duration of 3 s. The overall bounding box of the dynamic sign measured 1.15 m in height and 2.0 m in width.
Figure 1: The dynamic signs used in this study.
Effects of Luminance and Animation Type on Glare and Visibility 197 Apparatus
The dynamic signs were displayed on a floor-mounted LED panel (SiliconCore P1.25-Floor Screen; width, 2.4 m, depth: 1.35 m) with a resolution of 1920 × 1080 pixels and a refresh rate of 120 Hz.
Luminance and Glare Index Luminance levels were controlled via RGB values, and the relationship was calibrated using a luminance meter. The background luminance was set to 3.0 cd/m2 to maintain high contrast in a darkroom-like environment. We selected six luminance levels: 15.9, 72.5, 198.6, 424, 762, and 1,237 cd/m2. The UGR was calculated based on the total pixel size of the pictograms and arrows. The results indicated that, at 762 cd/m2 (the second-highest level), the UGR was 30.4. This exceeds the maximum threshold of 28 categorized as “intolerable” by the Illuminating Engineering Society.
Participants Thirty individuals participated in the study: 15 in their 60s (mean age, 62.1 years; standard deviation [SD], 1.25 years) and 15 in their 20s (mean age, 22.3 years; SD, 2.69 years). All participants passed pre-tests for visual acuity (at 5 meters), stereo vision, and cognitive function (via the Mini-Mental State Examination).
Procedure The experiment followed a structured protocol to ensure consistent visual adaptation:
1. Initial Briefing: Participants received instructions, signed informed consent forms, and underwent vision and cognitive screenings (Mini- Mental State Examination; Folstein et al., 1975). 2. Testing Sessions: Participants evaluated two types of animations— slide and flash. The presentation order of the two animation types was counterbalanced. Each session involved assessing six luminance levels for a single animation type, with the six levels presented in a randomized order. To ensure consistent sensitivity, a 5-min dark adaptation period was provided before each stimulus presentation. 3. Task and Rating: Each stimulus was presented for 3 s. Participants then identified the direction and distance of the destination and provided subjective ratings for Glare (9-point scale), Visibility (7-point scale), and Readability (7-point scale). 4. Duration and Breaks: Each session lasted approximately 30 min. To mitigate potential fatigue, a mandatory 30-min rest period was implemented between the two sessions. Throughout the experiment, the participants’ physical condition was monitored; no significant fatigue or discomfort was reported.
The following three metrics were used to evaluate the dynamic signs:
1. Perceived Glare: This was evaluated on a 9-point scale in which 1 represented “no glare,” 5 represented the “limit of tolerance,” and 9 represented “intolerable.” This scale allows for the nuanced capture of discomfort levels as luminance increases. 2. Visibility: To assess visual comfort and the physical effort required to see the sign, a 7-point scale was used, ranging from 1 (“very difficult to see”) to 7 (“very easy to see”). 3. Readability: To evaluate how effectively the information (direction and distance) was conveyed, a 7-point scale was employed, ranging from 1 (“very difficult to understand”) to 7 (“very easy to understand”).
For all scales, the interpretation of the numerical values between the defined anchors was left to the judgment of the participants.
RESULTS
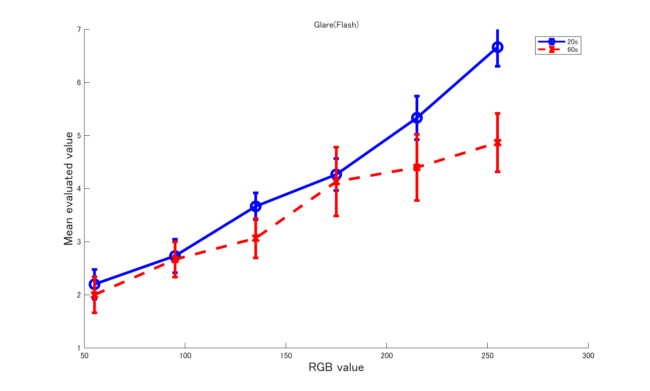
Perceived Glare The subjective ratings for perceived glare were analyzed to determine the impact of luminance, animation type, and age. The mean scores for each condition are presented in Figure 2.
A three-way repeated-measures analysis of variance (ANOVA; Age × Animation Type × Luminance) revealed a highly significant main effect for Luminance (F(5, 140) = 71.19, p < .01), confirming that perceived glare consistently increased as luminance levels rose. Although the main effects of Age (F(1, 28) = 1.53, n.s.) and Animation Type (F(1, 28) = 0.74, n.s.) were not statistically significant, a marginal Age × Luminance interaction was observed (F(5, 140) = 1.99, p < .10).
Simple main effect analysis of the Age × Luminance interaction showed that, at the highest luminance level (1,237 cd/m2), there was a marginal difference between age groups (F(1, 28) = 3.68, p < .10), with younger participants (mean = 6.03) reporting higher glare scores than older participants (mean = 4.90).
Furthermore, simple main effect analysis for Luminance within each age group was highly significant for both younger (F(5, 140) = 46.76, p < .01) and older (F(5, 140) = 26.41, p < .01) participants. Multiple comparisons using the Bonferroni method indicated that, for the younger group, glare increased significantly in many combinations of luminance steps (except between 15.9 and 72.5 cd/m2, 72.5 and 198.6 cd/m2, 198.6 and 424 cd/m2, and 762 and 1,237 cd/m2). For the older group, adding to the results of the younger group, while glare also increased with luminance, the ratings at the highest levels (424, 762, and 1,237 cd/m2) did not differ significantly from each other, suggesting a possible plateau in glare perception among older participants at high luminance levels.
Effects of Luminance and Animation Type on Glare and Visibility 199 Comprehension Accuracy
The comprehension task required participants to correctly identify both the direction and the relative distance (location) indicated by the dynamic signs. The mean accuracy rates and standard deviations across all conditions are summarized in Table 1.
Figure 2: Perceived glare as a function of the RGB value. The error bar indicates 1 standard error.
A three-way repeated-measures ANOVA (Age × Animation Type × Luminance) was conducted on the accuracy scores. The results showed no significant main effects for Animation Type (F(1, 28) = 2.02, n.s.) or Luminance (F(5, 140) = 0.26, n.s.) and no significant interactions among the factors. A marginal trend was observed for the main effect of Age (F(1, 28) = 2.98, p < .10), with younger participants generally performing at near-perfect levels (mean > 0.867) compared with older participants.
Table 1: Summary of the comprehension accuracy, visibility, and readability results.
SD, standard deviation A three-way repeated-measures ANOVA (Age × Animation Type × Luminance) was conducted on the accuracy scores. The results showed no significant main effects for Animation Type (F(1, 28) = 2.02, n.s.) or Luminance (F(5, 140) = 0.26, n.s.) and no significant interactions among the factors. A marginal trend was observed for the main effect of Age (F(1, 28) = 2.98, p < .10), with younger participants generally performing at near-perfect levels (mean > 0.867) compared to older participants.
Notably, the accuracy exceeded 80% across almost all experimental conditions, with most conditions surpassing 85%. This suggests that neither high luminance levels nor the type of motion (slide or flash) significantly impaired the participants’ ability to correctly interpret the spatial information provided by the dynamic signs.
Effects of Luminance and Animation Type on Glare and Visibility 201 Visibility
Subjective ratings for visibility are summarized in Table 1. A three-way repeated-measures ANOVA revealed significant main effects for Animation Type (F(1, 28) = 5.47, p < .05) and Luminance (F(5, 140) = 3.57, p < .01). Furthermore, significant two-way interactions were observed for Age × Animation Type (F(1, 28) = 4.48, p < .05) and Age × Luminance (F(5, 140) = 2.82, p < .05).
Simple main effect analysis for the Age × Animation Type interaction showed that older participants rated the slide animation significantly higher than the flash animation (mean = 5.79 vs. 5.34; F(1, 28) = 9.92, p < .01). Conversely, for younger participants, there was no significant difference between animation types.
The Age × Luminance interaction revealed that younger participants’ visibility ratings peaked at moderate luminance and significantly decreased at higher levels (mean = 4.40 at 1237 cd/m2), whereas older participants maintained stable ratings even at the highest luminance levels (mean = 5.70 at 1237 cd/m2). Simple main effect analysis confirmed that younger participants rated high-luminance signs significantly lower than older participants at 762 cd/m2 (p < .05) and 1237 cd/m2 (p < .05).
Readability Subjective ratings for readability are summarized in Table 1. A three- way repeated-measures ANOVA also indicated a significant trend Age × Animation Type interaction. According to the simple main effect analysis, older participants rated the slide animation (mean = 5.49) as significantly clearer than the flash animation (mean = 5.03; F(1, 28) = 6.37, p < .05). Similar to the results for visibility, younger participants showed no significant preference between the two animation types for readability. These results suggest that the motion characteristics of dynamic signs have a more significant impact on subjective readability for the older population.
DISCUSSION
Age-Related Differences in Glare Perception A notable finding of this study was that younger participants reported higher glare scores compared with older participants at the maximum luminance level. This contradicts the common assumption that older adults are more sensitive to high luminance due to age-related changes such as cataracts. However, this result can be explained by the physiological reduction in retinal illuminance in the aging eye. Due to pupil miosis and the increased density and yellowing of the crystalline lens, significantly less light reaches the retina in older adults than in younger people (Owsley, 2011). Consequently, the absolute perceived brightness of the 1,237 cd/m2 stimulus likely remained within a more tolerable range for the older group, whereas it reached an “intolerable” level for the younger group, whose ocular media are more transparent.
Although older participants rated high-luminance signs as having greater visibility and readability compared with younger participants, this does not necessarily mean that high luminance is optimal for long-term exposure. The high ratings may stem from the increased contrast compensating for reduced visual function. However, the lack of perceived glare might mask underlying physiological strain. Even if a user does not “feel” the glare, the neural effort required to process high-contrast, high-luminance stimuli in a dark environment can induce significant visual fatigue over time (Sheedy et al., 2003).
Impact of Animation Type The interaction between age and animation type revealed that slide animations significantly improved visibility and readability for older adults. Flash stimuli often require the visual system to “re-acquire” information with each pulse, which might be more taxing for older eyes with slower neural processing speeds (Kim et al., 1994; Shinomori and Werner, 2003; Walsh, 1976). Slide motion provides a continuous visual cue, which appears to support smoother information integration for the elderly.
Limitations There are several limitations to this study. First, the visual stimuli were presented for only 3s. Although this is sufficient for evaluating immediate visibility, it does not account for the cumulative effects of prolonged exposure. Second, subjective ratings alone may not fully capture the physiological burden. Future studies should incorporate objective measures such as the pupillary light reflex to quantify latent visual fatigue, particularly in older adults who may not perceive glare as readily.
CONCLUSION
This study clarified the combined effects of luminance, animation type, and age on the perception of dynamic signs. The key findings are as follows: 1) neither high luminance nor animation type significantly impairs basic comprehension, with accuracy remaining high across all conditions; 2) perceived glare is primarily driven by luminance levels, with younger adults showing greater sensitivity to extreme luminance than older adults, likely due to differences in ocular transparency; and 3) slide animations are significantly more visible and readable for older adults.
For public spaces frequented by diverse age groups, moderate luminance combined with slide animations may offer the most accessible and comfortable solution.
ACKNOWLEDGMENT
This research was conducted with funding from the “FY2024 METI Rule Formation and Market Creation Standardization Promotion Project.”, via
Effects of Luminance and Animation Type on Glare and Visibility 203 Mitsubishi Research Institute, Inc. We thank Shingo Terada of RTC, Hiroko Ojima and Kiyoshi Okamoto of AIST for their significant assistance in the recruitment of participants, data acquisition, analysis and development of experimental programs.
REFERENCES
Folstein, M. F., Folstein, S. E. and McHugh, P. R. (1975). Mini-Mental State Examination (MMSE). Journal of Psychiatric Research, 12(3), pp. 189–198. Friedland, H., Snycerski, S., Palmer, E. and Laraway, S. (2017). The effectiveness of
glare-reducing glasses on simulated nighttime driving performance in younger and older adults. Cognition, Technology and Work, 19(4), pp. 629–640. International Organization for Standardization. (2002). Lighting of Work Places — Part 1: Indoor (ISO 8995-1:2002). International Organization for Standardization. (2021). Dynamic Signs in Physical
Environments Part 1: General Requirements (ISO 23456-1:2021). Kim, C. B. and Mayer, M. J. (1994). Foveal Flicker Sensitivity in Healthy Aging Eyes.
II. Cross-Sectional Aging Trends From 18 Through 77 Years of Age. Journal of the Optical Society of America A, 11(7), pp. 1963–1969. Luckiesh, M. and Guth, S. K. (1949). Brightnesses in Visual Field at Borderline Between Comfort and Discomfort. Illuminating Engineering, 44(11), pp. 650– 670. Owsley, C. (2011). Aging and Vision. Vision Research, 51(13), pp. 1610–1622. Sheedy, J. E., Hayes, J. N. and Engle, J. (2003). Is All Asthenopia the Same? Optometry
and Vision Science, 80(11), pp. 732–739. Shinomori, K. and Werner, J. S. (2003). Senescence of the Temporal Impulse Response to a Luminous Pulse. Vision Research, 43(6), pp. 617–627. Takahashi, H., Irikura, T., Moriyama, T., Toda, M. and Iwamoto, M. (2007).
Discomfort Glare and Annoyance Caused by White LED Lamps. In: Proceedings of the 26th Session of the CIE, Beijing, China. Walsh, D. A. (1976). Age Differences in Central Perceptual Processing: A Dichoptic Backward Masking Investigation. Journal of Gerontology, 31(2), pp. 178–185. Watanabe, H., Ito, N., Sagawa, K., Ujike, H., Sakata, R. and Furuhata, N. (2021).
Dynamic Signs: Multiple Attributes Determining Visibility. In: Proceedings of the 21st Congress of the International Ergonomics Association (IEA 2021), pp. 783–790. Watanabe, H., Ito, N., Sagawa, K., Ujike, H., Sakata, R. and Furuhata, N. (2025).
Dynamic Signs: Effects of Position and Age on the Detection of Signs During a Dual Task. In: Proceedings of the 22nd Congress of the International Ergonomics Association (IEA 2024), pp. 431–436.
LISTED IN THE AHFE DIGITAL BOOKSTORE CATALOGUE
Explore the complete digital volume
Human Factors and Ergonomics In Design
Read this individual research paper free through the original publisher, or explore the full digital proceedings book.
ISBN 978-1-964867-86-1
Explore this ISBN in the AHFE Bookstore ↗Listed in the July 2026 bookstore catalogue; search by ISBN to confirm current availability · Digital book purchase optional