Roger Jensen (2025). Transitioning Workplace Risk Assessments from Qualitative to Quantitative. In: Safety Management and Human Factors. AHFE Open Access, vol. 189, pp. 95–102. https://doi.org/10.54941/ahfe1006574
Risk-assessment grew out of a need for a feasible means to compare risks of a system after application of risk-reduction tactics. In workplace risk assessments, common parameters considered are predicted severity of hazardous outcomes and estimated likelihood of such outcomes occurring. Two fundamentally different ways of characterizing risk are qualitative and quantitative. Both approaches use a rectangular area for locating a risk indicator. This article explains these two approaches and how they affect accuracy of the risks depicted in the area. The qualitative approach uses a table structure in which columns are labeled using ordered terms for severity, while the rows are labeled using ordered terms for likelihood. Where rows and columns meet are cells, like in a spreadsheet, where entries indicate level of risk. The quantitative approach also uses a rectangular area but without being filled with rectangular cells; instead, risk indicators (RI) may be located anywhere with the risk area based on RI = Severity x Likelihood.Qualitative approaches involve dividing the risk area into rectangular spaces, like a chess board, where words or colors indicate risk level. A common approach to creating numbers for the cells is to assign order numbers to both severity and likelihood axes, then inserting a numeric into each cell based on multiplying the row and column order numbers. Although multiplying order numbers make no sense mathematically, the risk indicators resulting from this approach provides an easy means for separating zones of similar risk indicators. Quantitative approaches have a means for computing a numerical RI value for any point on the rectangular space. The system safety community has been using this approach for high-risk hazards like aviation crashes, nuclear power generation, and highly-hazardous chemical processes. The occupational safety community has recognized the mathematical validity of this approach, but embraced it only for high-hazard systems.A novel, mathematically justifiable, feasible, and accurate approach to create a valid risk-assessment matrix is described in this paper. It involves establishing each axes using a 0–100 scale with points in the risk area being RI = Severity x Likelihood. By connecting points of equal RI on a risk space, lines of iso-risk can be drawn in the risk area and used to serve as an employer’s criteria for risk acceptance or tolerance. An essential property of the axis scales for this approach is making each axis use a continuous scale in the range 0–100 based on prior research. The process envisioned for implementation of the quantitative approach involves using a risk-assessment team to evaluate a recognized hazard by: (1) each team member becomes familiar with the hazard, (2) uses judgment to assign numerical values to both severity and likelihood, then (3) plotting the team’s mean ratings on a risk area for comparison with an employer’s risk criteria. The whole process is to complement the typical compliance-focused approach to achieve safety by recognizing possibilities for reducing risk through reducing severity, reducing likelihood, or both.
The risk-assessment approach grew out of a need for a feasible means to compare risks of a workplace system with an organization’s level of risk acceptability.
Background
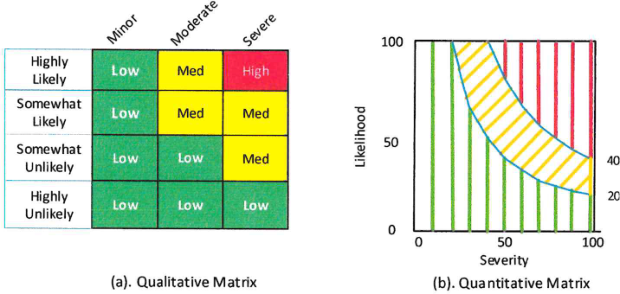
For a recognized hazard in a workplace, risk is commonly determined by considering two factors: one is severity of a hazardous event or exposure, the other is likelihood of the event or exposure. These are the factors used in this article. Similar factors used by some authors and organization refer to consequence and probability (Clemens et al., 2005; Nolan, 2011; Bahr, 2015; Duijm, 2015; Jensen, 2024). The format is typically presented as a chessboard-like rectangle with one axis for severity and the other for likelihood. In the rectangular area defined by severity and likelihood are indicators marking zones of similar risk commonly distinguished by the colours red, yellow, and green. Two fundamentally different ways of separating these zones are based on qualitative and quantitative axis scales. Examples in Figure 1 facilitate comparison of the two approaches.
Qualitative Approach The qualitative approach uses a table structure as depicted in Figure 1(a) in which columns are labeled using ordered terms for severity and the rows are labeled using ordered terms for likelihood. Where rows and columns intersect to form rectangular cells, like in a spreadsheet, are risk indicators (RI) using words, colours, or both.
Figure 1: Examples of risk-assessment matrices. The qualitative matrix on the left has 12 cells. The quantitative matrix on the right has both axes of 100 units, and shows iso-risk lines with values of 20 and 40 according to Risk = 0.01 x Likelihood x Severity.
Qualitative matrices use categorical scales for one or both axes. The 12 cells making up the risk area in Figure 1(a) use words and colors to indicate risk categories. Risk matrices with one categorical axis and one quantitative axis are considered qualitative or hybrid. The axis categories are intended to be ordered with clearly distinct categories. Traditionally, terms used as row and column headers are selected by the matrix designer or committee with little or no science. An example of how this approach is problematic was revealed by results of the survey of university students reported by Jensen and Hansen in 2020. They found the terms for row categories used in a well-known risk matrix includes categories that fail the goal of having clearly distinguishing adjacent categories.
A fundamental weakness of the qualitative (or categorical) approach is obtaining a numerical risk indicator to put into the cells. A common approach to creating numbers for the cells is to assign order numbers to both severity and likelihood axes, then inserting a numeric into each cell based on multiplying the row and column order numbers. Although multiplying order numbers makes no sense mathematically, the RIs resulting from this approach provide an easy means for separating zones of similar risk indicators (Lyon & Popov, 2020; Allen & Mahoney, 2025).
Quantitative Approach The quantitative approach also uses a rectangular area but without being filled with rectangular cells; instead, areas of similar risk are separated by curved iso-risk lines formed by the equation: Risk = 0.01 × Likelihood × Severity.
Transitioning Workplace Risk Assessments From Qualitative to Quantitative 97
As shown in Figure 1(b), both independent variables use a continuous line ranging from zero to 100. Quantitative approaches have a means for computing a numerical RI value for any point on the risk area. Although the risk area is not a true matrix, it is referred to as a matrix for this article. The system safety community has been using this approach for high-risk hazards like aviation crashes, nuclear power generation, and highly- hazardous chemical processes (e.g., Rausand, 2011). The occupational safety community has recognized the mathematical validity of this approach, but not embraced it. This could be due to a combination of the higher level of mathematics required and a sense the effort involved in finding more accurate RI values for common workplace hazards would exceed the utility of having more accurate estimates of risk.
METHODS
In Figure 1(b), both axes use a novel, mathematically justifiable, and accurate approach to create a valid risk-assessment matrix built on a foundation of the prior research described here. It involves establishing each axis as a 0–100 scale with points in the risk area computed by the product of severity (S) and likelihood (L). Lines of iso-risk can be drawn on the risk area and used to separate areas of similar risk. Typically, risk in the green and red areas indicate acceptable and unacceptable risk, respectively. Risk in the yellow area may be tolerable, depending on other factors such as financial considerations and assurance the risk has been reduced to as low as reasonably practicable (Marhavilas & Koulouriotis, 2021). This requires establishing continuous scaled axes.
Establishing Rating Scales In order to bring more science to occupational safety, an investigation into terms used for row and column headers of risk-assessment matrices was undertaken. The plan was to learn what terms are fitting for levels of severity and likelihood, and what numerical values each term means to users. The choice of a rating scale appropriate for this aim borrowed on an extensive body of knowledge on measurement used in risk perception studies. Three forms of response scales were found in the risk perception studies identified by the author of this paper as being relevant to employment risks. One form uses Likert-style responses to a hazardous scenario; two examples are Xia, Wang, Griffin, Wu, & Liu (2017), and Álvarez-Chávez et al. (2019). The second form used a rating scale with eleven numbers (0 through 10), for example Lin et al. (2025). The third form used a bi-polar rating line with only end points labelled, for example, overall risk of working in a college chemistry laboratory used end points “very small risk” to “very high risk” (Álvarez-Chávez et al., 2019). End point examples for a severity scale were “not at all severe” and “extremely severe” (Man, Chan, & Alabdulkarim, 2019). The third form of rating scale was also used by the author and students in two surveys (Jensen & Hansen, 2020; Jensen, Bird, & Nichols, 2022). Both studies were intended to identify terms in use relevant to severity, likelihood, and probability. The first study had 84 undergraduate students
98 Jensen
taking senior-level courses in engineering or occupational safety and health (Jensen & Hansen, 2020). Participants were given a paper survey notebook part of which contained pages for ratings. Each page contained a term and an appropriate rating scale for the participant to mark the location where that term belongs on a 100-length line with only end-points labelled. All terms came from books and journal papers discussing risk assessment matrices. Half the terms were found on one or more scales for severity while the other half were found on matrices using likelihood or probability axes. Rating line end points for severity were worst harm and no harm, and for likelihood certain and no chance. Based on the survey findings, we began analyses by discarding terms to not recommend because of ambiguity or large variability in responses. The remaining terms were further searched looking for sets potentially suitable for recommending as headers for rows and columns in qualitative matrices. Because risk-assessment matrices come in different sizes, sets of terms were chosen to fit three, four, five, and six rows for likelihood as well as three, four, and five columns for severity.
The second survey by Jensen et al. (2022) used Qualtrics survey software (Provo Utah USA) for online participants to respond directly. Using a 100-length rating line, participants were able to mark any point on the rating line thereby removing any influence of having markers between the end points. The terms recommended by the first study authors were followed up with the aim of confirming or improving the recommended terms by using graduate students enrolled in an industrial hygiene online program. Each student had at least two years of work experience in industrial hygiene, safety, or other related field. Some additional terms were added as candidates to fill parts of the axes not well covered by terms tested in the first study. All but one of the terms recommended from the first study were confirmed in the second study (Jensen et al.). The exception was the term “somewhat likely” which had medians of 60 and 40 and means of 53.4 and 45.5 in the first and second survey, respectively. In an effort to find a different term for the middle range of likelihood, the term “moderately likely” was added to the second survey resulting in median and mean values of 55 and 57, considered by the authors as suitable for recommending.
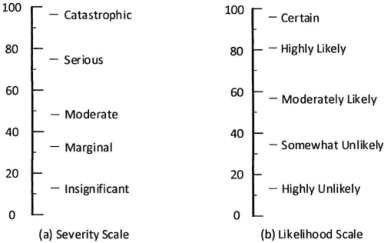
Innovating Two years after publishing the first and second studies on terms used in risk matrices, the author recognized the potential for using the ratings and terms for a different purpose—to serve a critical role in transitioning from qualitative matrices to quantitative matrices. The idea was to use applicable rating scales for the respective axes in quantitative matrices. Two rating lines are shown in the two panels in Figure 2, for severity and likelihood, respectively. Each line uses a 0–100 scale line with guide terms selected from results of the earlier surveys (Jensen & Hansen, 2020; Jensen et al., 2022).
Another attribute of this method for determining hazard-specific RIs lies in the distinction between subjective and objective data. As envisioned by the author, each RI of a defined system begins by having every member of the risk assessment team provide their ratings of severity and likelihood using the
Transitioning Workplace Risk Assessments From Qualitative to Quantitative 99
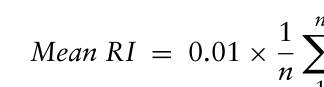
rating scales on Figure 2. Although these individual ratings are subjective, the computed average ratings of multiple individuals are objectively determined by equation. For example, for a specific hazard, each of the team members contributes a numerical rating of severity (Sn) and another for likelihood (Ln). The whole team’s mean RI for that hazard will then be computed from Equation 1 by multiplying 1/100 × Mean S × Mean L:
n X
n X
Equation reproduced from the original PDF.
1 Sn × 1
1 Ln. (1) A similar approach, except the judgments of team members are in the form of ranks instead of values on a continuous scale, was reported by Bejinariu, Darabont, Burduhos-Nergis, Cazac, and Chiriac-Moruzzi (2023).
Figure 2: The two rating scales being recommended for (a) severity and (b) likelihood as pathways for obtaining ratings by members of a risk assessment team based on their knowledge and understanding of the residual risks of a particular hazard.
RESULTS
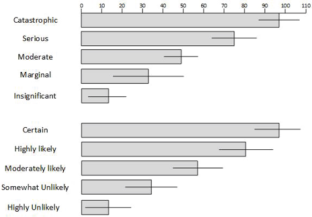
The key property of the axis scales is making each axis use a 0–100 range with guide words marking values as depicted in Figure 2. Guide word numerical values are the median values found in the earlier studies (Jensen, 2020 and Jensen et al., 2022). These rating lines are presented as the critical links for transitioning from the categorical to quantitative risk-assessment matrices. Figures 3 shows the guide words in order with bars indicating mean rating.
Figure 3: Bar Charts showing mean ratings and ± one standard deviations. Severity terms in upper panel, likelihood terms in lower panel.
100 Jensen
DISCUSSION
Implications for Occupational Safety Management Implementing a risk-assessment approach includes deciding on levels of risk acceptance, risk tolerance, and unacceptable risk. In the examples of quantitative approaches in Figures 1 and 3, iso-risk lines of 20 and 40 are displayed. These are for illustration only. Each organization needs to establish their own lines. Marhavilas and Koulouriotis (2021) provide guidance for establishing organization-specific risk acceptance criteria.
A vision of increasing use of risk-assessment approaches to complement traditional rule-based approaches will achieve safer employment in four ways.
First, risk-assessment approaches provide an alternative for managing hazards not adequately covered by required rules, regulations, and standards. Examples in the United States include hazards of manual lifting, repeated exertions, heat exposure, workplace violence, terrorism, and worker exposure to live-traffic in roadway work zones.
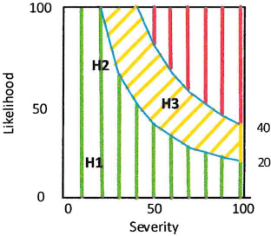
Second, RA teams following the approach described here avoid the shortcut of assigning RIs to hazards without first thinking through each of the two factors, severity and likelihood. An example might be a worksite with three hazards (H1, H2, H3) identified. By having each of the RA team members independently assign a value of Sn and Ln for each hazard, the average S and L value is used to compute the team’s average RI. Examples of hypothetical RI locations are plotted in Figure 3. The RIs plotted in the risk area provide a visual means for evaluating and prioritizing how each hazard compares to the employer’s risk tolerance according to the iso-risk lines 20 and 40. These three examples illustrate locations with low severity and low likelihood (H1), low severity and high likelihood, (H2), and mid-levels of both severity and likelihood (H3).
Figure 4: Quantitative risk matrix with risk indicators for three hazards plotted at their respective location.
Third, the process presented here also provides a means to quantify each factor, and their combined consideration, to arrive at an RI supported by justifiable considerations. An RI will never be perfect because it depends on estimating the future, but for purposes of risk management, the method of averaging judgments of multiple informed individuals should yield more objective risk estimates than more subjective means.
Transitioning Workplace Risk Assessments From Qualitative to Quantitative 101
Fourth, this approach will be feasible to implement while yielding more accurate values of risk than the qualitative approach.
ACKNOWLEDGMENT
The author greatly appreciates the editing by Hilary vanVleet.
Support for this project was provided in part by Montana Technological University’s Training Project Grant (T03 OH008630) from the National Institute for Occupational Safety and Health (NIOSH). The contents of this publication are solely the responsibility of the author and do not represent the official views of the CDC, NIOSH or the Department of Health and Human Services.
REFERENCES
Allen, P. E., & Mahoney, K. (2025, January). How to conduct a PPE risk assessment.
The Synergist, 36 (1). 28–31. Álvarez-Chávez, C. S., Marín, L. S., Perez-Gamez, K., Portell, M., Velazquez, L., & Munoz-Osuna, F. (2019). Assessing college students’ risk perceptions of hazards in chemistry laboratories. Journal of Chemical Education. 96, 2120–2131. Bahr, N. J. (2015). System safety engineering and risk management: A practical
approach (2nd ed.), (pp. 24–28). Boca Raton, FL, USA: CRC Press. Bejinariu, C., Darabont C., Burduhos-Nergis, D., Cazac, A., & Chiriac-Moruzzi, C.
(2023). Considerations regarding the application of the occupational injury and illness risk assessment method at workplaces/workstations, in relation to the ISO 45001 standard. Sustainability, 15(3), 2121. http://doi.org/10.3390/su15032121 Clemens, P. L., Pfizer, T., Simmons, R. J., Dwyer, S., Frost, J., & Olsen, E. (2005). The RAC matrix: A universal tool or toolkit. Journal of System Safety, 41(2), 14–19. Duijm, N. J. (2015). Recommendations on the use and design of risk matrices. Safety
Science, 76, 21–31. https://doi.org/10.1016/j.ssci.2015.02.014 Jensen, R. C. (2024 June). Seven attributes of risk assessment matrixes. Professional Safety, 26(6), 26–33. https://digitalcommons.mtech.edu/shih/50 Jensen, R. C., Bird, R. L., & Nichols, B. W. (2022). Risk assessment matrices for workplace hazards: Design for usability. International Journal of Environmental Research and Public Health, 19(5), 2763. https://doi.org/10.3390/ ijerph19052763 Jensen, R. C., & Hansen, H. (2020). Selecting appropriate words for naming
the rows and columns of risk assessment matrices. International Journal of Environmental Research and Public Health, 17(15), 5521. https://doi.org/ 10.3390/ijerph17155521 Lin, C., Zheng, K., & Man, S. S. (2025). Risk perception scale for laboratory safety: Development and validation. International Journal of Industrial Ergonomics, 105, 103689. https://doi.org/10.1016/j.ergon.2024.103689 Lyon, B. K. & Popov, G. (2020). Managing risk through layers of control.
Professional Safety, 65(4), 25–35. Man. S. S., Chan, A. H. S., & Alabdulkarim, S. (2019). Quantification of risk perception development and validation of the construction worker risk perception (CoWoRP) scale. Journal of Safety Research, 71, 25–39. Marhavilas, P. K & Koulouriotis, D. (2021). Risk-acceptance criteria in occupational
health and safety risk-assessment—The state-of-the-art through a systematic literature review. Safety, 7, 77. https:/dov.org/10.3390/safety7040077
102 Jensen
Nolan, D. P. (2011). Loss prevention and safety control terms and definitions of risk assessment (pp. 231–234). Boca Raton, FL, USA: CRC Press. Rausand, M. (2011). Risk assessment: Theory, methods, and applications (pp. 99–102). Hoboken, NJ, USA: Wiley. Xia, N., Wang, X., Griffin, M. A., Wu, C., & Liu, B. (2017). Do we see how
they perceive risk? An integrated analysis of risk perception and its effect on workplace safety behaviour. Accident Analysis and Prevention, 106, 234–242. https://doi.org/10.1016/j.aap.2017.06.010
LISTED IN THE AHFE DIGITAL BOOKSTORE CATALOGUE
Explore the complete digital volume
Safety Management and Human Factors
Read this individual research paper free through the original publisher, or explore the full digital proceedings book.
ISBN 978-1-964867-65-6
Explore this ISBN in the AHFE Bookstore ↗Listed in the July 2026 bookstore catalogue; search by ISBN to confirm current availability · Digital book purchase optional