Chenxiang Jiang, Shiguang Deng (2023). Human-computer Interaction Evaluation Method for Nuclear Power Plant Control Room Based on Operator Physiological Characteristics. In: Human Interaction & Emerging Technologies (IHIET 2023): Artificial Intelligence & Future Applications. AHFE Open Access, vol. 111, pp. 402–408. https://doi.org/10.54941/ahfe1004046
In the design optimization process of the control room in a nuclear power plant, personnel workload is an important evaluation indicator. A well-designed control room can effectively reduce the workload of operators during their work processes, improve work outcomes and efficiency, and reduce the possibility of accidents caused by human errors. Currently, subjective evaluation methods are mainly used to evaluate personnel workload in related research. These methods are simple and easy to implement with short evaluation times, but they are highly subjective and difficult to perform a comprehensive and objective quantitative evaluation. Physiological measurement method is a research approach that observes and measures the physiological data changes related to behavior in order to analyze the state of individuals, providing more objective and reliable quantitative results. With the advancement of sensor and computer technology, it has become a hot research topic. Among them, physiological characteristics such as electroencephalography (EEG) and eye movement are widely studied, and their relationship with the psychological and mental states of individuals have been fully medically validated. This paper proposes a method for evaluating the workload of nuclear power plant control room operators by collecting EEG and eye movement physiological signals and analyzing their features using advanced machine learning algorithms. It also explores evaluation methods for control room design achievements.
With the gradual improvement of the design level of nuclear power plant main control rooms, as well as the continuous maturation of digital and intel- ligent technologies, the human-computer interaction (HCI) design within the main control room has received increasing attention. HCI refers to the pro- cess of information exchange and instruction issuing between human beings and intelligent electronic devices such as computers, and involves knowledge from multiple fields such as information science, biomedical science, psych- ology, and design, possessing significant significance in the development of modern information technology. Better HCI design can ensure the functional
Human-Computer Interaction Evaluation Method for Nuclear Power Plant Control Room 403
and usability realization of the system, improve user work efficiency and sense of achievement, and reduce the risk of accidents caused by mistakes during the operation process. Due to the special requirements of the nuclear power plant operator tasks, good main control room HCI design is of great significance to the safety and efficient production of nuclear power plants, and how to accurately quantify and evaluate the design results interface as a basis for iterative improvement of design outcomes has been a hotspot in the HCI design field.
In recent years, with the rapid progress of human physiological data acquisition and analysis technology, it has become possible to use human phy- siological characteristics to analyze user’s operating behavior. More and more scientific research institutions and commercial organizations have started to use physiological data collection technologies such as electroencephalogra- phy (EEG), electrocardiography (ECG) and eye tracking as an evaluation system in the design and development process, and have achieved many practical application values in many fields with strong correlations to user behavior, including aviation, aerospace, navigation, transportation, sports science, and game design.
As a means of evaluating human-machine interaction in control rooms, physiological feature analysis holds significant innovative value for quanti- tatively evaluating design effectiveness and user experiences. In recent years, there have been a few cases in the nuclear power field utilizing physiolo- gical feature research methods to analyze personnel workload and evaluate control room design. However, the research direction and methods are still limited, and mostly focus on a single type of physiological feature analysis, with accuracy needing improvement. In this paper, we will collect EEG and eye-tracking physiological signals and perform multimodal feature analysis using advanced machine learning algorithms to evaluate the workload of con- trol room operators in nuclear power plants, and explore evaluation methods for control room design based on this analysis.
Technical Background An increasing number of researchers have recognized the advantages of synchronously recording eye movement data with EEG or other electrophy- siological equipment. Single physiological data is no longer sufficient for current research needs. The primary benefit of combining eye movement technology with EEG is the ability to use eye movement data as a chan- nel to correct the artifacts generated by eye movements. Blinking and eye movement itself (even tiny microsaccades) can have a profound impact on the EEG signal and cause serious problems for subsequent analysis. Eye move- ment in natural settings is an active process involving several saccades per second. However, during most EEG data collection, participants are asked to blink as little as possible and record the process of long-term gaze fixation on the screen, which leads to conscious brain activity and less-than-perfect recording. On the other hand, because eye movement data itself reflects beh- avior, it cannot directly reflect cognitive and thinking processes. Therefore, eye movement research requires good experimental design to interpret eye
404 Jiang and Deng
movement data correctly, or needs to be combined with interviews, retrospe- ctive testing, and other methods to reflect cognitive and thinking processes. EEG research compensates for this deficiency in eye movement research and can be naturally combined with eye movement research. This combination can not only accurately interpret eye movement data but also objectively and accurately reflect the psychological processes of participants. In addition, simultaneously recording eye movement and EEG data has other purposes, such as using eye movement to monitor eye drift, control fixation, and mea- sure saccade reaction time (Plöchl et al. 2012). From the results, it can be seen that the performance obtained by combining two different modalities is often stronger than using a single modality. In the study of specific pro- blems such as emotion recognition, eye tracking and EEG each have their advantages in identifying different types of emotions. Due to the complemen- tary nature of the recognition characteristics in both modalities, the use of modal fusion techniques such as bimodal deep auto-encoder can significantly improve classification accuracy (Zhao et al. 2019).
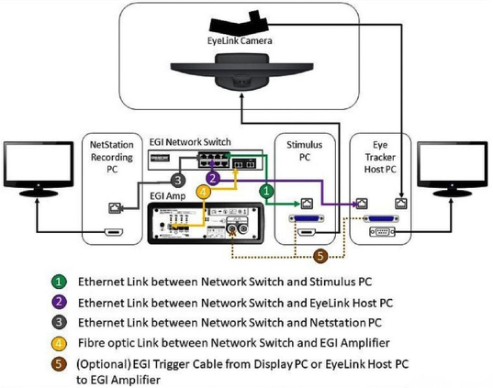
Experiment Design Synchronization of signal data is an important and inevitable technical issue in the study of multimodal physiological signals. If the timestamp of the trig- gering event fails to ensure correct synchronization, the results obtained may be completely useless. Currently, there are relatively mature ways of synchro- nizing eye tracking and electroencephalogram (EEG) signals. One of the most common examples is shown in the Figure 1, where by connecting 2, 3, and 4 in the local network, information can be sent from a Stimulus PC through the Ethernet port to the main hosts of eye tracking and EEG acquisition to achieve synchronization.
Figure 1: Example of synchronizing eye tracking and EEG signals. (Adapted from Eyelink, 2019.)
Human-Computer Interaction Evaluation Method for Nuclear Power Plant Control Room 405
Eye trackers can generally be divided into three types: desktop, glasses, and VR plug-in. The desktop eye tracker camera is located below the screen, and the movement of the head can cause a change in the relative position between the eyeball and the camera, affecting calibration. Therefore, in experiments, it is necessary to keep the head’s position basically fixed. However, in the actual working environment of the nuclear power plant control room, the operator’s line of sight often needs to switch between multiple screens, and they need to repeatedly lower their head to check various paper documents. The desktop eye tracker obviously does not meet the experimental scene requirements. The camera of the glasses eye tracker is fixed on the frame, and its relative position with the eyeball is fixed, making it more suitable for experiments with larger head movement amplitudes.
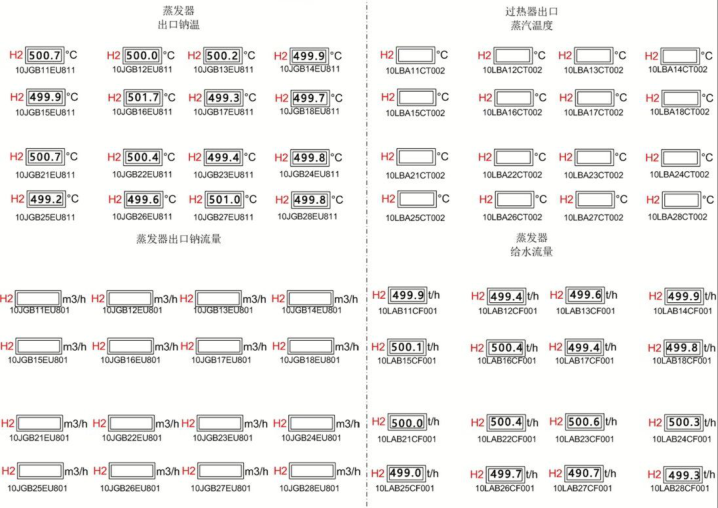
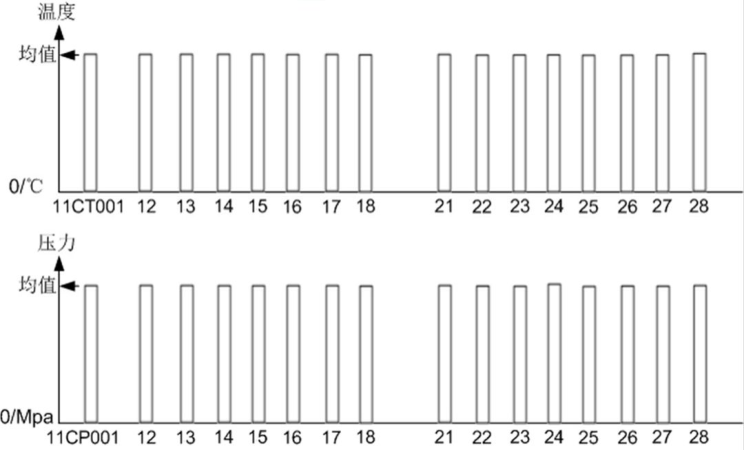
An experiment was conducted based on the design of two different moni- toring pages used by operators in the actual main control room of a nuclear power plant. Data was collected from the experiment to compare the advan- tages of different design formats in information transmission efficiency, serving as the evaluation basis for interface interaction level. The selected pages are shown as in the figure 2 and 3.
Multiple groups of subjects were selected to conduct the experiment. The subjects had a certain understanding of the daily operation and maintena- nce work of nuclear power plants, and their professional cognitive level was further quantitatively distinguished by analyzing factors such as their emotions during testing through the collected electroencephalogram (EEG) signals.
Figure 2: Previously used system pages.
406 Jiang and Deng
Figure 3: Currently used system pages.
RESULTS
The eye movement and data collected during the experimental process are processed and presented in Table 1. In the EEG data, a series of features were extracted from the raw waves such as alpha and beta by referencing similar studies that utilized alpha/beta features (Kim et al. 2020). By uti- lizing this data for machine learning classification and combining it with subjective ratings of the operator’s state during the task, a model can be esta- blished between the operator’s work state and physiological indicators for subsequent evaluation.
For the two selected different page designs, eight tasks of varying difficulty were arranged for each, divided into two stages. The eye-tracking trajectory
Table 1. Partial subjects’ EEG and eye movement physiological data.
Human-Computer Interaction Evaluation Method for Nuclear Power Plant Control Room 407
recorded by the eye tracker and the operation records of the subjects in the system were used to comprehensively analyze the time taken by the subje- cts to complete each stage of the task, as shown in Table 2. The obtained time can be used as the main basis for evaluating operator work performa- nce and can also be used to compare the difficulty gradient of the designed tasks.
Different machine learning algorithms were chosen to establish classi- fication models. The accuracy of the models was evaluated using cross- validation, and the results are shown in Table 3. Finally, the SVM algorithm with a three-time kernel function was selected to establish the model.
Model Kernel Accuracy (%) Precision Recall F1 Score SVM Linear 74.4 0.89 0.67 0.76 Quadratic 82.1 0.89 0.76 0.82 Cubic 84.6 0.83 0.83 0.83 Fine Gaussian 82.1 0.72 0.87 0.79 Medium Gaussian 71.8 0.83 0.65 0.73
/ 74.4 0.89 0.67 0.76 Random Forest ANN Narrow Neural Network RE LU 74.4 0.72 0.72 0.72 Medium Neural Network 74.4 0.72 0.72 0.72 Wide Neural Network 74.4 0.78 0.70 0.74 Double-layer Neural Network 74.4 0.78 0.70 0.74
CONCLUSION
From a results perspective, graphic display page design can efficiently convey information and enable operators to complete tasks more quickly and effi- ciently, compared to numeric page design, thereby enhancing interaction efficiency.
In this study, we established a model between EEG and eye movement physiological indicators and subjects’ work states, achieving high accuracy. In the process, we found that the fusion of both indicators produced better results than a single physiological indicator, validating the current trend of multi-modal physiological indicator research.
We explored the relationship between subjects’ physiological indicators, work states, and work performance, and thereby established an evaluation system for interaction design effectiveness, providing insights for future rela- ted research. With the rapid development of machine learning technology, more advanced algorithms can improve the accuracy of models and allow for more accurate analysis of physiological indicators to reflect work states and interaction effects.
ACKNOWLEDGMENT
The HFE team members of CNPE have provided very helpful assistance in the experimental work of this study, and we would like to express our gratitude.
REFERENCES
Kim, J. H., Kim, C. M., Jung, E. S., & Yim, M. S. (2020). Biosignal-based attention monitoring to support nuclear operator safety-relevant tasks. Frontiers in computational neuroscience, 14, 596531. Plöchl, M., Ossandón, J. P., & König, P. (2012). Combining EEG and eye tra-
cking: identification, characterization, and correction of eye movement artifacts in electroencephalographic data. Frontiers in human neuroscience, 6, 278. Zhao, L. M., Li, R., Zheng, W. L., & Lu, B. L. (2019, March). Classification of five emotions from EEG and eye movement signals: complementary represen- tation properties. In 2019 9th International IEEE/EMBS Conference on Neural Engineering (NER) (pp. 611–614). IEEE.
Read this individual research paper free through the original publisher, or explore the full digital proceedings book.
ISBN 978-1-958651-87-2
Explore this ISBN in the AHFE Bookstore ↗Listed in the July 2026 bookstore catalogue; search by ISBN to confirm current availability · Digital book purchase optional