Rossella Capotorto, Pietro Aricò, Andrea Giorgi, Gianluca Di Flumeri, Gianluca Borghini, Simone Ercoli, Alessia Ricci, Marianna Cecchetti, Francesca Dello Iacono, Daniele Germano, Fabio Babiloni, Vincenzo Ronca (2026). The Group Synergy Metric: Quantifying Teamwork in Triads via Wearable EEG and Total Correlation. In: Human-Computer Interaction & Emerging Technologies. AHFE Open Access, vol. 233, pp. 155–166. https://doi.org/10.54941/ahfe1007515
Effective teamwork monitoring is critical in operational environments, yet current EEG hyperscanning is often limited to dyads and strict synchronization. This study introduces the Group Synergy Metric (GSM), an Information Theoretic framework based on Total Correlation, designed to quantify cooperation in triads using wearable EEG. Unlike traditional coherence, GSM captures non-linear dependencies in mental states (Workload, Approach-Withdrawal) without requiring strict temporal alignment. Triads performed a modified cooperative game ("Keep Talking and Nobody Explodes") across Training, Solo, and Teamwork conditions of varying difficulty. Results demonstrated the GSM’s sensitivity to group dynamics (ANOVA, p < 0.001). Post-hoc analyses revealed that the Training phase elicited the highest synergy, while the Solo condition showed significantly reduced values compared to cooperative scenarios. An analysis of teamwork density over time showed sensitivity to task difficulty highlighting higher density in the training phase. Despite limitations regarding entropy estimation on short windows, these finding benchmark the discriminative power of the proposed index, despite theoretical limitations, verifying if it maintains the robustness necessary to distinguish not only between Cooperative and Solo conditions but also among different degrees of task difficulty.
In high-risk and operational environments, effective teamwork is a critical determinant of both safety and performance. Domains such as aviation, emergency response, healthcare, and military operations increasingly rely on small teams that must coordinate efficiently under time pressure and high demand tasks (Salas et al., 2025). As a result, the capability to objectively
quantify the degree of cooperation between individuals becomes critical to prevent serious and sometimes fatal human errors, especially in operational environments (OE). Despite the recognized importance of teamwork, its objective and continuous quantification remains a methodological challenge. Traditional approaches in human factors research rely on behavioural observations, self-reports, or performance metrics, which often lack temporal resolution and are susceptible to subjective bias (Parasuraman and Wilson, 2008; Dienes and Perner, 2004). Additionally, the idea of quantifying a team metrics combining individuals’ perception or through an external individual observing the team working makes these measures even more prone to errors. In parallel, to obtain these measurements from operators, it is necessary to interact with them or ask them to stop the task to compile the questionnaire, and this leads to difficulties to evaluate their state throughout particular activities. To address all of these limitations, in recent years, neurophysiological monitoring, particularly electroencephalography (EEG), has emerged as a promising avenue for assessing objectively teamwork among individuals. EEG-based hyperscanning techniques have been employed to investigate neural synchronization and inter-brain connectivity as markers of cooperation and social interaction. However, most existing studies focus on dyadic interactions and require strict temporal alignment between signals, typically achieved in laboratory settings with wired EEG systems (Bevilacqua et al., 2019; Richard et al., 2021; Toppi et al., 2016; Liu et al., 2018). The push towards simulated or realistic operational environments is driven by the need to capture cooperative phenomena with higher ecological validity, observing how teams function under naturalistic constraints rather than in lab settings that may fail the reconstruction of real teamwork dynamics. To enable this ecological shift, the field is necessarily transitioning from bulky, wired setups to lightweight, wearable EEG solutions that allow for mobility and natural interaction (Borghini et al., 2014; 2023; Capotorto et al., 2024).
Wearable EEG devices offer a practical alternative for OE applications, but they introduce challenges related to signal quality, temporal jitter, and reduced channel count. In this context, metrics that depend on precise phase-locking or time-locked synchrony may not be robust enough. There is therefore a need for alternative computational frameworks capable of capturing collective cognitive dynamics without relying on strict temporal synchronization. To address these limitations, the present study introduces the Group Synergy Metric (GSM), a novel information-theory (Cover, 2021) based index designed to quantify teamwork in triads using wearable EEG data. Building upon a previously validated dyadic framework based on Mutual Information, the GSM extends the concept to multi-agent systems by leveraging the notion of Total Correlation, allowing the quantification of shared informational structure among three team members. By focusing on entropy-based measures derived from neurophysiological indicators of mental states, the proposed approach aims to provide a robust and scalable metric of group-level synergy. Notably, the GSM has already been applied to the same experimental dataset using the raw EEG signal directly (de C. Hamilton, 2021). This signal-level implementation offers stronger statistical robustness, as it avoids intermediate modelling assumptions and maintain the full EEG time resolution exploiting
The Group Synergy Metric: Quantifying Teamwork in Triads 157 also the full information content of the EEG time series. However, while statistically advantageous, signal-level approaches provide limited insight into the cognitive and psychological processes underlying teamwork. In contrast, the feature-based implementation adopted in the present study represents a deliberate and complementary methodological choice. By computing the GSM on neurophysiological features associated with well-established mental constructs, such as mental workload and approach–withdrawal, the proposed approach enables a psychologically interpretable characterization of group synergy. This feature-level formulation allows the GSM to be linked not only to statistical dependencies across brains, but also to meaningful cognitive and affective mechanisms that support cooperative behaviour.
Taken together, these two implementations define a coherent framework in which signal-level and feature-level analyses serve distinct but complementary purposes: statistical robustness on the one hand, and interpretability of teamwork-related mental processes on the other. The present study therefore focuses on the feature-level implementation of the GSM, demonstrating that, despite the loss of information inherent to feature extraction, the metric preserves its ability to discriminate between different levels of cooperation. At the same time, this formulation offers a substantial advantage in terms of interpretability, enabling the mapping of group synergy onto well-defined cognitive and affective constructs such as mental workload and motivational orientation. Together, these findings support the GSM as a robust and flexible framework, capable of operating across different levels of signal abstraction while maintaining sensitivity to teamwork dynamics.
Finally, the specific objectives of this study can be summarized as follows:
- To evaluate the proposed Teamwork index (based on EEG power features) in triadic groups within an ecological, simulated operational environment using a wearable EEG system. - To assess the metric’s sensitivity in distinguishing not only between Cooperative and Solo conditions but also between different levels of cooperation complexity driven by task difficulty.
MATERIALS AND METHODS
Fifty-seven healthy volunteers, all master’s degree students with normal or corrected-to-normal vision, participated in the study. Participants were organized into triads, resulting in twenty-five independent cooperative groups. To minimize confounding effects related to prior expertise, none of the participants had previous experience with the task or protocol, and team composition was balanced to ensure comparable baseline familiarity. All participants provided written informed consent, and the study was approved by the local ethics committee in accordance with the Declaration of Helsinki.
The experimental task consisted of a cooperative bomb-defusal simulation adapted from Keep Talking and Nobody Explodes (Steel Crate Games). The original dyadic format was modified into a triadic task by splitting the instruction manual into two complementary parts, ensuring that no single participant possessed all the information required to solve the task. This enforced continuous communication and interdependence, meaning that aligned mental states were intrinsically linked to the cooperative effort rather than just observing the same stimuli.
The protocol was structured into three main phases. During the Training phase, teams performed the task under expert supervision, receiving guidance aimed at fostering effective teamwork strategies. This was followed by the Teamwork phase, in which teams autonomously completed bombs of increasing difficulty (i.e., Easy, Hard, SuperHard), presented in random order, and concluded with a Sound condition, consisting of a SuperHard task with added auditory disturbance to increase cognitive and communicative load. Finally, during the Calibration (i.e., Solo) phase, each participant performed an easy task individually with access to the full manual, providing a baseline for teamwork-related analyses. Two preliminary EEG recordings were also collected to estimate individual alpha frequency (Klimesch, 1999) and to calibrate ocular artifact correction.
After each phase the players were asked to fill a simple questionnaire with the aim to collect their subjective perception of task difficulty and cooperation in the relative phase on a 10-point Likert scale. We opted for a pen-and- paper format rather than a digital interface to facilitate rapid administration (Gwaltney et al., 2008). This logistical choice allowed participants to fill out the questionnaire immediately following the task execution, thereby minimizing the time interval between the experience and the report and ensuring that their responses accurately reflected their immediate perceptions. EEG data were collected using the Mindtooth wearable system from eight scalp locations (AFz, AF3, AF4, AF7, AF8, PZ, P3, and P4), referenced to the right mastoid and grounded to the left, at a sampling rate of 125 Hz. Signals were pre-processed using standard procedures, including notch filtering, band-pass filtering (2–30 Hz), and artifact correction. Ocular artifacts were corrected using a multichannel Wiener filter, and residual artifacts were rejected based on amplitude thresholds (Ronca et al., 2025; 2024). Data were segmented into 1-second epochs, and only recordings with at least 75% valid data were retained to ensure reliable estimation of neurophysiological indices. Time windows with insufficient clean data were excluded from analysis. For each individual, individual alpha frequency (IAF) was computed on the eyes closed EEG signal and GFP (Global Field Power) (Skrandies, 1990; Vecchiato et al., 2014) features were computed among the among individual frequency bands described in Table I.
Table 1: Frequency bands definition.
Table available in the original PDF paper.
Band Limits Theta [(IAF – 6)(IAF – 2)] Hz
Alpha [(IAF – 2)( IAF + 2)] Hz
Mental Workload Index (Sciaraffa et al., 2022) and Approach Withdrawal Index (Di Flumeri et al., 2017) features have been assessed over time for each individual:
3 4
Z
W t GFP AF AF AF GFP P P P
Z ( ) ( , , ) ( , , )
3 4
AW t GFP GFP AF AF ( ) ( ) ( ) 4 3 where GFPx represents the GFP evaluated on the individual x-band.
The Group Synergy Metric: Quantifying Teamwork in Triads 159 Teamwork Index
The presented EEG-based Group Synergy Metric (GSM) Index is based on the assumption that teamwork could be modelled as the output of a multivariate system composed of the interaction between behavioural, affective, and cognitive mechanisms belonging to the individuals within the team (Capotorto et al., 2024; Sciaraffa et al., 2021; Ronca et al., 2025). The GSM index was obtained by computing the Total Correlation, a multivariate extension of Mutual Information, between the individuals’ MWL and AW over 60s time windows with a 15s shift. In other words, the GSM provides an objective indication of the maximum information shared between three random variables, including multivariate variables (Cover, 1999; Watanabe, 1960). Formally, let X = {x1, x2, x3} denote the set of feature vectors associated with the three teammates, where for each participant i, the vector xi(t) = [AWi(t), Wi(t)] consists of the Approach–Withdrawal and Workload indices extracted at time t. To reduce the dimensionality of the dataset and improve the robustness of the subsequent statistical estimation of probability distributions, Principal Component Analysis (PCA) (2002) was applied independently to the feature space of each participant. For each individual, only the first principal component, accounting for the largest portion of variance across time, was retained and used as the representative mental state feature for the computation of the Group Synergy Metric. The GSM is defined as the difference between the sum of the individual entropies and the joint entropy of the entire system:
3
Equations and mathematical formulas are available in the original paper PDF.
1 2 3
i ( , , ) (x ) ( , , ) 1 2 3
1
where: −H(xi) is the Shannon Entropy of the signal from participant i, representing the individual information content (uncertainty);
H p p t t log
−H(x1, x2, x3) is the Joint Entropy of the traid’s features, representing the uncertainty of the system as a whole. The assessment of the Joint Entropy is computed according to the previous formula. Here, the term p denotes the joint probability of the co-occurring states across the three-time series, capturing the global uncertainty of the system.
The resulting index quantifies the total constraints or redundancy within the group. A GSM value approaching zero implies that the teammates’ neural activities are statistically independent (no group coordination). Conversely, higher GSM values indicate a high degree of information integration, suggesting that the triad has self-organized into a tightly coupled neurophysiological state.
The percentage of teamwork time has been computed by determining how long the teamwork neurophysiological index was above the cooperation
threshold. The cooperation threshold has been established as the GSM median evaluated along the Solo condition tasks (i.e., Calibration).
PERFORMED STATISTICAL ANALYSIS Comparisons of the GSM Teamwork Index across experimental phases were conducted using ANOVA, after verifying all necessary assumptions. The Greenhouse-Geisser correction was applied in cases where the assumption of sphericity was violated. Standard Holm post-hoc tests were performed to explore pairwise differences. Taking into account that while these tests are conservative due to corrections for multiple comparisons, any significant findings obtained through them are considered particularly robust. However, to examine specific patterns without compromising statistical power, an additional planned contrast analysis was conducted (Contrast analysis for competing hypotheses, n.d.). Unlike classical ANOVA, which only indicates whether at least one mean differs from the others, contrast analysis allows for the direct testing of complex, theory-driven hypotheses concerning the structure of these differences. In the present study, this approach was used to assess whether the overall cooperative conditions differed from a single calibration condition, applying the weights reported in Table 2.
A total of 25 teams were initially recruited. However, data from seven teams were excluded from the analysis due to excessive EEG artifacts or technical noise. Consequently, the final sample consisted of 19 valid teams. A priori power analysis performed with G*Power 3.1.9.4 (Faul et al., 2007) indicated that, under the described conditions, the Repeated Measures ANOVA achieved a statistical power of 82.5% (1–β = 0.819). Given that the conventional threshold for acceptable power is 80%, this result confirms that the study possesses sufficient statistical sensitivity to detect medium effect sizes (i.e., η²p = 0.06) (Statistical Power Analysis for the Behavioral Sciences, n.d.).
RESULTS
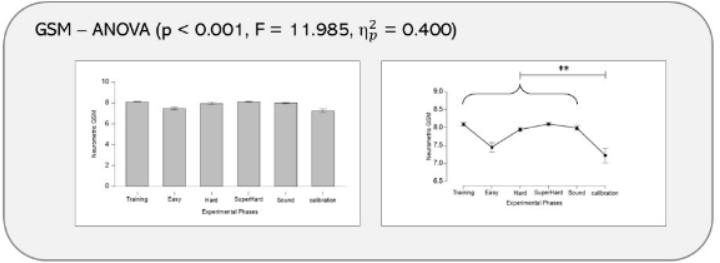
As shown in Figure 1 MSG repeated measures ANOVA resulted in statistically significant result, demonstrating that, at least one distribution differs from the others. Post hoc analyses reported fully in Table 3 and contrast analyses
The Group Synergy Metric: Quantifying Teamwork in Triads 161 presented (p = 0.005**, Cohen’s d = 6.614) reveal a consistent pattern: post-hoc comparisons primarily highlighted significant differences between experimental conditions while, the planned contrast analysis, yielded significant effects in comparing all the Teamwork conditions (i.e., Training, Easy, Hard, SuperHard, Sound) and the Solo condition (i.e., Calibration).
Figure 1: Repeated measures ANOVA analysis. The figure on the left represents the bar plot of the distributions of the corresponding index across the experimental conditions representing the index on a more ecological y-axis. While on the right side the plot represents mean and standard error of the distributions across the teams in a convenient shaped y-axis that highlights better the differences in the distributions. In this right plot the markers represent the statistical significance of the contrast analysis described in Table 2.Table 3: Post-Hoc Analysis results, significance is flagged as follows: * p < .05, ** p < .01.
Table available in the original PDF paper.
Mean Difference SE df t pholm Training Easy 0.667 0.139 18 4.798 0.002 ** Hard 0.167 0.071 18 2.358 0.209
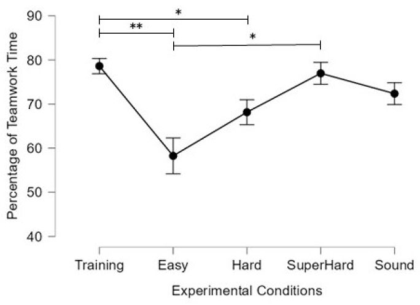
Figure 2 illustrates the percentage of time spent in a teamwork state (Cooperation Density). The repeated-measures ANOVA revealed a statistically significant main effect (F = 8.328, p < 0.001, η²p = 0.305). Post- hoc comparisons, detailed in Table 4 and visualized in Figure 2, highlight significant differences between conditions. Notably, the Training phase emerged as the condition characterized not only by the highest magnitude of synergy but also by the highest density of cooperation over time.
Figure 2: Repeated measures ANOVA analysis on Teamwork time. In this right plot the markers represent the significative post-hoc reported also in Table 5.Table 4: Teamwork Time percentage Post-Hoc Analysis results, significance is flagged as follows: * p < .05, ** p < .01.
Table available in the original PDF paper.
SE df t pholm
Mean Difference Training Easy 21.428 4.761 18 4.501 0.003 **
The primary aim of the present study was to evaluate whether the Group Synergy Metric, when applied to EEG power–derived features, is capable of quantifying different levels of teamwork in triadic groups.
The Group Synergy Metric: Quantifying Teamwork in Triads 163 The repeated-measures ANOVA conducted on the GSM values revealed a statistically significant main effect of the experimental phase, indicating that the proposed metric is sensitive to differences in task structure and cooperation demands across conditions. Post-hoc analyses and planned contrast comparisons revealed a consistent and meaningful pattern. In particular, the contrast analysis showed a significant difference between the aggregated Teamwork conditions (Training, Easy, Hard, SuperHard, Sound) and the Solo (Calibration) condition. This result represents a key validation of the GSM: regardless of task difficulty or external perturbations, cooperative scenarios consistently elicited higher group synergy than individual task execution. The post-hoc comparisons further refined this picture. The Training phase exhibited significantly higher GSM values compared to both the Easy Teamwork and Solo conditions. This result suggests that guided interaction, supported by expert feedback and shared strategy formation, promotes a highly structured form of cooperation, leading to stronger alignment of team members’ mental states. Interestingly, the Training condition did not significantly differ from the more demanding Teamwork conditions (Hard, SuperHard, Sound), indicating that structured guidance may compensate for task difficulty by fostering more effective coordination strategies. These statements are also supported by the teamwork time analysis that resulted in higher density of teamwork over time in the training condition also reflecting the same trend observed in Figure 1. Overall, the statistical results demonstrate that the GSM is capable of distinguishing between individual and cooperative task execution, identifying structured cooperation during training, and capturing meaningful modulations in teamwork as a function of task difficulty.
This work extends previous findings in which the same information- theoretic framework was applied directly to raw EEG signals, demonstrating a clear distinction between cooperative and individual task conditions. In those earlier investigations, significant differences between Teamwork and Solo conditions emerged predominantly within the alpha and theta frequency bands (de C. Hamilton, 2021). Importantly, these frequency ranges are not introduced here as a result of post-hoc optimization but rather emerge naturally as a point of convergence between signal-level and feature-level analyses. In the present study, the selected features, mental workload and approach– withdrawal, are grounded in established neurophysiological models and are themselves primarily derived from power modulations in the alpha and theta bands. Thus, the correspondence between the frequency bands identified in the signal-level analysis and those underlying the selected features represents a meaningful convergence rather than a circular methodological choice. This convergence provides additional support for the hypothesis that cooperative processes are strongly associated with modulations in alpha and theta activity. Alpha-band dynamics have long been linked to attentional allocation and cognitive effort, while theta activity is commonly associated with executive control and working memory demands, functions that are critically engaged during cooperative problem solving. The fact that the GSM remains sensitive to teamwork dynamics when computed on features reflecting these bands suggests that the essential information driving group-level synergy is preserved
even after feature extraction. Moreover, previous signal-level analyses highlighted that cooperative behaviour was primarily expressed over frontal electrode sites. This spatial distribution is particularly relevant in the context of the present study, as both workload and approach-withdrawal metrics rely heavily on frontal EEG activity. Frontal regions are known to play a key role in executive functions, decision-making, and motivational processes, all of which are central to effective teamwork. The alignment between the spatial patterns observed in raw EEG analyses and the neuroanatomical focus of the extracted features further strengthens the interpretability of the GSM in its feature-based implementation. At the same time, caution is warranted before claiming full equivalence between the two implementations. The feature-based approach is inherently more sensitive to limitations in entropy estimation, feature dimensionality, and estimator choice. Consequently, future works should further investigate the robustness and generalizability of the feature-based GSM across methodological and experimental dimensions. In particular, systematic comparisons between different entropy estimators, including bias-corrected and multivariate formulations, may help clarify the sensitivity of the feature-level implementation to estimator choice and data dimensionality. Additionally, extending the validation to independent datasets collected under different task demands, group sizes, and operational contexts will be essential to assess the stability of the observed cooperative signatures.
CONCLUSION
Taken together, these findings suggest that the GSM captures a stable and physiologically meaningful signature of teamwork. The feature-based implementation tested in the present study exhibits patterns that are coherent with those obtained using the signal-level formulation, which is known to provide higher statistical robustness. This consistency indicates that, despite the reduction in information inherent to feature extraction, the core cooperative dynamics captured by the GSM are preserved. Nevertheless, the feature-based GSM offers a substantial advantage in terms of psychological interpretability, as it enables group synergy to be explicitly linked to well-established cognitive and motivational constructs. From this perspective, the parallel use of signal-level and feature-level implementations, although partially redundant in terms of results and information, represents a methodological strength: by combining statistical robustness with interpretability, this dual-level approach provides a more comprehensive and explainable characterization of cooperative behaviour in triadic teams.
ACKNOWLEDGMENT
This work was co-funded by the grants “TCI” (Bando Ateneo Grande 2024) provided by Sapienza University of Rome to Pietro Aricò (SAP_ RICERCA_2024_TCI_ARICÒ_P_01), “2bSafe - 2bSafe - Neurophysiological characterization and modelling of “readiness to safely work”, for an enhanced workers’ training in virtual reality”, for an enhanced workers’ training in virtual reality”, provided by Sapienza University of Rome to Vincenzo Ronca
The Group Synergy Metric: Quantifying Teamwork in Triads 165 (AR2241907596EF17), and “ATCoop - Air Traffic Controllers cooperation during learning session in a simulated environment” (AR125199A9676143) are also acknowledged.
REFERENCES
A. F. de C. Hamilton, ‘Hyperscanning: Beyond the Hype’, Neuron, vol. 109, no.
3, pp. 404–407, Feb. 2021, doi: 10.1016/j.neuron.2020.11.008. C. J. Gwaltney, A. L. Shields, and S. Shiffman, ‘Equivalence of electronic and paper-and-pencil administration of patient-reported outcome measures: a meta- analytic review’, Value Health J. Int. Soc. Pharmacoeconomics Outcomes Res., vol. 11, no. 2, pp. 322–333, 2008, doi: 10.1111/j.1524-4733.2007.00231.x. C. Richard et al., ‘Elevated Inter-Brain Coherence Between Subjects With
Concordant Stances During Discussion of Social Issues’, Front. Hum. Neurosci., vol. 15, May 2021, doi: 10.3389/fnhum.2021.611886. ‘Contrast analysis for competing hypotheses: A tutorial using the R package cofad | Behavior Research Methods | Springer Nature Link’. Accessed: Feb. 04, 2026. [Online]. Available: https://link.springer.com/article/10.3758/s13428-025- 02833-w D. Bevilacqua et al., ‘Brain-to-Brain Synchrony and Learning Outcomes Vary
by Student–Teacher Dynamics: Evidence from a Real-world Classroom Electroencephalography Study’, J. Cogn. Neurosci., vol. 31, no. 3, pp. 401–411, Mar. 2019, doi: 10.1162/jocn_a_01274. D. Liu et al., ‘Interactive Brain Activity: Review and Progress on EEG-Based Hyperscanning in Social Interactions’, Front. Psychol., vol. 9, Oct. 2018, doi: 10.3389/fpsyg.2018.01862. F. Faul, E. Erdfelder, A.-G. Lang, and A. Buchner, ‘G*Power 3: A flexible statistical
power analysis program for the social, behavioral, and biomedical sciences’, Behav. Res. Methods, vol. 39, no. 2, pp. 175–191, May 2007, doi: 10.3758/BF03193146. G. Borghini et al., ‘Analysis of Neurophysiological Signals for the Training and Mental Workload Assessment of ATCos’, 2014. G. Borghini et al., ‘Cooperation and mental states neurophysiological assessment
for pilots’ training and expertise evaluation’, in 2023 IEEE International Workshop on Technologies for Defense and Security (TechDefense), Nov. 2023, pp. 77–82. doi: 10.1109/TechDefense59795.2023.10380910. G. Di Flumeri et al., ‘EEG-based Approach-Withdrawal index for the pleasantness evaluation during taste experience in realistic settings’, in 2017 39th Annual International Conference of the IEEE Engineering in Medicine and Biology Society (EMBC), Jul. 2017, pp. 3228–3231. doi: 10.1109/EMBC.2017.8037544. G. Vecchiato et al., ‘How to measure cerebral correlates of emotions in marketing
relevant tasks’, Cogn. Comput., vol. 6, no. 4, pp. 856–871, 2014, doi: 10.1007/ s12559-014-9304-x. ‘Is there a “Big Five” in Teamwork? - Eduardo Salas, Dana E. Sims, C. Shawn Burke, 2005’. Accessed: Feb. 04, 2026. [Online]. Available: https://journals.sagepub. com/doi/10.1177/1046496405277134?utm_source=researchgate.net&utm_ medium=article J. Toppi et al., ‘Investigating Cooperative Behavior in Ecological Settings: An EEG
Hyperscanning Study’, PloS One, vol. 11, no. 4, p. e0154236, 2016, doi: 10.1371/ journal.pone.0154236. N. Sciaraffa et al., ‘Evaluation of a New Lightweight EEG Technology for Translational Applications of Passive Brain-Computer Interfaces’, Front. Hum. Neurosci., vol. 16, Jul. 2022, doi: 10.3389/fnhum.2022.901387.
N. Sciaraffa et al., ‘Multivariate model for cooperation: bridging social physiological compliance and hyperscanning’, Soc. Cogn. Affect. Neurosci., vol. 16, no. 1–2, pp. 193–209, Jan. 2021, doi: 10.1093/scan/nsaa119. Principal Component Analysis. in Springer Series in Statistics. New York: Springer-
[Online]. Available: https://link.springer.com/book/10.1007/b98835 R. Capotorto et al., ‘Cooperation objective evaluation in aviation: validation and comparison of two novel approaches in simulated environment’, Front. Neuroinformatics, vol. 18, Sep. 2024, doi: 10.3389/fninf.2024.1409322. R. Parasuraman and G. F. Wilson, ‘Putting the brain to work: neuroergonomics past,
present, and future’, Hum. Factors, vol. 50, no. 3, pp. 468–474, Jun. 2008, doi: 10.1518/001872008X288349. ‘Statistical Power Analysis for the Behavioral Sciences | Jacob Cohen |’. Accessed: Feb. 04, 2026. [Online]. Available: https://www.taylorfrancis.com/books/ mono/10.4324/9780203771587/statistical-power-analysis-behavioral-sciences- jacob-cohen S. Watanabe, ‘Information Theoretical Analysis of Multivariate Correlation’, IBM J.
Res. Dev., vol. 4, no. 1, pp. 66–82, Jan. 1960, doi: 10.1147/rd.41.0066. T. M. Cover, Elements of information theory. John Wiley & Sons, 1999. V. Ronca et al., ‘A Novel Multi-Stage Algorithm for Real-Time Detection and Correction of Ocular Artifacts in EEG: A Calibration-Free Approach’, in 2025 47th Annual International Conference of the IEEE Engineering in Medicine and Biology Society (EMBC), Jul. 2025, pp. 1–7. doi: 10.1109/EMBC58623.2025.11254864. V. Ronca et al., ‘Mutual information-based teamwork evaluation in real-world
environments: an exploratory investigation with professional surgeons’, Front. Netw. Physiol., vol. 5, Sep. 2025, doi: 10.3389/fnetp.2025.1608824. V. Ronca et al., ‘o-CLEAN: a novel multi-stage algorithm for the ocular artifacts’ correction from EEG data in out-of-the-lab applications’, J. Neural Eng., vol. 21, no. 5, p. 056023, Sep. 2024, doi: 10.1088/1741-2552/ad7b78. W. Klimesch, ‘EEG alpha and theta oscillations reflect cognitive and memory
performance: a review and analysis’, Brain Res. Rev., vol. 29, no. 2, pp. 169–195, Apr. 1999, doi: 10.1016/S0165-0173(98)00056-3. W. Skrandies, ‘Global field power and topographic similarity’, Brain Topogr., vol.
3, no. 1, pp. 137–141, Sep. 1990, doi: 10.1007/BF01128870. Z. Dienes and J. Perner, ‘Assumptions of a Subjective Measure of Consciousness: Three Mappings’, in Higher-Order Theories of Consciousness: An Anthology, R. J. Gennaro, Ed., John Benjamins, 2004, pp. 56–173.
Read this individual research paper free through the original publisher, or explore the full digital proceedings book.
ISBN 979-8-950676-09-3
Explore this ISBN in the AHFE Bookstore ↗Listed in the July 2026 bookstore catalogue; search by ISBN to confirm current availability · Digital book purchase optional