Shunki Suzuki, Hisaya Tanaka (2025). Five-level Drowsiness Estimation Using BlendShape Features Captured by a Smartphone’s Front-facing Camera. In: Human Factors in Design, Engineering, and Computing. AHFE Open Access, vol. 199, pp. 650–660. https://doi.org/10.54941/ahfe1006877
This study proposes a real-time, non-contact drowsiness estimation method using a smartphone’s front-facing camera and Apple’s ARKit. While previous studies have primarily relied on eye-blink or facial cues limited to the eye and mouth, our approach captures a wider range of facial expressions, head sway, and eye movement using 52 BlendShape parameters, including features such as eyebrows, cheeks, and nose, along with 3D orientation data. Participants performed a driving task designed to induce drowsiness in a simulator environment, and external raters evaluated their drowsiness on a five-point scale. These ratings were then used as labels to train a K-nearest neighbor (KNN) classifier on features derived from mean values and temporal variances of facial indicators, sampled every five seconds. To enhance model interpretability, SHapley Additive exPlanations (SHAP) were employed to quantify the contribution of each indicator to the classification results. Results show that the amount of movement and standard deviation of indicators—rather than absolute position—were strongly associated with higher classification accuracy. Mouth-related indicators, such as yawning and lip movement, showed particularly high contributions to drowsiness prediction. Using data labeled by external raters on a five-point scale, we performed binary and ternary classification by downsampling from the original five-class dataset. As a result, the proposed method achieved classification accuracy of 98.6%, 89.6%, and 70.5% for binary, ternary, and five-class settings, respectively, with F1 scores of up to 99.3%. These findings suggest that smartphones equipped with ARKit can serve as reliable and accessible tools for detecting drowsiness using facial expression dynamics. Importantly, temporal variation in facial movements—especially head sway and eye closure patterns—proved to be more robust than static features in distinguishing levels of alertness. Future work will optimize feature selection to reduce computational load and improve classification performance, particularly for fine-grained tasks such as five-level drowsiness estimation.
Drowsiness has been associated with an increased risk of traffic accidents (National Police Agency Traffic Bureau, 2022), workplace errors (Ferguson et al., 2019), and decreased academic performance (Chu et al., 2020), highlighting the need for objective and automated evaluation methods. Existing studies have primarily relied on indicators around the eyes and mouth, such as blinking and eye movements (Adachi et al., 2006; Ueno et al., 1994; Yuda, 2021), while limited research has explored alternative facial expression features. Given the fluctuating nature of alertness, it is advantageous to develop systems capable of multi-level classification. This study proposes a five-level drowsiness estimation method using Apple’s ARKit, which captures 52 BlendShape parameters and 3D head orientation via a smartphone’s front-facing camera. Drowsiness estimation approaches are generally divided into physiological and behavioral indicators, with recent focus shifting to non-contact, quantitative facial expression analysis. Kitajima et al. (1997) introduced a five-level rating system based on facial cues (see Table 1), which has been validated in subsequent studies (Sunagawa, 2020). Blink duration and ocular metrics have shown promise for drowsiness estimation (Koshi et al., 2022; Phan, Trieu, & Phan, 2023), and libraries
Score Rating Indicator Examples 1 Not at all drowsy Rapid and frequent eye movements, stable blinking cycle, active body movements
2 Slightly drowsy Slower eye movements, lips are slightly open
3 Drowsy Frequent and slow blinking, mouth movements, touching the face Deliberate blinking, head shaking, unnecessary whole-body movements such as shoulder movements,
4 Quite drowsy frequent yawning, deep breathing, slow blinking and eye movements
5 Extremely drowsy Eyes closed, head tilting forward, head falling backward
MediaPipe tracks 478 facial landmarks, achieving 96% accuracy in binary drowsiness classification based on eye status (Koshi & Tanaka, 2022, 2024). Head sway has also been identified as a reliable behavioral indicator (Koshi, 2024), and facial motion quantification may enhance detection accuracy. Doshi and Trivedi (2012) reported a significant time lag between eye and head movement during intentional and unconscious gaze shifts, a potentially useful cue for drowsiness detection. Similarly, Sugawara et al. (2019) demonstrated a relationship between head sway, eye movement, and driver fatigue, while Horiuchi (2024) highlighted associations with cognitive engagement during learning.
While prior work employed MediaPipe, this study focuses on ARKit due to its accessibility and integration with mobile devices. ARKit provides facial angle and BlendShape data, and prior work by Suzuki and Tanaka (2024) confirmed its accuracy in capturing head sway and eye movements during driving tasks. Building on this, the present study examines whether ARKit- derived indicators can support multi-level drowsiness classification, evaluates inter-feature relationships, and assesses estimation accuracy under varying conditions.
FACIAL EXPRESSION METHOD To measure facial expression indicators effectively, this study used ARKit, a facial tracking library by Apple, which quantifies 52 facial features without converting point clouds into expression indicators. Unlike Google’s Mediapipe, which tracks over 400 facial points and requires normalization due to individual variability, ARKit provides standardized
652 Suzuki and Tanaka
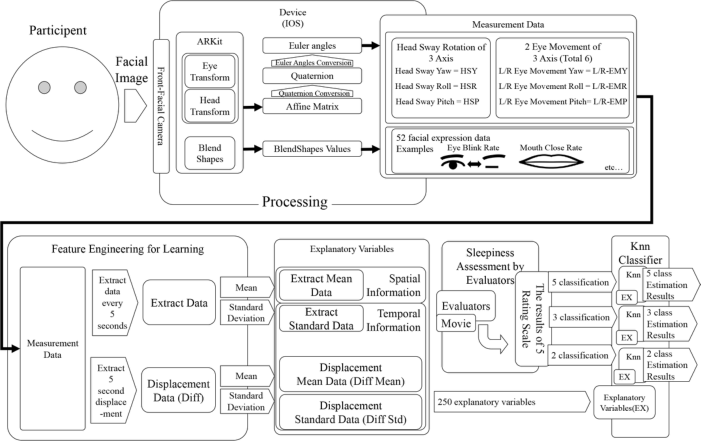
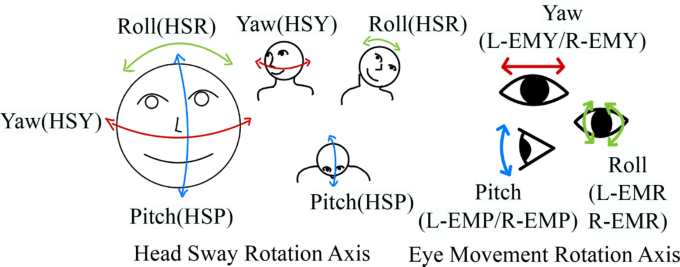
outputs compatible with iOS devices, making it suitable for mobile use. A custom application was developed using ARKit to capture facial data from a smartphone’s front camera, converting it into numerical values including BlendShapes and facial angles. These angles were transformed from affine matrices into quaternions and then Euler angles for analysis. Head sway was measured via yaw (HSY), pitch (HSP), and roll (HSR), while eye movements were described by yaw, pitch, and roll for each eye (e.g., L-EMY, R-EMP). Data were segmented into 5-second intervals, and per-frame differences were computed to extract movement dynamics. The mean and standard deviation (SD) of these values were used as explanatory variables in a K-nearest neighbour (KNN) model. The subjective drowsiness ratings on a five-point scale were transformed into binary, ternary, and five-class labels for classification, enabling a comprehensive evaluation of drowsiness detection using real-time facial expression dynamics.
Figure 1: Processing method of indicators during drowsiness evaluation.
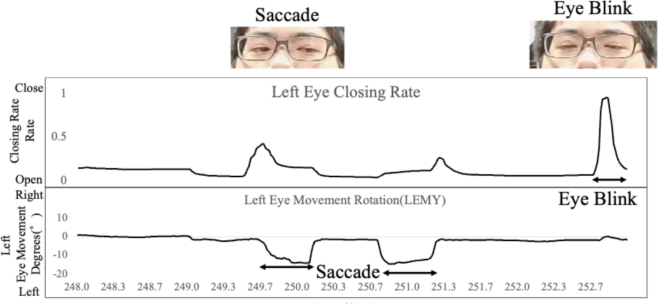
System Overview This system was developed using ARKit integrated with Swift for iOS, capturing facial data at up to 60 Hz. ARKit processes camera input, converts outputs, and exports them to CSV files. Due to variable processing loads, linear interpolation was applied to align measurement timing. Facial angle data, originally in affine matrices, were converted to quaternions and then to Euler angles (pitch, yaw, roll) for analysis. Head sway and eye movements were analyzed using these angles, with yaw and pitch representing horizontal and vertical eye movement, respectively. Eye roll rotation was also included. Experimental data showed increased eye-closing rates and distinct leftward movements (saccades) in the left eye.
Five-Level Drowsiness Estimation Using BlendShape Features Captured 653
Figure 2: Rotation axes of head sways and eye movements.Figure 3: Facial expression measurements (eye closing and rotation).
Facial Expression Data This study utilizes Apple’s ARKit Face Tracking technology to collect standardized and detailed facial data through 52 BlendShape parameters. These indicators represent various facial movements and provide spatial information about the subject’s expression. To capture temporal dynamics, the mean values over 5-second intervals are calculated for each indicator, along with frame-to-frame differences to estimate movement speed. The standard deviation within each 5-second window is also computed to quantify variability. This processing approach follows the method described by Kitajima et al., enabling dynamic analysis of facial behavior. In addition to facial expressions, eye and head movements are included as important indicators. Previous research has demonstrated ARKit’s reliability in capturing these features: Fukushima and Kawai (2022) reported high eye- tracking accuracy with an error of approximately 100 pixels, while Suzuki and Tanaka (2024) confirmed the effectiveness of ARKit in assessing head sway. Together, these spatial and temporal features provide a comprehensive representation of facial activity, enhancing the accuracy of drowsiness
654 Suzuki and Tanaka
estimation. The use of ARKit enables real-time, non-contact monitoring using widely available consumer devices, making it a practical solution for applications such as driver monitoring and behavioral assessment.
EXPERIMENTAL AND ANALYTICAL METHODS This study investigates the feasibility of estimating drowsiness while driving using ARKit. A drowsiness-inducing experiment was conducted in a driving simulator. Subsequently, one rater was tasked with rating the driver’s drowsiness on a five-point scale proposed by Kitajima et al. (1997), based on the facial video data collected during the experiment. A K-nearest neighbour model was then constructed for each rater, based on the rating data and the facial expression data measured, using an index that included eye movement data. Local SHAP (SHapley Additive exPlanations) was then employed to calculate the contribution rate based on the answers to each evaluation dataset and the estimation results, which were then compared to verify accuracy.
Experimental Environment The experiment utilized three monitors to display the front view and side mirrors of a vehicle, with the spatial arrangement adjusted based on the Suzuki Wagon R (DBA-MH34S) to replicate real vehicle conditions. Brightness levels were set above 800 lux to ensure clear facial imaging, and reflections were minimized to improve camera capture. A rear-facing video camera recorded full-body movements, while a separate webcam collected facial evaluation data. Facial information was recorded using a custom application at 60 Hz and saved in CSV format, including blend shape and angle data. The experiment used Euro Truck Simulator 2 as the driving simulator, with subjects navigating a virtual map of Japan on a 30-minute route from Osaka to Ehime under traffic-free conditions. An alternative driving task on a simple circuit was provided for non-drivers. A self-report questionnaire confirmed that both tasks effectively induced drowsiness.
Experimental Method and Subjects The study involved six participants (five males, one female) in their twenties. Licensed drivers navigated both regular roads and expressways, while the unlicensed participant drove on a simple circuit. All subjects completed a practice session and were instructed to follow Japanese traffic laws, maintaining 80 km/h on simple roads and the legal limit elsewhere. Before each drowsiness-inducing trial, participants rated their sleepiness using a 10-cm visual analog scale (VAS). Following established protocols, they performed a 30-minute driving task with two breaks to induce drowsiness. The experiment was recorded using a custom app and video camera, and conducted under Kogakuin University’s ethical guidelines (Approval No.: 2021-A-29).
Five-Level Drowsiness Estimation Using BlendShape Features Captured 655
Grading Method The raters utilized a pre-established rating system to evaluate the videos presented at five-second intervals. This system employed a five-point scale, as proposed by Kitajima et al. (1997). Additionally, to mitigate potential bias in the data points and classifications utilized for estimating drowsiness, the granularity of the five-point scale was reduced. The three-value classifications were subdivided into (1, 2), (3), and (4, 5). In the binary classification, the dataset was divided into two subsets, (1, 2, 3) and (4, 5), and down-sampling was performed. Furthermore, the raters were requested to rate 40 questions in advance as a form of practice, and the estimation model was constructed using the rating data provided by those who offered valid responses. The data were rated by six individuals for 30–60 minutes, resulting in a total data of 4 hours and 55 minutes and 30 seconds. The data were then divided into five-second segments, with a total of 3,546 rating data points used for verification. The raters were selected from individuals who were not involved in writing the main text. Furthermore, consent was obtained from one male individual to publish his photograph in the paper.
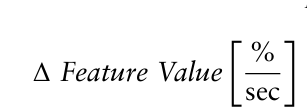
Analysis Method The analysis was performed using Python’s scikit-learn and MATLAB to estimate drowsiness through the K-nearest neighbor (KNN) method. Facial expression-derived indicators were used as explanatory variables, while rater evaluations served as the target variable. Data were split using a 90/10 holdout method for training and testing, and five-fold cross-validation was applied to prevent overfitting. The KNN model used 10 neighbors with Euclidean distance and no weighting, and all datasets were standardized. To calculate indicator values, rotational angles along the XYZ axes for the head and both eyes were included. Since these values exceeded the range of other indicators, they were normalized by dividing by 15 degrees, the upper limit of facial and eye angles. Additionally, angular velocity was calculated using the difference between frames, divided by the time difference (1t), and added as an indicator. The angular velocity per second was computed over five- second intervals, with no spatial information—only frame-to-frame changes. Each indicator was thus represented by its mean (spatial), standard deviation (temporal), and angular velocity. In total, 250 indicators were analyzed. Model performance was evaluated using accuracy, recall, precision, and F1 score, based on the 10% test set. True positive, true negative, false positive, and false negative rates were computed, and local SHAP was applied to identify the contribution of each indicator to model predictions.
deg i
1 Angle Speed h
Equation reproduced from the original PDF.Equation reproduced from the original PDF.
=
Frame Count × 1t (2)
656 Suzuki and Tanaka
RESULTS AND DISCUSSION
Grading Results
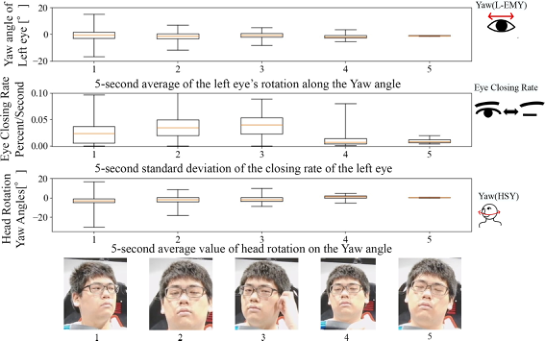
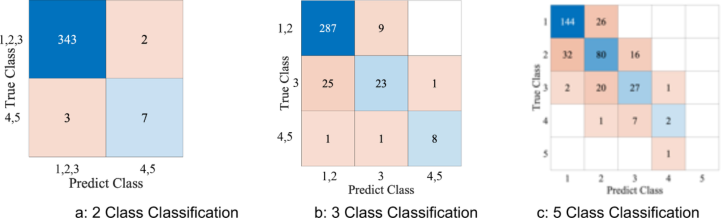
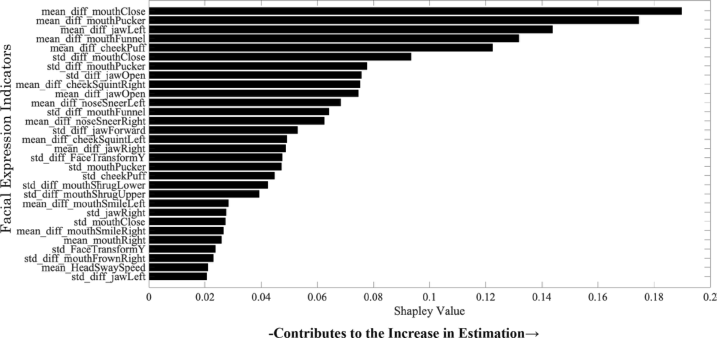
Figure 4 presents sample data used for machine learning, including eye movement, head sway, and eye opening/closing values. Figure 5 shows confusion matrices for binary, ternary, and five-class classifications, with actual values on the vertical axis and predicted values on the horizontal axis. Classification was verified using test data, with the highest arousal level used as the reference. Table 2 summarizes the accuracy results: F1-scores were 99.28% (binary), 93.94% (ternary), and 73.10% (five-class). Finally, local SHAP analysis (Figure 7) was used to interpret feature contributions. For binary classification, the top 30 indicators were ranked by Shapley value. High positive values indicated increased drowsiness with higher indicator values, while negative values indicated drowsiness with decreasing values. Mouth-related indicators, especially around the corners, contributed most significantly.
Figure 4: Box plots of each indicator (L-EMY, eye closing rate, HSY) by drowsiness class.
Discussion
Figure 4, which depicts the actual measured values, reveals a decline in eye movements, which is indicative of drowsiness. This demonstrates the feasibility of employing a smartphone-based measurement approach to assess and quantify drowsiness levels. The methodology involves analyzing a five-second recording with a high-precision five-level evaluation system.
Five-Level Drowsiness Estimation Using BlendShape Features Captured 657
Furthermore, the dispersion of the eyes diminishes as the subject’s drowsiness level increases, as indicated by the reduction in eye movements. Nevertheless, no notable discrepancy was observed in the mean values. This indicates that employing variance in lieu of average values is an efficacious method for estimating drowsiness. A comparable pattern was observed in the lateral head sway. Assessing the standard deviation in the lateral direction was determined to be a crucial aspect. Moreover, the box plot in the center of the graph, which compares the standard deviation of the rate of eye closure, reveals that the average value of the standard deviation decreases as drowsiness increases. This suggests that a smaller variance in the eye closure rate is indicative of a higher likelihood of being perceived as drowsy. As a common indicator among all these metrics, the standard deviation value—showing how much the values were dispersed over time creates a difference compared to the assessment value, rather than the average value, which retains the specific eye closure rate and angle as spatial information. This suggests the potential for individual differences in eye closure rate and angle. Utilizing a dispersion exhibiting reduced individual variation was found to be crucial for drowsiness estimation.
Figure 5: Classification results for drowsiness estimation by each class count.
The subsequent step involved investigating the mixture matrix for each rating value, as illustrated in Figure 5. All the aforementioned tests were conducted using data not used during the machine-learning process. Examination revealed that the classification rate was notably high for binary and three-class classifications, although the classification was not conducted correctly due to a dearth of data deemed to be a rating of 5 in the 5-point classification system. Nevertheless, given that the ratings were classified at values relatively close to the correct values, accurate classification appears feasible with an adequate quantity of data. As no notable discrepancies were observed in the five-point rating classification, future improvements in accuracy may result from an increased rating number.
The next step is to assess the accuracy of the binary, ternary, and five-value classifications presented in Table 2. Respective experiments were conducted using test data not employed during the machine-learning process. The F1 score for binary classification was notably high, at 99.28%. Furthermore, the three-value and five-value classifications demonstrated considerable accuracy, with respective scores of 93.94% and 73.10%. However, the recall
658 Suzuki and Tanaka
value, which indicates the accuracy of the negative value assessment, was found to be low for the five-value classification at 66%. This suggests that the accuracy of the ratings assigned to the “drowsy” category is relatively low. This may have resulted from the limited number of data points that were identified as exhibiting sleepiest behavior. An examination of the 5-value classification mixed matrix in Graph C of Figure 5 shows that the data is estimated to be near the correct values. An increase in the quantity of data in the future will likely facilitate more accurate drowsiness estimations.
Figure 6: Contribution rate to evaluation by shapley value.
Figure 6 illustrates the contribution rates for the drowsy (4, 5) judgments when local SHAP is performed based on binary classification. The data indicate that as the positive value increases, the contribution rate also rises, suggesting that higher indicator values are likelier to be assessed at those rating levels. Upon examination, a considerable number of the ratings reflected most indicator values pertaining to the mouth and cheeks. This phenomenon is largely related to actions such as yawning, which involves opening the mouth to a considerable width. Feedback from the raters revealed that their ratings were predominantly influenced by observations of the mouth and the lower portion of the face. This suggests that the contribution rates derived from local SHAP align with the regions of the face that the raters prioritized. The method successfully identified the specific areas of the face that the raters focused on when assessing drowsiness. Further investigation using additional indicators, unbeknownst to the raters, demonstrated that the differential value, indicating the movement amount of the indicator exhibited an increase for a considerable number of indicators. This suggests that the degree of movement observed in most indicator values is an effective measure of the drowsiness rating. Furthermore, values indicative of vertical head sway were observed in indicators with high contribution rates. These values are thought to include signs of drowsiness, such as the movements associated with waking up in the middle of sleep due to being startled and the periodic lowering of the neck accompanied by intermittent back-and-forth swaying, which were previously identified as the drowsiest indicators. Hence, head
Five-Level Drowsiness Estimation Using BlendShape Features Captured 659
sway and mouth movements contributed significantly to the estimation of sleepiness. Furthermore, efficient classification may be achieved by adding the amount of movement and variance to the assessment rather than spatial information, which varies greatly from person to person.
CONCLUSION
This study demonstrated that facial expression features, particularly variance and movement-based indicators extracted via ARKit, enable accurate multi- level drowsiness classification using a smartphone. Notably, the three-class model achieved 93.94% F1-score. These results support the potential of compact, non-contact systems for real-time drowsiness assessment. Future work should focus on optimizing feature selection and exploring additional indicators such as hand movements.
Ethics Statement This study was conducted following the ethical review guidelines for Kogakuin University personnel, “Psychophysiological Measurements for the Development of New Interfaces (Approval No.: 2021-A-29).”
REFERENCES
Adachi, K., Yamamoto, N., Yamamoto, O., Nakano, T., & Yamamoto, S.
(2006). Monitoring car drivers’ condition using image processing: Measurement of car drivers’ consciousness in consideration of individual differences. IEEJ Transactions on Sensors and Micromachines, 126, pp. 31–37. doi: 10.1541/ ieejsmas.126.31. Apple Inc. (n.d.). ARFaceAnchor. BlendShapeLocation – Apple Developer. Available at: https://developer.apple.com/documentation/arkit/arfaceanchor/ blendshapelocation (Accessed: 22 August 2025). Chu, T., & Kishimoto, H. (2020). Association between health-related behaviors and academic performance among university students. Journal of Health Science, 42, pp. 27–38. doi: 10.15017/2560360. Doshi, A., & Trivedi, M. M. (2012). Head and eye gaze dynamics during visual
attention shifts in complex environments. Journal of Vision, 12(2), 9. doi: 10.1167/12.2.9. Ferguson, S. A., Appleton, S. L., Reynolds, A. C., Gill, T. K., Taylor, A. W., & McEvoy, R. D. (2019). Making errors at work due to sleepiness or sleep problems is not confined to non-standard work hours: Results of the 2016 Sleep Health Foundation national survey. Chronobiology International, 36(6), pp. 758–769. doi: 10.1080/07420528.2019.1578969. Fukushima, T., & Kawai, Y. (2022). Development of gaze tracking method using
mobile devices. IPSJ Interaction 2022, 4D17. Google LLC. (2024). MediaPipe – Google for Developers. Available at: https:// ai.google.dev/edge/mediapipe/solutions/guide?hl=ja (Accessed: 22 August 2025). Horiuchi, H., & Tanaka, H. (2024). A system to evaluate proactive learning attitudes
through concentration based on biometric data. International Journal of Affective Engineering, Advance online publication. doi: 10.5057/ijae. IJAE-D-23–00032.
660 Suzuki and Tanaka
Kitajima, H., et al. (1997). Prediction of automobile driver sleepiness: 1st report, rating of sleepiness based on facial expression and examination of effective predictor indexes of sleepiness (in Japanese). Transactions of the Japan Society of Mechanical Engineers Series C, 63, pp. 3059–3066. doi: 10.1299/kikaic.63.3059. Koshi, Y., & Tanaka, H. (2022). Improving the accuracy of a drowsiness rating
system for drivers using MediaPipe. Paper presented at SIG-ACI-31, Human Interface Society, Kyoto, Japan. Koshi, Y., & Tanaka, H. (2024). Avatar’s expression of drowsiness using blink and head sway. International Journal of Affective Engineering, 22(3), pp. 271–280. doi: 10.5057/ijae. IJAE-D-22–00018. Miyake, S., et al. (2010). Detection of the struggle state. Japan Ergonomics Society
51st Conference, Proceedings of the Annual Meeting of Japan Ergonomics Society, 1E1–06. doi: 10.14874/jergo.46sp.0.324.0. National Police Agency Traffic Bureau. (2022). Status of traffic accidents in 2021. Available at: https://www.npa.go.jp/bureau/traffic/bunseki/nenkan/ 040303R03nenkan.pdf (Accessed: 22 August 2025). Phan, A.-C., Trieu, T.-N., & Phan, T.-C. (2023). Driver drowsiness detection and smart alerting using deep learning and IoT. Internet of Things, 22, 100705. doi: 10.1016/j.iot.2023.100705. Shirahama, N., Watanabe, S., Moriya, K., Koshi, K., & Matsumoto, K. (2021). A
new method of subjective evaluation using visual analog scale for small sample data analysis. Journal of Information Processing, 29, pp. 424–433. doi: 10.2197/ ipsjjip.29.424. Sugawara, T., Miyagawa, K., Taguchi, T., & Muragishi, Y. (2019). A regression analysis of driver fatigue factors regarding vestibulo-ocular reflex function. Transactions of Society of Automotive Engineers of Japan, 50, pp. 1132–1137. doi: 10.11351/jsaeronbun.50.1132. Sunagawa, M., Shikii, S.-i., Nakai, W., Mochizuki, M., Kusukame, K., &
Kitajima, H. (2020). Comprehensive drowsiness level detection model combining multimodal information. IEEE Sensors Journal, 20, pp. 3709–3717. doi: 10.1109/ JSEN.2019.2960158. Suzuki, S., & Tanaka, H. (2024). Eye-movement measurement and head tracking while driving using a smartphone. Proceedings of the International Symposium on Affective Science & Engineering (ISASE 2024), PM-1A-03. doi: 10.5057/ isase.2024-C000005. Ueno, H., Kaneda, M., & Tsukino, M. (1994). Development of drowsiness detection
system. Proceedings of VNIS’94 – 1994 Vehicle Navigation and Information Systems Conference, pp. 15–20. doi: 10.1109/VNIS.1994.396873. Yuda, E., Yoshida, Y., & Hayano, J. (2021). Smart shirt respiratory monitoring to detect car driver drowsiness. International Journal of Affective Engineering, 20, pp. 57–62. doi: 10.5057/ijae. IJAE-D-20–00015.
LISTED IN THE AHFE DIGITAL BOOKSTORE CATALOGUE
Explore the complete digital volume
Human Factors in Design, Engineering, and Computing
Read this individual research paper free through the original publisher, or explore the full digital proceedings book.
ISBN 978-1-964867-75-5
Explore this ISBN in the AHFE Bookstore ↗Listed in the July 2026 bookstore catalogue; search by ISBN to confirm current availability · Digital book purchase optional