Bom Yun, Jongil Yoon, Joonsoo Bae (2025). Machine Learning-Based Analysis of Fatal Construction Accidents Using SHAP: Insights for Safety-Assistive Vehicle Applications. In: Human Factors in Design, Engineering, and Computing. AHFE Open Access, vol. 199, pp. 2376–2383. https://doi.org/10.54941/ahfe1007050
The construction industry is among the most hazardous sectors, with frequent serious injuries and fatalities. This study investigates the key factors contributing to fatal accidents and explores how safety-assistive vehicles—currently limited to basic alarm and control functions—can be advanced into comprehensive safety management tools. Utilizing Korea's national accident database (CSI) from 2019 to 2023, we analyzed 15,807 cases, including 807 fatal incidents (5.1%). Predictive models employing CatBoost and AdaBoost yielded strong performance (AUC: CatBoost 0.912; AdaBoost 0.908). SHAP analysis identified top predictors of fatality: falls, worker negligence, hazardous objects, small-scale sites (<20 workers), and high-value projects (>$76.9M). Our results indicate that integrating predictive analytics may enable safety-assistive vehicles to go beyond alarms, facilitating real-time detection of accident risks, hazardous zones, and unsafe behaviors. This proactive capability can enhance safety management at construction sites. The study demonstrates the practical utility of machine learning for identifying high-risk conditions and guiding the development of smarter safety-assistive systems. Future research will focus on applying computer vision and detection technologies to further improve real-time accuracy.
According to the 2023 Industrial Accident Analysis Report released by the Ministry of Employment and Labor of Korea, the industrial accident rate in the construction sector—measured as the number of injuries per 1,000 workers—increased steadily from 7.28‰ in 2014 to 14.49‰ in 2023. Additionally, construction accounted for 44% of all occupational fatalities, which is approximately 2.15 times higher than that of the manufacturing industry, the sector with the second-highest rate.
Among all industrial sectors in Korea, construction accidents account for the highest number of serious industrial disasters, raising public concern and imposing a substantial socioeconomic burden (Cho, 2017). To address this
Machine Learning-Based Analysis of Fatal Construction Accidents Using SHAP 2377
issue, the Korean government enacted the Serious Accidents Punishment Act in 2022 to strengthen national-level supervision and preventive management of major incidents. In line with this initiative, the Ministry of Trade, Industry, and Energy (MOTIE) has launched a project worth approximately USD 17 million since 2022 to develop a Zero-Risk Platform for Commercial Special- Purpose Vehicles. This platform aims to enhance on-site safety by enabling Safety-Assistive Vehicles and edge-based control systems to detect hazards and monitor surrounding environments in real time at construction sites.
This study aims to identify the key factors contributing to accidents and to provide baseline data for developing safety policies applicable to Safety-Assistive Vehicles. Construction accident data were obtained from the Construction Safety Management Integrated Information (CSI) system, operated by the Ministry of Land, Infrastructure, and Transport of Korea. Based on these data, a methodological framework is proposed that integrates machine learning and explainable artificial intelligence (XAI) to determine the causal factors of fatal construction accidents.
LITERATURE REVIEW
Numerous studies have quantitatively analyzed industrial accidents and fatal incidents at construction sites. Choi (2023) utilized construction accident data from 2019 to 2023 and applied Decision Tree, Random Forest, XGBoost, and SHAP (Shapley Additive exPlanations) analyses to identify the primary causal factors of fatal accidents, including falls, collapses, and incident involving heavy equipment. Park (2025) conducted a statistical analysis of construction site accident data from 2020 to 2022, examining the overall status and issues related to construction accidents and proposing improvement measures. Xu (2021) analyzed fatal accident data from China’s construction industry (2010–2019) and developed a Grey Model (GM) prediction framework to identify key accident causes, as well as the days and seasons with the highest frequency of fatalities.
Meanwhile, beyond the construction sector, various machine-learning- based studies have been conducted in the general industrial and transportation domains to predict accidents and analyze influencing factors. Yang (2025) analyzed personal mobility (PM) traffic accident data in Korea from 2017 to 2022 using Random Forest and SHAP techniques to identify factors influencing accident severity. Yao (2023) employed satellite imagery (SBAS-InSAR) from the Lishui region in southern China to predict landslide susceptibility using the CatBoost model, providing a technical foundation for disaster prevention and management. Dong (2022) utilized N-5 highway traffic accident data from Pakistan (2015–2019) to compare NGBoost, LightGBM, AdaBoost, and CatBoost models, identifying key variables influencing fatal accident severity—such as driver age, accident type, and cause—through SHAP interpretation.
These prior studies collectively demonstrate the effectiveness of data- driven approaches in identifying the causal factors of accidents and highlight the increasing use of explainable artificial intelligence (XAI) techniques to enhance interpretability and reliability in predicting fatal accidents. Building
on this research trend, the present study integrates a boosting-based machine learning model with SHAP analysis applied to fatal construction accident data to derive essential insights for developing hazard perception algorithms and safety decision-support models for Safety-Assistive Vehicles.
ANALYTICAL METHODS Data Collection and Preprocessing
For this study, construction accident data from the CSI system were utilized, covering the period from July 2019 to December 2023. From the 51 variables available in the CSI database, eight key factors were selected to support the development of safety policies for Safety-Assistive Vehicles: Number of fatalities, Accident type, Construction type, Accident object, Work process, Accident cause, Construction cost, and Number of workers. Only cases classified as building or civil engineering were analyzed, reflecting the anticipated operating environment of the vehicle. The final dataset comprised 15,807 cases (15,000 non-fatal and 807 fatal). The dependent variable was the number of fatalities, coded as 1 for fatal and 0 for non-fatal accidents. All categorical variables were one-hot encoded for machine-learning analysis.
Table 1: Summary of the structure of the construction site accident dataset.
Table available in the original PDF paper.
Variable Type of Data Feature
Categorical (2) Building, Civil engineering
Number of fatalities Categorical (2) 1: fatal, 0: non-fatal Accident type Categorical (12) Fall, Slip, Struck by Object, Caught in/between, Collision, etc. Construction type (major category) Accident object (major category) Categorical (8) Temporary Structure, Construction material, equipment, Construction tools, etc. Work process Categorical (53) Installation, Dismantling, Transportation, Maintenance, Cleanup, etc. Accident cause Categorical (54) Worker Negligence, Unsafe Behavior, Poor Control, Violation of Work, etc. Construction cost Categorical (18) Less than USD 7.7 million, USD 7.7-15.4 million, and up to more than USD 76.9 million Number of workers Categorical (6) Fewer than 20 workers, 20 – 49 workers, and up to more than 500 workers.
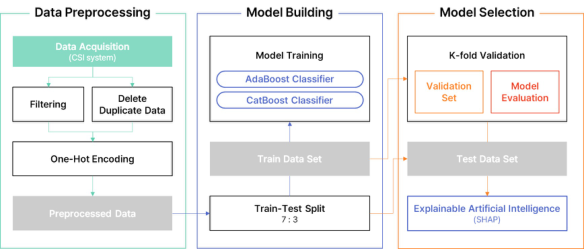
Data Analysis The analytical framework of this study is illustrated in Figure 1. After preprocessing missing and outlier values, two boosting-based ensemble algorithms—AdaBoost and CatBoost—were applied to classify fatal and non- fatal accidents. AdaBoost combines weak learners through weighted voting to enhance classification accuracy (Wang, 2019; Kim, 2009), whereas CatBoost is an ordered boosting method optimized for categorical variables and resistant to overfitting (Prokhorenkova, 2017). Model hyperparameters were tuned using k-fold cross-validation, and performance was evaluated based on
Machine Learning-Based Analysis of Fatal Construction Accidents Using SHAP 2379
Recall and ROC-AUC metrics, with an emphasis on accurately detecting fatal accidents to inform the development of Safety-Assistive Vehicle policies.
Figure 1: Framework of boosting-based ensemble learning models and SHAP analysis process.
The selected model was further analyzed using SHAP to quantify each feature’s contribution to the probability of fatality. Based on cooperative game theory, SHAP determines both the magnitude and direction of each variable’s impact on model’s output (Lundberg, 2017; Choi, 2023).
RESULTS
Hyperparameter Tuning The dataset was randomly divided into training (70%) and testing (30%) sets. Optimal hyperparameters were determined using Bayesian Optimization, which efficiently identifies parameter combinations that maximize an objective function by updating the search space based on prior evaluations (Bergstra, 2011; Xia, 2017). This approach enhances generalization by balancing bias and variance while preventing overfitting. The area under the curve(AUC) value was used as the optimization criterion, implemented through the Optuna framework in Python. The final hyperparameter settings for each model are summarized in Table 2.
Table 2: Hyperparameters tuning of boosting-based ensemble models.
Table available in the original PDF paper.
Algorithm Evaluation Metric
HyperParameters Range Optimal Values
AdaBoost Classification accuracy
N_estimators Learning_rate
(100, 5000) (0.01, 1)
437 0.167 CatBoost Classification accuracy
3776 7 0.029
N_estimators Max_depth Learning_rate
(100, 5000) (0, 10) (0.001, 1)
Selecting the Optimal Model Model performance was evaluated using Recall and ROC-AUC to assess both detection accuracy and overall classification capability for fatal accidents. Recall is calculated as shown in Equation (1):
Recall = TP TP + FN (1) represents the ratio of correctly identified fatal accidents, where TP (True Positive) and FN (False Negative) denote true positive and false negative predictions, respectively.
The ROC-AUC measures classification performance across all thresholds and is calculated as shown in Equation (2). Its values range from 0.5 to 1.0, with higher values indicating better discriminatory ability.
Equation reproduced from the original PDF.
0 TPR (FPR) dFPR (2)
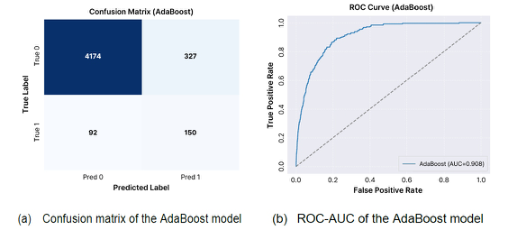
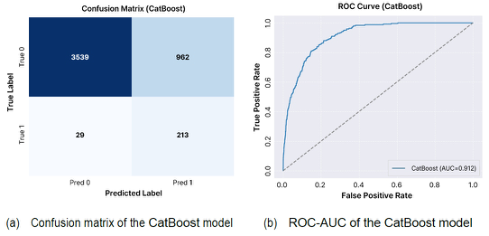
By applying the optimized hyperparameters, both the AdaBoost and CatBoost models were executed, and the results are presented in Figure 2 and Figure 3, respectively.
Figure 2: Results of the AdaBoost analysis.Figure 3: Results of the CatBoost analysis.
CatBoost achieved superior results, with a Recall of 0.880 (26% higher than AdaBoost’s 0.620) and a slightly higher ROC-AUC (0.912 vs. 0.908),
Machine Learning-Based Analysis of Fatal Construction Accidents Using SHAP 2381
confirming its stronger capability in detecting fatal accidents. Consequently, CatBoost, combining high recall with stable discrimination, was selected as the final model for safety management applications.
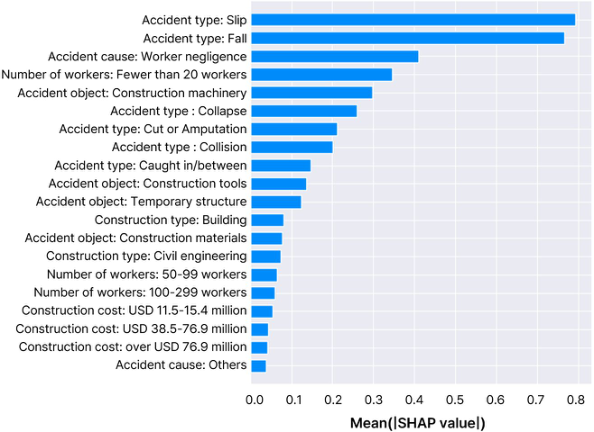
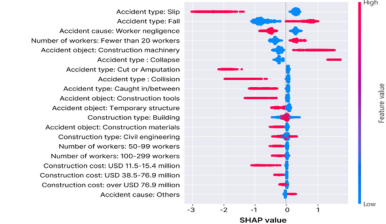
Variable Importance Analysis Using SHAP The influence of each variable in the CatBoost model, interpreted through SHAP values, is illustrated in Figure 4. The variable with the greatest impact on the occurrence of fatal accidents at construction sites was “Accident type: Slip”, followed by “Accident type: Fall,” “Accident cause: Worker negligence,” “Number of workers: Fewer than 20 workers,” and “Accident object: Construction machinery.”
Figure 5 presents the SHAP summary plot, illustrating both the magnitude and direction of each variable’s impact on the probability of a fatal accident. Red dots represent the presence of a fatal accident type (value = 1), while blue dots indicate its absence (value = 0). The results reveal that “Accident type: Fall” positively contributes to fatality risk, whereas “Accident type: Slip” has a negative effect, suggesting that slip incidents are more likely to result in non-fatal injuries.
Figure 4: SHAP bar plot illustrating the absolute mean impact of each variable.
Overall, “Fall,” “Fewer than 20 workers,” “Construction machinery,” and “Collapse” were identified as key factors that increase the likelihood of fatal accidents. Conversely, accidents occurring at sites with fewer than 300 workers or with construction costs between USD 11.5–15.4 million and above USD 38.5 million were more often non-fatal. These findings underscore the need for scale-specific safety strategies for Safety-Assistive Vehicles.
Figure 5: SHAP summary plot illustrating the distribution and directional influence of each variable.
CONCLUSION
This study quantitatively analyzed the causal factors of fatal construction accidents to provide foundational insights for tdesigning safety policies involving Safety-Assistive Vehicles, which are capable of real-time hazard detection and prevention. Using accident data from the CSI system, AdaBoost and CatBoost models were developed, and evaluation metrics such as Recall and ROC-AUC confirmed that CatBoost demonstrated superior performance.
SHAP analysis identified key contributors to fatal accidents, including sites with fewer than 20 workers, falls, collapses, and construction machinery. In contrast, slips and worker negligence were associated with lower severity but higher frequency. Accident patterns varied according to project scale: sites with fewer than 300 workers or construction costs between USD 11.5–15.4 million and above USD 38.5 million were more susceptible to non-fatal injuries. Based on these findings, site-specific safety strategies for Safety-Assistive Vehicles are proposed: (1) Small-scale sites (fewer than 20 workers): integrate fall and collapse detection into real-time risk scoring and alert systems. (2) Medium-to-large sites (fewer than 300 workers or mid- to high-cost projects): implement congestion monitoring and route optimization to prevent frequent but less severe injuries. (3) Risk visualization: utilize vehicle-collected data to generate zone-level hazard maps for workers and managers.
Overall, the identified risk factors provide a foundation for differentiated, scale-adaptive safety policies. Future research will integrate SHAP-based eXplainable AI (XAI) with Edge-AI control systems to enable autonomous warning and avoidance functions for Safety-Assistive Vehicles in real construction environments.
ACKNOWLEDGMENT
This work was supported by Automotive Industry Technology Development Project-Smart Car (20018872, Development and demonstration of automatic driving collaboration platform to overcome the dangerous environment of
Machine Learning-Based Analysis of Fatal Construction Accidents Using SHAP 2383
databased commercial special vehicles) funded By the Ministry of Trade, Industry & Energy (MOTIE, Korea).
This work was supported by “Contract-Based Graduate Enrollment Quotas Program” of Korea Industrial Technology Association(KOITA) funded by Ministry of Science and ICT(MSIT).
REFERENCES
Bergstra, J., Bardenet, R., Bengio, Y. & Kégl, B. (2011). Algorithms for hyperparameter optimization. In Proceedings of the 25th International Conference on Neural Information Processing Systems. Curran Associates Inc., Red Hook, NY, USA. Cho, Y. R., Kim, Y. C. & Shin, Y. S. (2017). Prediction model of construction safety
accidents using decision tree technique. Journal of the Korea Institute of Building Construction, Volume 17, No. 3. Choi, J. Y., Kim, S. H., Lee, S. E., Kim, K. H. & Lee, S. D. (2023). A data-driven causal analysis on fatal accidents in construction industry. Journal of Korea Safety Management & Science, Volume 25, No. 3. Dong, S., Khattak, A., Ullah, I., Zhou, J. & Hussain, A. (2022). Predicting
and analyzing road traffic injury severity using boosting-based ensemble learning models with SHAPley additive exPlanations. International Journal of Environmental Research and Public Health, Volume 19, No. 5. Kim, J. H., Kim, J. Y., Zhu, T. & Kang, D. J. (2009). A method to improve the performance of Adaboost algorithm by using mixed weak classifier. Journal of Institute of Control, Robotics and Systems, Volume 15, No. 5. Lundberg, S. & Lee, S.-I. (2017). A unified approach to interpreting model
predictions. Website: https://doi.org/10.48550/arXiv.1705.07874. Park, N. K. & Chae, J. G. (2025). A study on the current status analysis and improvement measures for the reduction of construction accidents. Journal of the Korean Society of Disaster Information, Volume 21, No. 2. Prokhorenkova, L., Gusev, G., Vorobev, A., Dorogush, A. V. & Gulin, A. (2017).
CatBoost: Unbiased boosting with categorical features. Website: https://doi.org/ 10.48550/-arXiv.1706.09516. Wang, F., Jiang, D., Wen, H. & Song, H. (2019). Adaboost-based security level classi-fication of mobile intelligent terminals. The Journal of Supercomputing, Volume 75. Xia, Y., Liu, C., Li, Y. & Liu, N. (2017). A boosted decision tree approach using
Bayesian hyper-parameter optimization for credit scoring. Expert Systems with Applications, Volume 78. Xu, Q. & Xu, K. (2021). Analysis of the characteristics of fatal accidents in the construction industry in China based on statistical data. International Journal of Environmental Research and Public Health, Volume 18, No. 4. Yang, Y. C., Park, S. J., Lee, D. Y. & Jeong, G. O. (2025). Analysis of factors
influencing the severity of traffic crashes by type of traffic crashes on personal mobility using random forest model and SHAP technique. International Journal of Highway Engineering, Volume 27, No. 1. Yao, Z., Chen, M., Zhan, J., Zhuang, J., Sun, Y., Yu, Q. & Yu, Z. (2023). Refined landslide susceptibility mapping by integrating the SHAP-CatBoost model and InSAR observations: A case study of Lishui, southern China. Applied Sciences, Volume 13, No. 23.
LISTED IN THE AHFE DIGITAL BOOKSTORE CATALOGUE
Explore the complete digital volume
Human Factors in Design, Engineering, and Computing
Read this individual research paper free through the original publisher, or explore the full digital proceedings book.
ISBN 978-1-964867-75-5
Explore this ISBN in the AHFE Bookstore ↗Listed in the July 2026 bookstore catalogue; search by ISBN to confirm current availability · Digital book purchase optional