Mikaya Hamilton, Chigaemecha Oparanozie, Nicholas Edmond, Steven Jiang (2025). Using Eye-Tracking Metrics to Predict Student Preferences Between a Campus Food Pantry and Alternative Options. In: Human Factors in Design, Engineering, and Computing. AHFE Open Access, vol. 199, pp. 749–757. https://doi.org/10.54941/ahfe1006887
Food insecurity among college students causes a significant threat to academic success and overall well-being. According to the National Postsecondary Student Aid Study, more than 4 million students were food insecure during the 2019-2020 school year. While university food pantries work tirelessly to solve this issue, many students remain unaware of these resources or are hesitant to use them. It is important to understand how students perceive and engage with campus food pantries compared to popular campus dining options to improve outreach and reduce food insecurity. While surveys and focus groups can be useful, they may not fully capture the subconscious drivers of decision-making. This study leveraged both survey responses and eye-tracking data to investigate student preferences between a local college food pantry and prominent on-campus food options. Participants viewed 13 paired image scenarios, and Areas of Interest (AOIs) were defined to collect eye-tracking metrics: Time to First Fixation, Total Fixation Duration, and Fixation Count. An Extreme Gradient Boosting (XGBoost) model identified key eye-tracking metrics, using student’s reported food option choices for cross-validation. Results revealed that Fixation Duration was the strongest predictor, suggesting that prolonged visual attention correlated with preference. Additionally, students leaned toward the food pantry for convenience to receive shelf-stable snacks but opted for alternatives when seeking prepared meals. This research supports the development of more effective food assistance strategies that prioritize student needs and behaviors.
According to the United States Department of Agriculture, food insecurity is a condition where households face economic and social challenges that prevents access to healthy foods (n.d.). Food insecurity is a significant issue in the United States, as 13.5% of households were uncertain of where their next meal was coming from in 2023 (Rabbitt et al., 2024). This percentage represents approximately 47 million people, including 13.8 million children (Rabbitt et al., 2024). The rise in food insecurity is a growing concern, as the food insecurity rate in 2023 was statistically significantly higher than 2022 (12.8%) and 2021 (10.2%) (Rabbitt et al., 2024).
While food insecurity affects millions across broad demographic groups, such as race/ethnicity, age, household composition, and residential traits (Rabbitt et al., 2024; Loofbourrow and Scherr, 2023), food insecurity is not immune to affecting college students. The National Post Secondary Student Aid Study reported 3.9 million undergraduate students, and more than 2.3 million graduate students were affected by food insecurity during the 2019–2020 school year (Cameron et al., 2023). College students are at high risk of food insecurity due to unique financial, institutional, and social factors that separate their situation from general food insecure experiences (Fortin et al., 2021). The consequences to food insecurity are severe, as the lack of nutrition and access to healthy foods negatively impacts academic performance, physical, and mental wellbeing (Stebleton et al., 2020; Fortin et al., 2020).
To combat college food insecurity, universities have employed food pantries on campus. Higher educational institutions have strengthened food insecurity efforts by partnering with hunger-relief organizations to support their student body. For example, Swipe Out Hunger (formerly College and University Food Bank Alliance) provides support to over 900 on-campus food pantries (Swipe Out Huger, n.d.). Additionally, Feeding America, the nation’s largest non-profit hunger relief organization, supports 129 food banks out of their 200-food bank network that addresses college food insecurity (Feeding America, 2019). While universities may offer a food pantry on campus, many students underutilize the service because of barriers to access (El Zein, 2022; Loofbourrow and Scherr, 2023).
Research has shown perceived stigma is the main barrier for students accessing help, followed by low familiarity with the campus food pantry support, and time conflicts (Hattangadi et al., 2019, El Zein et al., 2019, Kim et al., 2022, Anderson et al., 2022). This disconnect between available support and student engagement is troubling because negative perceptions may push students away from pantry services to other means. Given there is typically a wide variety of retail dining options offered at universities (Racine et al., 2022) and low utilization of pantry services, students may perceive retail dining options more favorably. There is a need to explore factors that shape student preferences between the pantry and retail dining options. Therefore, this study investigates student preferences between a local university food pantry and other on-campus food options to identify strategies for improving pantry engagement.
Much of the literature examined student experiences, perceptions, and predictors of food insecurity (Bruening et al., 2017). While surveys and focus groups can be useful, they may not fully capture the cognitive processes driving decision-making. To better understand the core factors contributing to food source selections, this study combined eye-tracking with student responses. Eye-tracking is an experimental method for recording eye movements, which can reveal cognitive processes beyond attention, such as perception and decision making (Carter & Luke, 2020). A Gradient Boosting machine learning model was applied to analyze key features from the eye- tracking dataset and cross-validate the performance with student responses. This approach is appropriate for this exploratory study because the model
Using Eye-Tracking Metrics to Predict Student Preferences Between a Campus 751
can analyze complex interactions and provide ranked feature importance to reveal eye-tracking metrics that are important in the decision-making process.
Limited eye-tracking research has been applied within hunger relief mainly covering the evaluation of food bank data visualizations (Hilliard et al., 2025; Jiang et al., 2024; Hilliard et al., 2023). Most of the food-related eye-tracking literature has focused on nudging strategies for healthier food consumption, visual attention to foods, and consumer behavior (Ruppenthal, 2023; Chenczke et al., 2025; Margariti et al., 2023; Brand et al., 2020). Separately, machine learning has been applied to food bank operations for optimization, forecasting, and prediction tasks (Yang et al., 2025). However, the combination of eye-tracking and machine learning within the university food pantry context to understand food option preference is a new approach.
METHOD
Participants Seventeen students from North Carolina A&T State University participated in this experiment, consisting of three females and 14 male students. Eight participants were in the 18–24 age group and the 25–34 age group. One participant was in the 35–44 age group. Overall, 64.7% of participants identified as graduate students. All participants had either normal vision (20/20) or near normal vision (20/30 to 20/60) with no concerns about their eye health. All participants had some experience with eating on-campus or were aware of most food options offered on campus.
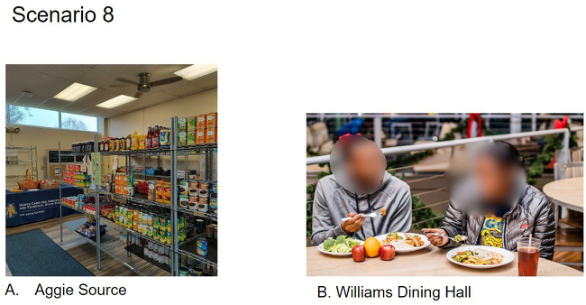
Stimuli Thirteen retail food options are offered on the local university campus, ranging from fast-food settings, cafes, convenience stores, and resident dining halls. 13 image-based scenarios were developed for the study comparing the campus food pantry image “Aggie Source” (Option A) alongside an alternative food option offered on-campus (Option B). Images of the 13 alternative food options were sourced from the university dining website (NCAT Dining, n.d.). The image for “Aggie Source” was selected from a university social media page. All images were presented at a 1920 × 1080- pixel resolution against a neutral background. Figure 1 shows the eighth scenario.
Equipment This study used a Tobii Pro Spectrum device that was connected to a Dell computer to collect eye-tracking data and present the stimuli.
Experimental Design A within-subjects design was used where all participants were exposed to the same stimuli and completed all tasks. The presentation order of the stimuli was identical for every participant.
Figure 1: Experimental stimulus for the 8th scenario comparison.
Tasks and Procedures After participants provided informed consent and completed a demographic pre-survey, they were briefed on the study’s objective and tasks. Participants were encouraged to ask questions at any time. Before the start of the experiment, participants were familiarized with the eye-tracking device. They were made aware that the infrared sensors and monitor posed minimal risk and were seated at an appropriate viewing distance from the screen. Then, an eye-tracking calibration was performed. The experimental tasks were self- paced as participants viewed 13 scenarios in order, each displaying the food pantry (Option A) and an alternative retail food option (Option B). For each scenario, participants were instructed to verbally state their preference (A or B), which was documented by the researcher. Participants advanced through the stimuli using a mouse-click or keypad arrow. Upon completion, participants were thanked for their time.
Data Collection and Analysis Eye-tracking data was collected by the Tobii Pro Spectrum and analyzed using Python and the Tobii Pro Labs software. Areas of Interest (AOIs) recorded eye-tracking metrics (i.e., Fixation Count, Total Fixation Duration, and Time to First Fixation) that were extracted for both options in each scenario. Survey data and preference responses were collected in Google Forms.
Following data collection, the eye-tracking metrics and participant responses were analyzed using Extreme Gradient Boosting (XGBoost). The dataset consisted of 221 trials (17 participants x 13 scenarios). The model’s target was the participants’ preference for the food pantry. The feature set included the eye-tracking metrics for each option within a trial. The pre-processed eye-tracking data was split into training (70%) and testing (30%) using a fixed random state (42) for reproducibility. This ratio provided the model with enough data for learning while retaining a strong performance evaluation. XGBoost was selected for its ability to handle complex, imbalanced non-linear relationships and to provide feature importance rankings. The model’s performance was then evaluated
Using Eye-Tracking Metrics to Predict Student Preferences Between a Campus 753
and identified which AOI eye-tracking metrics are most predictive of a participant’s choice.
RESULTS AND DISCUSSION
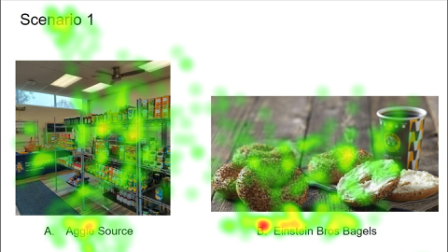
The eye-tracking device recorded participant eye-movement across the scenarios. The Tobii Pro Labs software generated heatmaps for each participant and concurrent maps for each scenario (see Figure 2). These heatmaps provide visualization of participant fixation data (Jiang et al., 2024). The XGBoost model examined the participants’ fixation data and preferences to predict the food pantry and alternative food preferences.
Figure 2: Heatmap of concurrent participant data for Scenario 1.
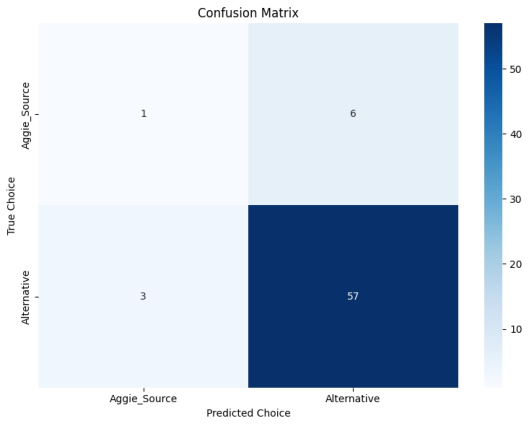
The dataset was imbalanced with only 10% of preferences toward the food pantry. The imbalance was addressed through the model’s ability to weigh 9.27 times more importance to the minority university food pantry (Aggie Source) class during training. The model achieved an overall accuracy of 86.57% as it effectively predicted the alternative options but had limited ability to detect the pantry preferences (see Table 1). Concurrently, the confusion matrix reveals the model correctly predicted 57 of 60 alternative preferences but only detected one of 1 true positive pantry choice (Figure 3). While the model was successful in predicting the alternatives, the eye-tracking metrics revealed important behavioral insights.
Table 1: XGBoost classification report.
Table available in the original PDF paper.
Class Labels Precision Recall F1-Score Support Aggie Source (A) 0.25 0.14 0.18 7 Alternative Food Options (B) 0.90 0.95 0.93 60
Figure 3: Confusion matrix for the XGBoost model.
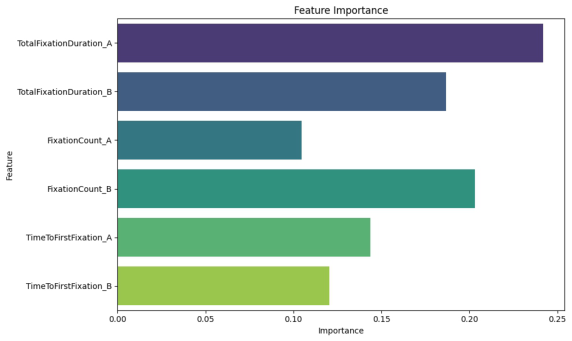
Although the prediction for the food pantry preferences was rare, the Feature Importance Analysis (Figure 4) demonstrated that the pantry Total Fixation Duration is the strongest predictor overall (0.26). This suggests that when students do choose the pantry, the amount of time spent engaging in uninterrupted attention is important. Meanwhile, Fixation Count for alternative options indicated repeated glances toward conventional food restaurants play a critical role in reinforcing the dominant choice (0.20). Additionally, the high fixation count may highlight students’ repeatedly checking and comparing alternatives as it relates to active decision-making. Notably, the Time to First Fixation for the pantry holds greater predictive importance than for alternative options since early attention allocation plays a crucial role in pantry selection. However, Figure 4 shows that frequent glances toward the pantry option is least important as Fixation Count is the weakest predictor (0.10). This underscores the importance of students engaging in sustained attention, which is needed to consider the pantry as a viable choice. In practice, the attention patterns and model performance translated to the student’s actual decision-making.
While the students preferred the alternative options more frequently than the campus food pantry, roughly 71% of participants preferred the pantry when compared to a campus convenience store. This suggests that students favor free shelf-stable goods and snacks available at the pantry rather than purchasing similar items at the convenience store. In this context, the pantry is perceived as a cost benefit for meeting basic needs. The perception of the pantry as a quick, functional option extended to other scenarios. Participants preferred the pantry against a coffee shop and a deli counter (53% in both), indicating that the pantry’s efficiency and cost-effectiveness compete with food options that are meant for basic consumption. In contrast, the pantry had the lowest levels of preferences (12%–35%) compared to popular,
Using Eye-Tracking Metrics to Predict Student Preferences Between a Campus 755
name-branded restaurants. Generally, the pantry was a less popular choice compared to prepared meals.
Figure 4: Feature importance analysis.
CONCLUSION
In conclusion, this study demonstrates that eye-tracking metrics can be utilized as predictors of user preferences when choosing between visual stimuli. The prolonged visual attention can strongly predict pantry utilization where students engage in deeper decision-making. While the pantry preference remains less common, offering goods and snacks that are for utilization may help more students actively use their campus food pantry. These findings offer a positive outlook for reducing food insecurity by aligning outreach with cognitive decision processes observed in student behavior.
ACKNOWLEDGMENT
This research is partially funded by NSF EiR: Human Centered Visual Analytics for Evidence Based Decision Making in Humanitarian Relief (Award #: CNS 2100855).
REFERENCES
Anderson, A. et al. (2022) Navigating Hidden Hunger: An Exploratory Analysis of the Lived Experience of Food Insecurity among College Students. International Journal of Environmental Research and Public Health. [Online] 19 (19), 12952. Brand, J. et al. (2020) Measuring attentional bias to food cues in young children
using a visual search task: An eye-tracking study. Appetite. [Online] 148. Bruening, M. et al. (2017) The Struggle is Real: A Systematic Review of Food Insecurity on Postsecondary Education Campuses. Journal of the Academy of Nutrition and Dietetics. [Online] 117 (11), 1767–1791.
Cameron, M., Johnson, R., Lacy, T. A., Wu, J., Siegel, P., Holley, J., Wine, J.
and Hunt-White, T., (2023). 2019–20 National Postsecondary Student Aid Study (NPSAS: 20): First Look at Student Financial Aid Estimates for 2019–20. NCES 2023–466. National Center for Education Statistics. Carter, B. T.& Luke, S. G.(2020) Best practices in eye tracking research. International Journal of Psychophysiology. [Online] 15549–62. Chenczke, O. G., Rani, A., Marek-Andrzejewska, E. and Kiryluk-Dryjska, E., (2025).
Emotional Appeals of Food Bank Posters: An Exploratory Eye-Tracking Study. El Zein, A. et al. (2019) Prevalence and correlates of food insecurity among U.S.
college students: A multi-institutional study. BMC public health. [Online] 19 (1). El Zein, A. et al. (2022) Obstacles to university food pantry use and student-suggested solutions: A qualitative study. PloS one. [Online] 17 (5), e0267341. Feeding America (2019). College Student Hunger Statistics and Research. Feeding
America Website: https://www.feedingamerica.org/research/college-hunger-resea rch. Fortin, K. et al. (2021) Hidden Hunger: Understanding the Complexity of Food Insecurity Among College Students. Journal of the American College of Nutrition. [Online] 40 (3), 242–252. Hattangadi, N. et al. (2019) “Everybody I Know is Always Hungry…But Nobody Asks Why”: University Students, Food Insecurity and Mental Health. Sustainability. [Online] 11 (6), 1571. Hilliard, K. et al. (2025) Eye-Tracker Assisted Usability Evaluation of a Hunger-
Relief Visualization Library. IISE Annual Conference. Proceedings. [Online] 1–6. Hilliard, K., Hamilton, M., Jiang, S. and Davis, L., (2023). Usability Evaluation of Food Bank Data Visualizations Using Eye-Tracking Technology. Human-Centered Design and User Experience. [Online] p. 419. Jiang, S., Ivuawuogu, H., Javadi, A., Hamilton, M., Davis, L. (2024). Development
of food bank data visualizations using eye tracking. The Human Side of Service Engineering. [Online] AHFE Open Access, vol. 143. Kim, Y. et al. (2024) ‘It’s just a constant concern in the back of my mind’: Lived experiences of college food insecurity. Journal of American College Health. [Online] 72 (3), 980–987. Loofbourrow, B. M. & Scherr, R. E. (2023) Food Insecurity in Higher Education:
A Contemporary Review of Impacts and Explorations of Solutions. International Journal of Environmental Research and Public Health. [Online] 20 (10), 5884. Margariti, K. et al. (2023) ‘Implementing Eye Tracking Technology in Experimental Design Studies in Food and Beverage Advertising - Chapter 15, [Online]. Springer US. P. NCAT Dining. (n.d.) Homepage. North Carolina A&T State University Website:
https://ncatdining.sodexomyway.com/en-us/. Rabbitt, M. P., Reed-Jones, M., Hales, L. J., & Burke, M. P. (2024). Household food security in the United States in 2023 (Report No. ERR-337). U.S. Department of Agriculture, Economic Research Service. Racine, E. F. et al. (2022) A College Fast-Food Environment and Student Food
and Beverage Choices: Developing an Integrated Database to Examine Food and Beverage Purchasing Choices among College Students. Nutrients. [Online] 14 (4), 900. Ruppenthal, T. (2023) Eye-Tracking Studies on Sustainable Food Consumption: A Sytematic Literature Review. Sustainability. [Online] 15 (23), 16434.
Using Eye-Tracking Metrics to Predict Student Preferences Between a Campus 757
Stebleton, M. J. et al. (2020) Understanding the Food Insecurity Experiences of College Students: A Qualitative Inquiry. Review of higher education. [Online] 43 (3), 727–752. Swipe Out Hunger (n.d.). Ending College Food Insecurity. Swipe Out Hunger
website: swipehunger.org/. U.S. Department of Agriculture, Economic Research Service. (n.d.). Definitions of food security. [Online]. Yang, Y. et al. (2025) Artificial Intelligence in Food Bank and Pantry Services: A
Human Factors in Design, Engineering, and Computing
Read this individual research paper free through the original publisher, or explore the full digital proceedings book.
ISBN 978-1-964867-75-5
Explore this ISBN in the AHFE Bookstore ↗Listed in the July 2026 bookstore catalogue; search by ISBN to confirm current availability · Digital book purchase optional