Florielvis Hurtado Pernaleta, Mikaya Hamilton, Michael Stubblefield, Steven Jiang (2025). Evaluating Subconscious Response to University Food Pantry Outreach Using EEG & Eye-tracking. In: Human Factors in Design, Engineering, and Computing. AHFE Open Access, vol. 199, pp. 758–765. https://doi.org/10.54941/ahfe1006888
Food insecurity, a serious condition where people have uncertain access to nutritious food, severely threatens one’s quality of life. In 2020 alone, 60 million Americans relied on food assistance, with college students disproportionately affected. Approximately 3.9 million undergraduate and 400,000 graduate students experienced food insecurity at a rate more than double of the food insecurity rate among American households in 2020. In response, nearly half of all college pantries have opened in the last five years, yet barriers to access still exist. While improvements in outreach have raised awareness, the psychological impact of language in pantry communications remains unexplored. Traditional methods for evaluating service effectiveness often rely on surveys or focus groups, neglecting unconscious emotional responses and attention that shape students' perceptions of seeking food assistance. This study bridges the gap by employing electroencephalography (EEG) and eye-tracking technologies to measure students’ neural and visual behavioral responses to language framed in neutral, empathetic, and stigmatizing tones. By identifying words that increase engagement or unintentionally reinforce stigma, this research provides evidence-based guidelines for pantries to reduce psychological barriers to pantry use, incorporate language that aligns with student expectations, and reposition outreach material and messages to attract students in need.
Food insecurity is a significant growing problem in colleges across the United States, with about 30–40% of college students being food insecure (Krupp et al., 2022). Previous surveys indicate that 45% of college food pantries were established within the last 5 years, highlighting the increasing recognition of student hunger as a pressing concern (Metti, 2022). Also in 2024, out of the 347 campuses that took the survey, 750,104 students were served from college food pantries (Swipe Out Hunger, 2024). College food pantries serve as vital resources, providing immediate access to meals and connecting students with additional support services, such as the Supplemental Nutrition Assistance Program (SNAP) or other community or campus resources
Evaluating Subconscious Response to University Food Pantry Outreach 759
(Metti, 2022; Swipe Out Hunger, 2024). The importance of food pantries is determined by their role in filling a critical social service gap for the college student demographic, addressing both immediate nutritional needs and broader food system challenges (Gardiner & Harvey, 2024).
Despite the availability of food pantries, barriers such as stigma, lack of awareness, and misconceptions about eligibility persist, limiting student engagement with these resources (Brito-Silva et al., 2022). Effective advertising and outreach are essential to overcome these barriers. Typically, strategies such as tabling events, flyers, social media campaigns, campus websites, emails, and integration with campus orientation events are used to raise awareness and normalize the use of food pantries (Swipe Out Hunger, 2024). However, the effectiveness of specific messaging strategies (e.g., tone, emotional appeal, and content features) remains unexplored. Hence, understanding which message features drive engagement and acceptance is crucial for maximizing the impact of outreach efforts.
Traditional methods for evaluating outreach effectiveness, like focus groups or surveys, do not fully capture the subconscious and emotional responses that affect behavior. Facial expression recognition is not reliable since people may show different expressions from what they feel (Andrews & Setchi, 2023). Advances in consumer neuroscience offer powerful tools to address this gap. Electroencephalography (EEG) and eye tracking are widely used to measure neural and visual responses of consumers with respect to marketing stimuli (Alvino et al., 2020). EEG provides data on brain activity related to attention, engagement and emotional processing, while eye tracking reveals patterns of visual attention, fixation, pupil dilation, and interest in specific message elements. There are 4 sets of wave bands related to EEG; Delta (0.5–3 Hz), Theta (3–8 Hz), Alpha (8–12 Hz), and Beta (12–27 Hz) (Ismail et al., 2016). These tools have been successfully applied to assets advertising effectiveness, identifying important message features, and understanding audience segmentation by age, gender, or other characteristics (Alvino et al., 2020).
For example, EEG can detect changes in neural oscillations that correspond to higher or lower attention from different parts of the brain and engagement with advertisements, while eye tracking records the movement of the eyes (Alvino et al., 2020). The software then creates visuals such as heat maps and gaze plots for researchers to understand certain messages. Combining these two tools will link cognitive, emotional, and behavioral responses, resulting in a comprehensive understanding of how different message features influence engagement and acceptance. In this pilot study, a comparative study assessment was explored using three different groups of keywords based on tones by means of both eye tracking and EEG.
METHOD
Participants Five graduate-level students from North Carolina A&T State University participated in this study, consisting of one male and four female students. Three participants were in the 18–24 age group and two were in the 25–34
age group. All participants had either normal vision (20/20) or near normal vision (20/30 to 20/60) with no concerns about their eye health. Participants had no history of neurological or psychiatric concerns nor medications that could alter brain activity. All participants were in good general health with no reported scalp or skin conditions. Each participant stated they were familiar with the university food pantry but either rarely or never received food during a typical semester. Three participants described their emotional state as “Somewhat Positive”, one as “Neutral”, and one as “Somewhat Negative”.
Stimuli The stimuli consisted of keywords representing three linguistic tone categories, such as empathetic, neutral, and stigmatizing, to examine how subtle wording differences influence emotional and attentional responses in food pantry communication. Each tone category was defined according to its linguistic and emotional characteristics, ensuring consistent classification across all words. A total of 60 stimuli (20 words per tone) were presented in randomized order across three experimental rounds.
Empathetic toned words conveyed care, reassurance, and inclusion. They expressed understanding of recipients’ circumstances and emphasized dignity, belonging, and community. Language in this group uses possessive or collective framing (e.g., “our friends”, “our families”, “our community”) and positive descriptors that promote comfort, trust, and self-advocacy (e.g., “welcoming”, “nutritious”, “healthy”). These linguistic strategies align with dignity-center communication frameworks that highlight empathy and client voice as essential to reducing stigma and fostering participation (Food Bank News, 2022; Food Bank of the Rockies & Food Bank of Wyoming, 2022; Feeding America, 2023).
Neutral toned stimuli maintained an objective and informational quality. They avoided emotional or evaluative meaning and focused on factual descriptors of participants or contexts (e.g., “client”, “student”, “family”, “beneficiary”, “recipient”). This tone reflected standard administrative and eligibility-based phrasing used in institutional outreach materials (Bazerghi et al., 2016). Such neutral language provides a cognitive baseline for evaluating affective processing of non-emotional stimuli.
Stigmatizing toned words implied deficiency, judgement, or blame. They used negatively loaded or socially charged language that reinforced stereotypes about need and dependency (e.g., “needy”, “poor”, “refugee”, “low-income”). Prior research shows that stigmatizing or moralizing language can enhance social threat responses and discourage help-seeking behavior (Raymond & Rouzier, 2023; Van Wassenhove, 2006).
All stimuli were matched for length (two to three syllables) and grammatical form (noun or short noun phrase) to control linguistic variability. The design isolates tone-based emotional and cognitive effects by comparing responses across neutral, empathetic, and stigmatizing word categories, while maintaining ecological validity grounded in real food- pantry and food-bank terminology (Feeding America, 2022).
Evaluating Subconscious Response to University Food Pantry Outreach 761
Equipment In this study, a 64-channel ActiCHamp Plus amplifier was connected to a Dell computer to record EEG participant data. The reference electrode was positioned at the FCz location and the grounding electrode at Fpz. Active actiCAP slim electrodes used conductive gel for impedance coupling, and participants wore a snap cap to hold the electrodes in place. Stimuli were presented on a secondary Dell computer that was connected to the Tobii Pro Spectrum to record eye-tracking data. To synchronize the eye-tracking and EEG recordings, the TriggerBox Plus was connected to the secondary Dell computer and the ActiCHamp Plus amplifier to send trigger markers from the eye-tracker to the EEG software system.
Experimental Design The experiment employed a within-subjects design consisting of three main rounds, each designating one tone category (empathetic, neutral, or stigmatizing) as the target condition. Each round contained the same 60-word stimuli; the only variation was which tone category served as the target for that round.
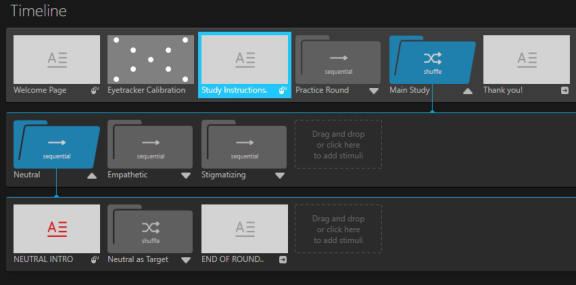
To mitigate order effects, the stimuli were randomized within each round, and the sequence of rounds were randomized across all participants. As a result, the target tone category (empathetic, neutral, or stigmatizing) that participants experienced first was randomly assigned (see Figure 1). This random assignment distributed potential order effects evenly across the sample, reducing systematic bias.
This design ensured that every participant experienced identical stimuli under each tone condition, allowing for direct within-subject comparisons of neural and attentional responses to different emotional tones while controlling for individual variability.
Figure 1: Experimental timeline (Tobii Pro Lab screenshot).
Tasks and Procedures Once participants were confirmed for the study, head measurements were obtained the day prior to their scheduled session to pre-select and populate
the appropriate EEG cap size. Upon arrival, participants were briefed with the purpose of the study and were offered opportunities to ask questions. After providing written consent, participants completed a pre-experimental survey assessing demographic and baseline information.
Participants were then fitted with the 64-channel EEG cap. Thirty-two of these electrodes were prepared with conductive gel arranged according to the international 10–20 system. Signals were recorded at a sampling rate of 500 Hz, and electrode impedances were maintained below 25 k, consistent with manufacturer-recommended thresholds.
Prior to the main task, participants completed an eye-tracking calibration to ensure accurate gaze mapping. Then, participants completed a brief practice round using neutral words as the target and were encouraged to ask questions. These preparatory steps were implemented to ensure accurate calibration and participant understanding of the task instructions.
The experiment consisted of three randomized rounds, each corresponding to one of the tone categories. Each trial began with a fixation cross (1s) followed by the presentation of the word stimulus (3s) displayed at the center of the screen. During the three-second presentation, participants were instructed to click the word only if it matched the target tone for that round. Short breaks were provided between rounds to minimize fatigue.
All experimental tasks were presented and recorded using Tobii Pro Lab. Each stimulus was defined as an Area of Interest (AOI) to capture pupil size while also registering mouse clicks. This configuration enabled the integration of visual attention metrics and response accuracy, with precise synchronization between EEG and eye-tracking data streams.
The entire session, including setup, calibration, practice, and recording, lasted approximately 60–90 minutes per participant.
Data Collection Pre-experimental surveys were collected using Qualtrics. Eye-tracking data and EEG data were recorded using the Tobii Pro Lab and Brain Vision Recorder, respectively. After recordings were complete, the eye-tracking data was synchronized with the EEG data in Brain Vision Analyzer 2.3.
EEG raw signals were first visually inspected to verify channel integrity, followed by the insertion of synchronized eye-tracking stimuli and AOI markers. A band-pass filter of 0.5–30Hz with a 60Hz notch filter was applied to remove slow drifts and electrical noise. The continuous data was then segmented according to the experimental conditions, resulting in the three main categories: Neutral, Empathetic, and Stigmatizing. Segments associated with practice trials were excluded from analysis.
RESULTS AND DISCUSSION
Performance Data For each condition, Fast Fourier Transform (FFT) was performed to convert the time-domain EEG signal into the frequency domain. The mean spectral power was extracted from the alpha band (8–12 Hz) as an index of attentional engagement. The exported frontal alpha asymmetry (FAA) was used as a measure of emotional regulation. These values served as input for
Evaluating Subconscious Response to University Food Pantry Outreach 763
the statistical analysis comparing the three tone conditions. The values for each participant are listed in Table 1.
A repeated measures of analysis of variance (ANOVA) was conducted to investigate the effect of tone conditions. No violations were found for normality, homogeneity of variance, or sphericity. An insignificant effect of tone conditions was found (F2,8=3.32, p=0.0891).
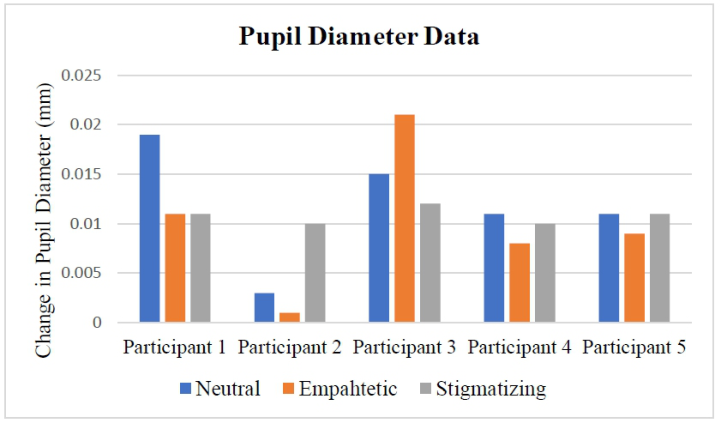
Eye Tracking Data Subsequently, the pupil diameter was collected for each participant for each condition in Figure 2. The pupil diameter showed that for the stigmatizing category, the change in diameter was about equal across all participants, but for empathetic and neutral categories, participants had varied changes in pupil diameter. Participant 1 had the highest change in pupil diameter in the neutral category while participant 2 had the lowest change in pupil diameter. Participant 3 had the highest change in pupil diameter in the empathetic category while participant 2 had the lowest change in pupil diameter. A repeated measures of analysis of variance (ANOVA) was conducted to investigate the effect of tone conditions on pupil diameter. No violations were found for normality, homogeneity of variance, or sphericity. An insignificant effect of tone conditions was found (F2,8=0.25, p=0.7824).
The insignificant effect of tone conditions was not expected, as all three categories are meant to elicit different reactions. EEG data revealed minimal variation in FAA across the three tone conditions, suggesting that participants maintained similar attentional states throughout the task. However, individual differences were evident particularly in participant 1, who showed consistently positive FAA value indicating left-frontal dominance, in contrast to the predominantly right-frontal activation observed in the rest of the group. A possible reason for this is the small sample size of participants. Having only 5 participants is a constraint that may not take into account the full effect of the tone of words. Another possible reason for insignificant effect is the participants not perceiving the tone differences based off the word choice. Some participants may perceive that a word may be empathetic, while others may perceive a word to be stigmatizing.
A similar trend appeared in the eye-tracking data. Changes in pupil diameter showed that while the stigmatizing condition resulted in relatively stable responses, the neutral and empathetic tones produced more variability between participants. Despite these individual fluctuations, the overall effect of tone on pupil response was not significant. Taken together, the EEG and
eye-tracking findings suggest that word tone alone did not produce robust differences in emotional or attentional processing. The consistent lack of significance across both measures reflects the limited emotional impact of text-only stimuli and the small sample size, which reduced the ability to detect subtle differences.
Figure 2: Participant pupil diameter across the alpha band.
CONCLUSION
This study was conducted using EEG and eye-tracking to investigate neural and visual responses to three categories of words. Findings revealed that language used in hunger relief communications had no significant effect on word choice.
For future research, we recommend exploring theta waves alongside alpha waves to gain a more comprehensive understanding of brain activity for each condition of words. Theta and alpha waves often show an inverse relationship during tasks involving mental workload, empathy, and social cognition. Simultaneous analysis could provide a fuller picture of the emotional and cognitive emotional processing evoked by different word conditions. Ultimately, the results of this study can guide food banks in developing more effective communications and serve as a baseline for establishing best practices in proper word choice. We also recommend using words that have a concrete meaning for being empathetic, stigmatizing, or neutral to allow for less variation across participants.
ACKNOWLEDGMENT
This research is partially funded by NSF EiR: Human Centered Visual Analytics for Evidence Based Decision Making in Humanitarian Relief (Award #: CNS 2100855).
Evaluating Subconscious Response to University Food Pantry Outreach 765
REFERENCES
Alvino, L., Pavone, L., Abhishta, A. and Robben, H. (2020). Picking Your Brains: Where and How Neuroscience Tools Can Enhance Marketing Research. Frontiers in Neuroscience, [online] 14, p. 577666. doi: https://doi.org/10.3389/ fnins.2020.577666. Andrews, M. and Setchi, R. (2023) ’Integrated Analysis of EEG and eye tracking
to measure emotional responses in a simulated healthcare setting,’ Procedia Computer Science, 225, pp. 2047–2056. https://doi.org/10.1016/j.procs.2023.10. 195. Bazerghi, C., McKay, F. H. and Dunn, M. (2016) The role of food banks in addressing food insecurity: A systematic review. Journal of Community Health, [online] 41(4), pp. 732–740. doi:10.1007/s10900–015-0147–5. De K Brito-Silva, F. Wang, W. Moore, C. Warren, C. Miketinas, D. Tucker, W. and
Davis, K. (2022) ’College Campus Food Pantry Program evaluation: What barriers do students face to access On-Campus food pantries?,’ Nutrients, 14(14), p. 2807. https://doi.org/10.3390/nu14142807. Feeding America. (2022) How do drive-thru food pantries work? Available at: https: //www.feedingamerica.org/hunger-blog/how-do-drive-thru-food-pantries-work. Feeding America. (2023) Client choice and dignity toolkit. Available at: https://lear
ninghub.feedingamerica.org/best-practices/toolkit. Food Bank News. (2022) Empathy in action: How food pantries change lives.
Available at: https://www.foodbanknews.org/. Food Bank of the Rockies and Food Bank of Wyoming. (2022) Best practices for inclusive food pantries: Building belonging course guide. Available at: https://medialibraryfbr.s3.us-east-2.amazonaws.com/wp-content/u ploads/2024/03/04190308/BuildingBelongining_InclusivePantryGuide.pdf. Gardiner, K. and Harvey, S. (2024). Are we meeting student needs? Developing a measure for college food pantry satisfaction. Journal of agriculture, food systems, and community development, 13(3), pp. 1–12. doi: https://doi.org/ 10.5304/jafscd.2024.133.027. Krupp, B. Gersey, J. and Lebo, F. (2022) ’Campus Plate: Connecting Students on
College Campuses to Reduce Food Waste and Food Insecurity,’ Proceedings of the International Conference on Research in Adapative and Convergent (RACS ’22), 3–6 October, Virtual Event, Japan. New York, NY: ACM, pp. 172–177. https://doi.org/10.1145/3538641.3561506. Raymond, C. and Rouzier, A. (2023) Shame and hunger: Breaking the stigma through lived experiences. Behavioral Health News, [online] 18 April. Available at: https://behavioralhealthnews.org/shame-and-hunger-breaking-the-stigma-th rough-lived-experiences/. Swipe Out Hunger (2024) 2024 National Campus Survey Dashboard: National
campus food pantry data. Available at: https://swipehunger.org/campusdata2024/ (Accessed: 24 October 2025). Swipe Out Hunger. (2025). National Campus Food Pantry Data - Swipe Out Hunger.
[online] Available at: https://swipehunger.org/2023pantry/. Tenille Metti (2022). 5 Things To Know About The Campus Pantry and College Hunger Landscape - Swipe Out Hunger. [online] Swipe Out Hunger. Available at: https://swipehunger.org/pantryhungerdata/. Van Wassenhove, L. N. (2006) Humanitarian aid logistics: Supply chain management
in high-pressure environments. Journal of the Operational Research Society, [online] 57(5), pp. 475–489. doi:10.1057/palgrave.jors.2602125. W. A. Wan Ismail, M. Hanif, S. B. Mohamed, N. Hamzah, and Z. I. Rizman, “Human Emotion Detection via Brain Waves Study by Using Electroencephalogram (EEG)”, Int. J. Adv. Sci. Eng. Inf. Technol., vol. 6, no. 6, pp. 1005–1011, Dec. 2016.
LISTED IN THE AHFE DIGITAL BOOKSTORE CATALOGUE
Explore the complete digital volume
Human Factors in Design, Engineering, and Computing
Read this individual research paper free through the original publisher, or explore the full digital proceedings book.
ISBN 978-1-964867-75-5
Explore this ISBN in the AHFE Bookstore ↗Listed in the July 2026 bookstore catalogue; search by ISBN to confirm current availability · Digital book purchase optional