Mikaya Hamilton, Steven Jiang, Lauren Davis (2023). Understanding the Dietary Need of a Local Food Bank’s Population Using Visual Analytics. In: Health Informatics and Biomedical Engineering Applications. AHFE Open Access, vol. 78, pp. 32–40. https://doi.org/10.54941/ahfe1003452
Food banks are at the forefront of the battle against food insecurity which is a condition where households do not have adequate access to food. Traditionally speaking, food banks focus on distributing food to meet the needs. Recently, more food banks are shifting to supply adequate healthy food based on the populations they serve. However, the question remains whether a local food bank can find racial communities in need with dietary considerations. This study's purpose is to use data collected by a local food bank and create visualizations to aid strategic decision-making for the food bank to recognize racial communities with those who have dietary considerations. Results revealed nine out of sixteen counties in the service area of the local food bank have the highest number of African Americans allergic to shellfish compared to a few counties having the highest number of Whites, American Indians, and Hispanic/Latinos. Additionally, 53.7% of African Americans, 11.2% of Hispanics and Latinos, and 34.3% of Whites face lactose intolerance. Data shows that African Americans have the highest number of dietary considerations in most categories that are in several counties. The significance of this study supports a local food bank in finding dietary considerations within the areas they serve. Finding racial communities that face dietary considerations will aid the local food bank in making better strategic decisions on what types of food they should serve and where. Ultimately, the importance of this study is to combat food insecurity and hunger, so that members of the local food bank community can have dignity in knowing the food that will be given is valuable and not wasted.
Hunger is one of the most critical issues in society and we must not stop until every individual has access to a basic human right. Food insecurity has always remained a serious global concern. More specifically in the United States, 13.5 million households and 2.3 million households among children were food insecure in 2021 (Coleman-Jensen et al. 2022). These numbers have yet to significantly decrease from previous years.
Food insecurity affects anyone regardless of their name, color, or creed, but studies have shown it disproportionately affects minorities between racial and ethnic groups (Myers and Painter, 2017). In 2018, 21.2% of Blacks and 16.2% of Hispanics were food insecure when the national average was
Understanding the Dietary Need of a Local Food Bank’s Population Using Visual Analytics 33
11.1% (Morales et al. 2020). Being food insecure is already enough to endure, but also having food allergies and preferences can add more stress to finding the right foods to eat. Dietary needs can disproportionately affect minori- ties especially since the impact of allergies relies on socioeconomic status to supply medication, allergy-free foods, and access to economical care when needed (Bilaver et al. 2016). Data has shown food allergy occurrence can be common for minorities to be allergic to shellfish, nuts, and wheat (Protudjer et al. 2021). While racial and ethnic communities are affected by food insecu- rity and allergies, the United States has become more multiracial and diverse than in the past.
According to the U.S. Census Bureau, all ethnic groups experienced popu- lation gains this decade except for those who are White (Jones et al. 2021). With minority populations rapidly increasing and food insecurity rates barely decreasing, racial and ethnic groups will continue to not have equitable food and resources like they should, especially if they have dietary considerations. Of course, there are other factors to food insecurity, like poverty and unem- ployment, but even when these factors are removed, minorities still pose a higher risk for food insecurity (Morales et al. 2020). It is crucial to help members of our community because everyone deserves the right to a healthy, adequate lifestyle. The work to end hunger is never finished.
To combat hunger, food banks play a crucial role in acting as a pillar for the community. Hunger relief organizations are instrumental in fighting food insecurities in neighborhoods, and they work tirelessly to equitably distribute food to those in need. However, the process can be extremely complex. Food banks distribute food to their partner agencies and issue other services and benefits to their clients.
Even though food banks and other hunger relief organizations work hard to support millions of people, their neighbors may have preferences. There has been a huge push in the hunger relief industry to serve healthy and dietary food options. For example, a food bank says, “Food is a very personal thing - cultural background, life experiences, and dietary needs all play into our food preferences” (Greater Pittsburgh Community Food Bank, 2021). This initiative is important because pounds of food can go to waste if populations do not find it valuable. From a systems standpoint, programs that provide this service will be more efficient if the food is consumed by the individuals that are receiving it (Way, 1976). Individuals may enjoy relevant food because of personal taste preferences, knowledge of how to prepare the food, religious reasons, or dietary restrictions.
There should be an ongoing effort by offering more visual aids to hunger relief organizations to better serve their local areas. This ability will allow them to make the necessary decisions based on dietary considerations. Many organizations use different technological platforms to adapt to their speci- fic needs (Arshad et al. 2019). One popular software that is used is called Link2Feed. Link2Feed is a management system that allows the organization to understand who is using the services and how the food bank can bet- ter serve them (Armbruster and Benedict, 2021). The client completes an electronic and voluntary survey that asks for their name, gender, age, eth- nicity/race, address, dietary consideration, number of household members,
monthly income, the highest level of education, and enrollment in govern- ment aid benefits. The data from the client is then automatically imported and shown in Link2Feed. The organization can see general trends and cre- ate statistical reports. Link2Feed has several categories that can track client information such as “Dietary Considerations”, but the types of dietary con- siderations are very restrictive (Branton, 2022). The software also supplies a heat map of the concentration in an area of households in need and will display where the agency partners are located. However, the software can limit organizations because it is not customizable. It does not allow them to investigate complex factors with basic trends that do not fully encapsulate the needs of the food bank and community.
A food bank in North Carolina faces this exact issue with Link2Feed. They have a network that makes up almost 200 partner agencies spread across multiple counties. They are unable to find vulnerable areas where their clients face dietary considerations, which include allergies and food preferences.
METHOD
This research focused on the human-centered design method to create dash- boards that visually explore data. Utilizing visual analytics and human- centered design allows the food bank to make evidence-based decisions in resource allocation on the client’s dietary needs. An employee from the local food bank was interviewed, via Zoom, supplying context on what the orga- nization desperately needs. The food bank employee served as a guide and verified each step of the process to ensure satisfaction. It was crucially impor- tant to evaluate dietary considerations. Mostly dietary considerations can fall within food allergies such as peanut, shellfish, lactose, dairy, soy, eggs, and tree nuts. The food bank mentioned other food preferences like vegan, vege- tarian, kosher, and low sodium contents. Additionally, clients can select to opt out of red meat and pork.
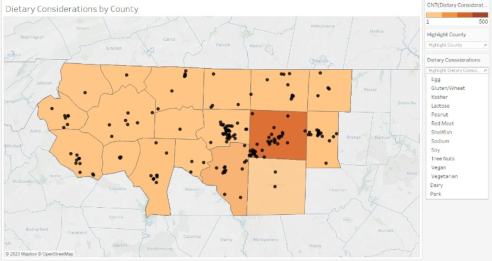
Visualizations in Tableau were created by using the food bank’s Link2Feed data. The visualized data is presented in the form of a heat map that displays the service area into counties. The darker the hue, the more concentrated the counties are when a dietary consideration is selected. There are black dots that show the partner agency’s location within the counties (see Figure 1).
Figure 1: Dietary Considerations by County Dashboard.
Understanding the Dietary Need of a Local Food Bank’s Population Using Visual Analytics 35
This will help the food bank find which partner is closest to the area in need. Also, the interactive dashboard allows the user to search for each county and dietary consideration shown in Figure 1. The user can type in the text box or use the scroll capability.
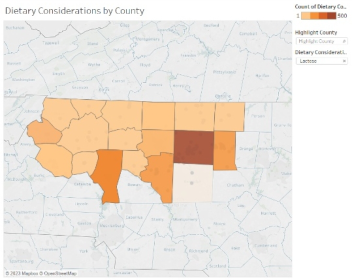
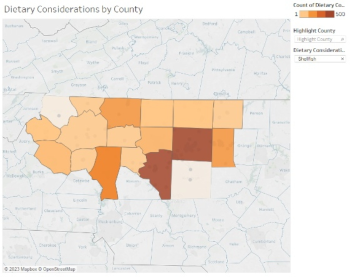
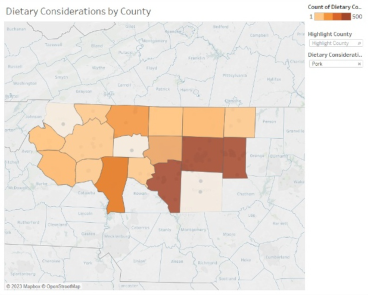
The most common dietary considerations like lactose, peanut, shellfish, dairy, and pork are visualized in Figures 2, 3, and 4. When comparing these
Figure 2: Dietary Considerations by County for Lactose (left) and Peanut (right).Figure 3: Dietary Considerations by County for Shellfish (left) and Dairy (right).Figure 4: Dietary Considerations by County for Pork.
figures, lactose is the most common in all areas, while pork and shellfish have highly populated counties. One county, in particular, has the most dietary considerations in the five food categories.
RESULTS
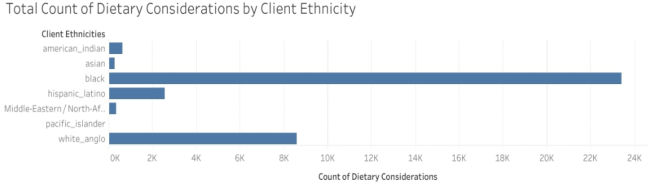
The visual data from the dashboards were analyzed in multiple ways so the local organization can truly understand the population. Data from Figure 5 shows that almost 24,000 people who identify as African Americans or Black, have the highest total number of individuals facing dietary considerations. No race or ethnicity is close to this number. On the other hand, Asians face the least number of dietary considerations in all categories.
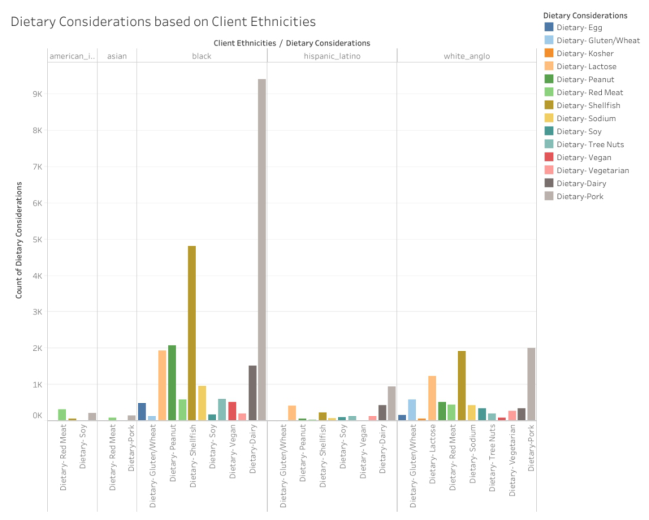
Figure 6 shows each client’s ethnicity and the total number of individuals who face each dietary consideration in all counties. African Americans have
Figure 5: Total Number of Dietary Considerations by Client Ethnicity.Figure 6: Dietary Considerations based on Client Ethnicities.
Understanding the Dietary Need of a Local Food Bank’s Population Using Visual Analytics 37
high numbers in most of the categories. Pork, shellfish, peanuts, dairy, and lactose are the most popular considerations for Blacks. Even though numbers aren’t extremely high for Whites, pork, shellfish, lactose, and gluten/wheat, are the most prevalent. The data has shown that other minorities like Hispa- nics/Latinos, Asians, and American Indians have exceptionally small numbers for dietary considerations.
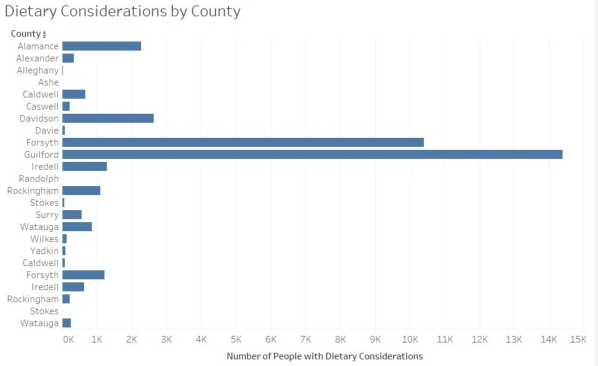
Visual analytics also allows the local food bank to see which counties have the highest number of considerations (see Figure 7). Guilford and Forsyth County have almost 15,000 and 11,000 people. Whereas, Stokes, Randolph, and Ashe had close to no reports of dietary needs.
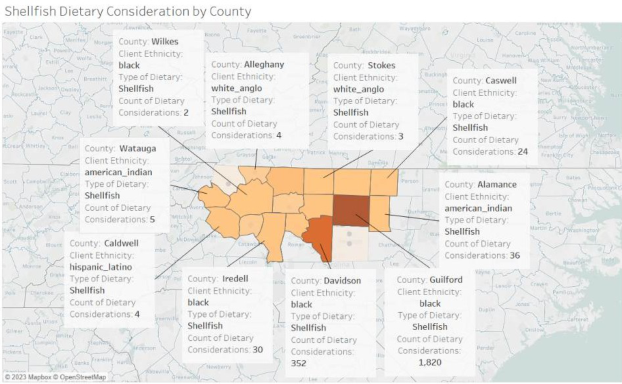
A feature that could aid the local food bank in visually identifying coun- ties relative to race and dietary considerations is displaying information on the dashboard. Figure 8 displays the visual when shellfish are selected. The
Figure 7: Total number of Dietary Considerations within each county.Figure 8: Total Shellfish Dietary Considerations based on County.
highest number of people having a shellfish allergy will populate the text box based on the client’s race. Nine out of the sixteen counties are African Americans (56.25%), four counties are Whites (27.78%), two counties are American Indians (12.5%), and one county is Hispanic/Latino (6.25%) that are allergic to shellfish.
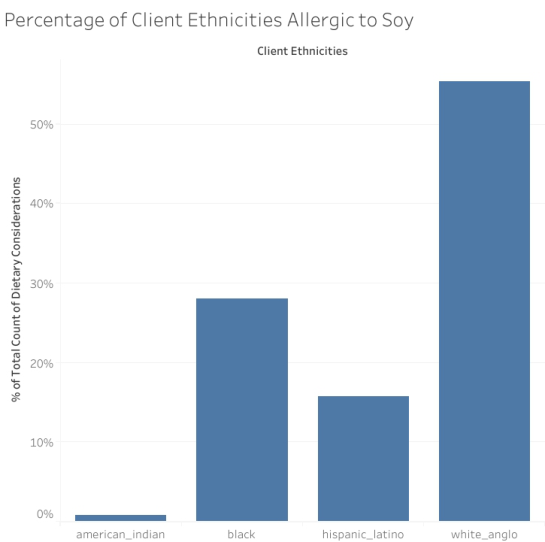
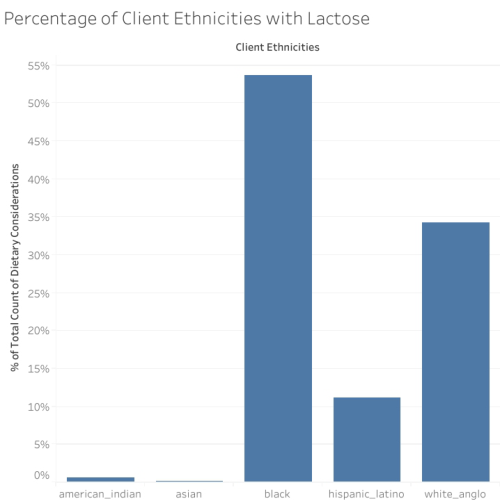
Tableau can take the information from the visualizations to graphically represent the dietary considerations. Figures 9 and 10 display graphs on the percentage of races from all counties that reported an allergy to soy and lactose intolerance. Data shows from Figure 9, that Whites have 55.34% more soy allergies than other races. Blacks, Hispanic/Latinos, and Ame- rican Indians make up 28.07%, 15.79%, and less than 1% respectively. In Figure 10, 53.66% of African Americans, 34.29% of White Americans, 11.19% of Hispanic/Latinos, and less than 1% of Asians and American Indians face lactose intolerance.
Figure 9: Chart of the percentage of client ethnicities who are allergic to soy.
DISCUSSION AND CONCLUSION It is exceedingly difficult for food banks to stay up to date on data and emer- ging trends to improve their resource allocation and management. Despite food banks collecting Link2Feed data, it is particularly challenging for the local food bank to find vulnerable populations that have dietary conside- rations. Using visual analytics and human-centered design, data shows that
Understanding the Dietary Need of a Local Food Bank’s Population Using Visual Analytics 39
Figure 10: Chart of the percentage of client ethnicities allergic to lactose.
African Americans have significantly higher dietary needs compared to Whi- tes and other minorities. Equally important, Guilford County had the highest number of people in need of dietary services. Foods such as pork, shellfish, lactose, and peanuts were popular dietary considerations in mainly Black and some White communities. Selected dietary considerations, like soy and lactose, were displayed by the percentage of each race through all counties. Data leads to mainly Whites reporting they were allergic to soy, meanwhile, Blacks reported they have the highest percentage of lactose. Hispanic/Latinos were significantly under 20% in both categories.
This study opens a new door for aiding food banks and there is still much left to do in this field. Other correlations and factors could be continued research, affecting one neighbor at a time.
ACKNOWLEDGMENT
This project is partially supported by NSF (National Science Foundation) award# 2100855. Any opinions, findings, conclusions, or recommendations expressed in this material are those of the author(s) and do not necessarily reflect the views of the National Science Foundation.
REFERENCES
Armbruster, B. and Benedict, I. (2021) The Correlation Between Individuals Returning to Food Pantries, Age and Income., Houston, TX. 2021.
Arshad, H., Basit, N., Bolinger, C., Nageeb, A., With, J. R. and Bloustein, E. J. (2019) Innovative Practices in Emergency Food Delivery Ralph W. Voorhees Public Service Fellows Evan Iacobucci, Planning and Public Policy Doctoral Program. Bilaver, L. A., Kester, K. M., Smith, B. M. and Gupta, R. S. (2016) ‘Socioeconomic
disparities in the economic impact of childhood food allergy’, Pediatrics, 137(5). doi: 10.1542/peds.2015–3678. Branton, Emily. (March 16, 2022) Daily Bread Food Bank Improved Client Health with Link2Feed’s Food Bank Software. Link2Feed Website: https://www.link2fee d.com/client-story-client-needs/ Coleman-Jensen, A., Rabbitt, M. P., Gregory, C. A. and Singh, A., 2022. Household
food security in the United States in 2021. United States Department of Agriculture Economic Research Service: Washington, DC, USA, p.51. Greater Pittsburgh Community Food Bank. (November 3, 2021) Equity, Diversity, and Inclusion on the Move at the Food Bank. Greater Pittsburgh Community Food Bank Website: https://pittsburghfoodbank.org/2021/11/03/equity-diversity-and-i nclusion-on-the-move-at-the-food-bank/ Jones, N., Marks, R., Ramirez, R. and Rios-Vargas, M. (2021) 2020 Census
Illuminates Racial and Ethnic Composition of the Country. United States Census Bureau. Morales, D. X., Morales, S. A. and Beltran, T. F. (2021) ‘Racial/Ethnic Disparities in Household Food Insecurity During the COVID-19 Pandemic: a Natio- nally Representative Study’, Journal of racial and ethnic health disparities, 8(5), pp.1300–1314. doi: 10.1007/s40615-020-00892-7. Myers, A. M. and Painter, M. A. (2017) ‘Food insecurity in the United States
of America: an examination of race/ethnicity and nativity’, Food Security, 9, pp.1419–1432. doi: 10.1007/s12571-017-0733-8. Protudjer, J. L., Greenhawt, M. and Abrams, E. M. (2021) ‘Race and ethnicity and food allergy: remaining challenges’, The Journal of Allergy and Clinical Immunology: In Practice, 9(11), pp.3859–3861. Way, M. J. (1976) ‘Entomology and the World Food Situation’, Bulletin of the Ento-
mological Society of America, 22(2), pp. 125-129. doi: 10.1093/besa/22.2.125.
LISTED IN THE AHFE DIGITAL BOOKSTORE CATALOGUE
Explore the complete digital volume
Health Informatics and Biomedical Engineering Applications
Read this individual research paper free through the original publisher, or explore the full digital proceedings book.
ISBN 978-1-958651-54-4
Explore this ISBN in the AHFE Bookstore ↗Listed in the July 2026 bookstore catalogue; search by ISBN to confirm current availability · Digital book purchase optional