Steven Jiang, Henry Ivuawuogu, Amir Milad Javadi, Mikaya Hamilton, Lauren Davis (2024). Development of food bank data visualizations using eye tracking. In: The Human Side of Service Engineering. AHFE Open Access, vol. 143, pp. 91–97. https://doi.org/10.54941/ahfe1005087
Food banks are key players in the fight against hunger. The complexity of the food bank operations data makes decision-making very challenging. Data visualization can allow food bank operations managers to quickly and easily understand the data and make evidence-based decisions. However, poorly designed visualizations could be confusing and/or misleading. This study uses eye-tracking technology to understand how users interact with various food bank data visualizations and use eye-tracking data to better design those visualizations. The findings of this study will have an impact on improving the effectiveness and efficiency of the food bank operations.
The U.S. Department of Agriculture (USDA) defines food insecurity as “a household-level economic and social condition of limited or uncertain access to adequate food” (USDA Economic Research Service, 2024). Food insecure households struggle with sufficient food for an active, healthy life (Campbell, 1991; Coleman-Jensen, Gregory, Singh, 2013). Food insecurity is not just a problem in developing countries. There is a growing food insecurity problem in the United States and more than 10% of U.S.households have been affected every year since 1998 (Matthew et al., 2023).
In 2022, The Economic Research Service (ERS) of the United States Department of Agriculture (USDA) estimated 87.2 percent of U.S. house- holds were food secure throughout the entire year in 2022 (Matthew et al., 2023). However, the remaining 12.8 percent of households were food inse- cure at least some time during the year and that number was 10.2 percent in 2021 and the difference between these two years is statistically significant (Matthew et al., 2023). In 2021, 6.4 percent of household experienced low food security and 3.8 percent of household experienced very low food secu- rity. Those numbers became 7.7 percent and 5.1 percent respectively in 2022. Both are statistically higher than those in 2021 (Matthew et al., 2023).
Therefore, food insecurity becomes an issue that we simply cannot over- look. In addition to government programs (i.e., the Emergency Food Assis- tance Program (TFAP), The Special Supplemental Nutrition Program for
Women, Infants, and Children (WIC)), humanitarian relief organizations such as food banks play a very critical role. They are nonprofit organizations that provide food to people in need. Food banks acquire, sort, and distribute food through a network of partner agencies and direct distributions, and there is a significant level of uncertainty in both supply and demand of the food bank (Delpish et al., 2019). On the supply side, food banks are depen- dent on donations which might have uncertain frequency, amount or quality of donated items. On the demand side, the fact that food needs are dependent on variable such as poverty, unemployment, and unexpected sudden events brings uncertainty in demand (Davis et al., 2016).
The complexity of the operations and the large amount of operations data presents a challenge for food banks to make informed decisions on food acquisition and distribution. Despite the advancement of computing technology, human cognition has its limitations. For instance, human work- ing memory is limited and can only remember 7±2 chunk of information (Wickens et al., 2003). Therefore, there is a need to present data in a way that humans can understand easily and make informed decisions effectively. Data visualization has been considered as one of the important ways to understand and communicate research finding and has been applied to many fields to present information to users. Data visualizations represent information visu- ally to support understanding (Ward et al., 2015) and cognition (Hegarty, 2011). Various visualizations have been developed to assist food bank operations managers ranging from supply, demand, fleet management, and cultural rel- evancy of the food (Desai et al., 2017; Hamilton et al., 2023a; Hamilton et al., 2023b; Washington et al., 2023a; Washington et al., 2023b). However, data visualization is only the start. Presenting the visualization to the user and communicating with them is the other side of the story. Well-designed data visualization could support human cognition, but poorly designed visu- alizations can hinder human cognition. Hence, how to present information to users is very important. One way to assess the effectiveness of the visualiza- tions is through eye tracking. Eye tracking devices can capture the fixations, the duration of the fixations and track the path of the eye movements. In this preliminary research, we use eye tracking technology to study the effec- tiveness of various visualizations designed for food bank operations through analyzing eye fixation data.
METHOD
Participants Four students from North Carolina A&T State University participated in this study. There was one female and three male students. The mean age is 25 and the standard deviation is 1.7 years old. All participants had normal vision (20/20) and had no concerns about their eye health. All participants were familiar with food bank operations data and had some experience with eye tracking.
Development of Food Bank Data Visualizations Using Eye Tracking 93
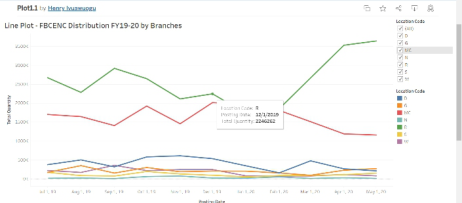
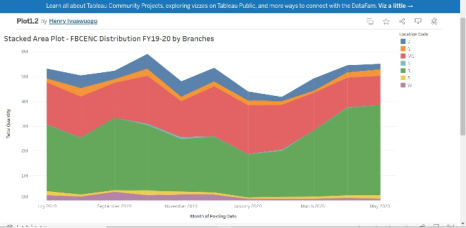
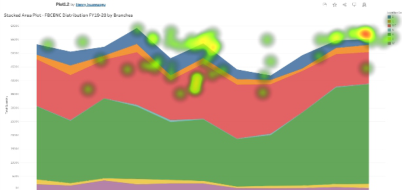
Stimuli In this study, four different visualizations were developed for a data set that describes the food distribution of a local food bank using Tableau. These four visualizations are a line plot, a stacked area plot, a stacked column plot, and a pie chart. Two examples (a line plot, and a stacked area plot) can be seen in Figures 1 and 2 respectively.
Figure 1: A line plot.Figure 2: A stacked area plot.
Equipment In this study, Tobii Pro Spectrum that was connected to a Dell computer was used to present the stimuli to the participants and collect eye tracking data.
Experimental Design In this study, each participant completed the same task with the same four visualizations. However, the order of the visualizations presented was random. Therefore, a within subject design was used.
Tasks and Procedures Participants were informed of the objective of the study and the tasks they would be asked to perform during the study and provided a chance to ask any questions or concerns. After the informed consent, each participant was given time to get comfortable with the equipment. Since Tobii Spectrum eye tracker is using infrared illuminators and embedded with the screen, there are little constraints to the participant. Each participant was asked to relax and follow screen instructions to get their eyes calibrated. Each participant was asked to answer the questions “Which branch has the highest overall
distribution? How certain are you?”, “What month has the highest overall distribution? How certain are you?”, “Which branch has the second high- est overall distribution? How certain are you?”, “What month has the least distribution? How certain are you?” This experiment was not paced, and par- ticipant could take time to find the answer and they were encouraged to think aloud. Upon completion of the experiment, the participant was thanked for their participation.
Data Collection The screen of the experiment was recorded with eye tracking data as well as other performance data (time to complete the task, number of clicks, errors) being automatically collected.
RESULTS AND DISCUSSION
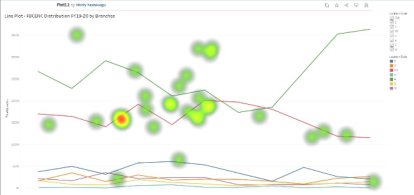
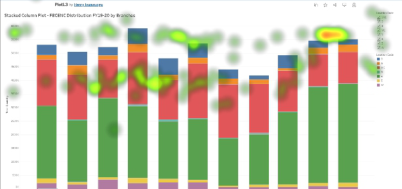
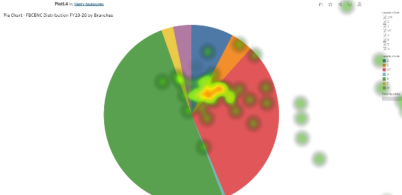
Heatmaps were generated for each participant interacting with the visualiza- tions. These heatmaps are visual representations of where the fixations of a participant were distributed on a video frame with colours based on fixation data. These data consist of sample that contains timestamp, fixation duration, and spatial locations (Tobii, 2024). Across all four participants, similar pat- terns have been observed. While participants had an easy time to complete the task with some visualizations, they struggled with others. Figures 3–6 show the heatmaps of a participant answering the question “Which branch has the second highest overall distribution? How certain are you” using the line plot, stacked area plot, stacked column plot, and bar chart respectively. Through these heatmaps, we can observe the participant’s fixation and its duration.
Although a line plot is easy to construct and can allow a user to track the observations of one or more groups over time, and make predictions based on the trend, it is not necessarily a good tool to explain the aggregated infor- mation for different segments. On the other hand, stacked area plot is more suitable for these kinds of task. The heatmap in Figure 3 clearly shows the participant struggle with using the line plot to find the aggregated informa- tion while the participant did not have much trouble using the stacked area plot as seen from the heatmap (Figure 4). Particularly, the stacked area plot allows the user to understand the breakdown of the aggregated value by each segment and compare with each other.
Figure 3: Heatmap of participant 1 using the line plot.
Development of Food Bank Data Visualizations Using Eye Tracking 95
Figure 4: Heatmap of participant 1 using the stacked area plot.Figure 5: Heatmap of participant 1 using the stacked column plot.Figure 6: Heatmap of participant 1 using the pie chart.
From Figure 5, it is also clear that the participant was comfortable with using the stacked column plot to complete the task. On the other hand, even though a pie chart is very simple to construct and yet it is often not accurate. The key issue with the pie chart is the misrepresentation of information for comparison since ordinary people are not good at assessing quantity using angles. It is often difficult to relate labels with each slice. The heatmap in Figure 6 clearly shows the struggle the participant had during this task.
It is important to point out that there is no “one size fits all” solution. Different visualizations have their pros and cons. It is up to the analyst to select the appropriate visualizations for a particular task. From the result of this study, it becomes very clear that there is a need to develop a guide that provides design suggestions of visualizations based on various food bank operations and the data involved.
CONCLUSION
Food banks are key players in the effort to reduce food insecurity. Yet, their complex operations and huge amount of data generated from their
operations require the analysts to develop easy tools to assist them mak- ing evidence-based decisions. Visualizations have been proven to be effective tools to represent information from complex data. However, caution needs to be taken when using visualizations since not all visualizations are suitable for any food bank operations task. This study used eye tracking technique to clearly demonstrate how users interact with the visualizations and find- ings from the study will shed lights in the challenges of using visualizations in the food bank and provide some important information to guide better development of the visualizations for the food bank.
ACKNOWLEDGMENT
This study is partially funded by NSF EiR: Human Centered Visual Analytics for Evidence Based Decision Making in Humanitarian Relief (Award #: CNS 2100855).
REFERENCES
Campbell, C. C., (1991). Food insecurity: A nutritional outcome or a predictor variable? The Journal of Nutrition, 121(3), 408–415. Coleman-Jensen, A., Gregory, C., Singh, A. (2013) Household food security in the
United States in 2013. USDA-ERS Economic Research Report (256). Davis, L., Jiang, S., Morgan, S., Nuamah, I., Terry, J. (2016), “Analysis and prediction of donation behavior for a domestic hunger relief organization” International Journal of Production Economics. 182, 26–37. doi information: 10.1016/j.ijpe.2016.07.020. Delpish R., Jiang S., Davis L., Odubela K. (2019) A Visual Analytics Approach to
Combat Confirmation Bias for a Local Food Bank. In: Boring R. (eds) Advances in Human Error, Reliability, Resilience, and Performance. AHFE 2018. Advances in Intelligent Systems and Computing, vol. 778. Springer, Cham. Desai, Y., Jiang, S. & Davis, L. (2017). Development of a Dashboard for a Local Foodbank. American Journal of Engineering and Applied Sciences, 10(1), 218–228. Hamilton, M., Jiang, S., Davis, L. (2023a). Understanding the Dietary Need of a
Local Food Bank’s Population Using Visual Analytics. In: Jay Kalra (eds) Health Informatics and Biomedical Engineering Applications. AHFE (2023) International Conference. AHFE Open Access, vol. 78. AHFE International, USA. https://doi. org/10.54941/ahfe1003452 Hamilton, M., Jiang, S., & Davis, L. (2023b, June). Visualizing a Local Food Bank’s Chronic Health Disease Population. In 8th North America Conference on Indus- trial Engineering and Operations Management, https://doi.org/10.46254/NA8. 20230154. Hegarty, M. (2011). The cognitive science of visual-spatial displays: Implications
for design. Topics in Cognitive Science, 3, 446–474. http://dx.doi.org/10.1111/j. 1756-8765.2011.01150.x Matthew P. Rabbitt, Laura J. Hales, Michael P. Burke, Alisha Coleman-Jensen, (2023), Household Food Security in the United States in 2022. USDA-ERS Economic Research Report (325). Tobii (2024), Heatmaps in Tobii Pro Lab, https://connect.tobii.com/s/article/Calculate-
heat-maps?language=en_US.
Development of Food Bank Data Visualizations Using Eye Tracking 97
USDA Economic Research Service (2024), Definitions of food security, https://www.ers.usda.gov/topics/food-nutrition-assistance/food-security-in-the-u- s/definitions-of-food-security/, last accessed on January 16, 2024. Ward, M. O., Grinstein, G., & Keim, D. (2015). Interactive data visualization: Foundations, techniques, and applications, 2nd ed. Boca Raton, FL: CRC Press. Washington, H., Jiang, S., Davis, L., Kim, H. (2023a). Examining local food deserts
using visual analytics. In: Christine Leitner, Jens Neuhüttler, Clara Bassano and Debra Satterfield (eds) The Human Side of Service Engineering. AHFE (2023) International Conference. AHFE Open Access, vol. 108. AHFE International, USA. https://doi.org/10.54941/ahfe1003957 Washington, H., Jiang, S., Davis, L., & Kim, H. (2023b, July). E-Commence: Visualizing a Growing Future of Tackling the Food Deserts Problem. In 6th European International Conference on Industrial Engineering and Operations Management, https://doi.org/10.46254/EU6.20230040. Wickens, C., Lee, J., Liu, Y., Gordon-Becker, S. (2003), Introduction to Human
Factors Engineering, 2nd edition, Pearson.
LISTED IN THE AHFE DIGITAL BOOKSTORE CATALOGUE
Explore the complete digital volume
The Human Side of Service Engineering
Read this individual research paper free through the original publisher, or explore the full digital proceedings book.
ISBN 978-1-964867-19-9
Explore this ISBN in the AHFE Bookstore ↗Listed in the July 2026 bookstore catalogue; search by ISBN to confirm current availability · Digital book purchase optional