Louis Freund, Assil Talbi, Stephen Kwan (2024). The Customer's Preparedness and Product Quality - Impacts on Customer Satisfaction. In: The Human Side of Service Engineering. AHFE Open Access, vol. 143, pp. 129–138. https://doi.org/10.54941/ahfe1005091
This paper explores whether customer satisfaction survey results should be interpreted in terms of both the quality of the product as received and the customer’s preparedness to engage with it as expected. We designed a controlled experiment and conducted it with 103 participants. The study confirms that the participant’s overall satisfaction with a small product comprised of five pieces needing assembly (presented at three quality “levels”) was strongly related to both its quality level and to their own preparedness to assemble it.
It is an accepted standard that a product’s quality is closely monitored dur- ing each process that produces it. In fact, quality is likely to be assessed in many dimensions as raw materials are transformed to the finished assem- bly and packaged. The science of statistical process control has evolved from the needs for tools and theory for the product quality assurance goals that every manufacturer must have. Similarly, customer satisfaction surveys have been widely adopted to assess the customer’s satisfaction with the product as received and used. However, the preparedness of the customer is likely to be overlooked when satisfaction results are interpreted. While low satisfaction may be strongly associated from product related deficiencies, we hypothesize that satisfaction also reflects the preparedness of the customer for engaging with the product itself, even when it has no actual deficiencies or defects. Our intent is to provide direction for future research and development in the area of product satisfaction surveys.
This paper provides a brief review of statistical process control and discusses how customer satisfaction ratings may reflect the customer’s pre- paredness to use a product or service, in addition to the quality of the product or service itself.
Statistical Process Quality Management In establishing a manufacturing process quality control program, “process control limits”, or “specifications” are defined for each measurement to be
made in the process according to cost and performance requirements. Statisti- cal process quality management has the overriding goal of determining, in as near to real time as possible, when any aspects of the processes being managed are “out of control” or beyond these specification limits and require inves- tigation for “special cause”. Statistical techniques are used to monitor the variation of individual process elements, the relationships between descrip- tive process measurements, and the relationship of sample process measures to previous results for those same measures.
Applications in Production of Goods Manufacturing has been particularly well served by statistical process con- trol techniques. Every part, used in every product, has at least one design specification and associated allowable tolerance. Every subassembly has spec- ifications as to its performance and physical characteristics which, when met, certify it for suitability for inclusion in some larger component of the final product. In fact, it is the ability to be compliant with previously established specifications and tolerances, for every part, for every time it is produced, that enables modern manufacturing methods to succeed. We can produce millions of each product because we can make millions of every component that they are built from within tolerances that assure assembly and performance is pos- sible for every one of the widgets. These processes are monitored by statistical process control methods that focus on assuring satisfaction of the manufac- turer’s specifications for materials, fabrication, assembly, and testing. When specifications are met in every dimension, the product, including its packag- ing, is deemed to be ready for the retailer’s shelf and sale to the customer. Process quality control happens entirely before the sale, and results in the completed and packaged product, ready for shipment on the manufacturer’s loading dock.
Of course, some customers are more prepared to interact with the product as designed than others, so attention is given to providing instructions, user manuals, and information about replacement parts when they are needed. But these materials are meant to support the product as made, and as specified by the manufacturer. The purchaser of the product assumes the responsibility of becoming knowledgeable in its operation, some maintenance, and thereby, his or her own satisfaction with it.
More recently, manufacturers have come to realize that the traditional view of their interests ending with the product on the shipping dock is insufficient. To be competitive in today’s markets, manufacturers have become deeply concerned about assessing the purchaser’s overall experience and satisfaction with their products. This need has transformed the manufacturer’s role from “simply” producing the product to assuring that customers are satisfied with it. Customer support, rapid warranty work, accessories, user groups, and a wide range of additional strategies and responsibilities have become part of the manufacturer’s offerings for their products. However, the process con- trol methods that have been so effective in building the product would seem to fall short of being able to control the customer’s experience with it. Pro- duction process control is not applied to the variables that reflect differences
The Customer’s Preparedness and Product Quality: Impacts on Customer Satisfaction 131
in customer abilities, understandings, experience, and expectations, e.g., the customer’s preparedness to use the product they have purchased.
DESIGN SPECIFICATIONS FOR THE PRODUCT AND CUSTOMER PREPAREDNESS With most manufacturing processes, the production system’s design speci- fications provide quantitative requirements for its components and overall performance. The design specifications, or “specs” include myriads of detail about product dimensions and tolerances, internal connections and assem- blies, and what limits of customer actions will be tolerated when interacting with the product. Additionally, when planning products for customers to use, “customer design” specs also need to be enumerated. Among these, for example: How tall will customers be? How familiar will they be with the terminology? What language will they prefer to speak or read? Customers who purchase the product will be bringing their capabilities and experiences to their interactions with it and will be “within” the customer design spec, or not, depending on how broadly and completely customers were considered in the design of the product’s elements.
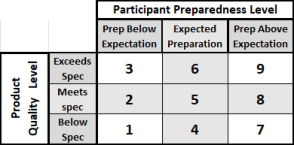
Any product, then, when a customer encounters it, is “Within”, “Below”, or “Above” all of its system design specs. Similarly, the customer who pur- chases the product must also be “Within”, “Below”, or “Above”the expected levels of customer preparedness specs as assigned by the product’s designer in anticipation of the population of customers. These three levels of each factor are represented in Figure 1 below, which shows 9 possible combinations of product quality and customer preparedness. The cells are numbered 1–9 for reference.
Figure 1: Cell numbers for discussion purposes.
Cell 5, for example, refers to the condition where the product meets all production specifications as well as the customer’s preparedness to interact with the product meets the levels expected by the product designers. Similarly, Cell 1 refers to the situation where a defective product (although unknown as such by the manufacturer) is used by a customer who is unprepared with the abilities or experience to use it as expected, while Cell 7 refers to the same defective product purchased by a customer who is highly prepared with the abilities and experience to use it.
Customer Satisfaction Surveys When manufacturers distribute satisfaction surveys with a product, they no doubt anticipate that the product being rated has met all of the manufac- turing specs that were in place before shipment. High customer satisfaction
scores are expected, and low satisfaction scores will be presumed to be asso- ciated with products that shipped but were unknown to be defective in one way or another. Implicitly, all customers in Figure 1’s cells 3, 6, and 9 (the top row) and cells 2, 5, and 8 (the middle row) receive products that meet production quality standards. All of these customers would be expected to return satisfactory or high satisfaction ratings. Only the customers in the bot- tom row, cells 1, 4, and 7, would be expected to return unsatisfied ratings. Their products shipped but (unknown to the manufacturer) did not meet the lower specification limits (LSLP’s) for product quality in one or more ways.
In the following sections, we investigate if customers in cells 2 and 3, in addition to those in cell 1, 4, and 7 will also be dissatisfied with the product. They are less prepared than expected to interact with it successfully, although the products they receive are at or above the specified quality standards. If this is the case, some satisfaction ratings received by the manufacturer would be misunderstood. They would be coming from customers (cells 2 and 3) who received good products meeting all quality standards but were still dis- satisfied. We assert that their unexpected dissatisfaction stems from being unprepared, to some degree, to use the product effectively.
METHODOLOGY
The study design considered three (discrete) levels of a product’s quality when delivered to a “customer” (participant) and three (discrete) levels of the par- ticipant’s preparedness (Fig. 1, above). Preparedness and Satisfaction with the product was assessed with questionnaires designed for this project. Assem- bly time and assembly error types were recorded for each assembly session. The protocol was approved by the San José State University Human Subjects Research - Institutional Review Board (IRB) prior to collecting any data.
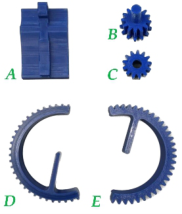
The Product Kits A small, plastic cell phone stand (link in References) was adopted as the prod- uct for this study (Fig. 2). The stand is comprised of five parts (Fig. 3) which were 3D printed for this experiment. Printed build instructions and the 5 com- ponents were assembled into a container (Kit), and one Kit was the “product” for this study. We established preparedness with a questionnaire focusing on prior experience with product assemblies.
Figure 2: Assembled stand.
The Customer’s Preparedness and Product Quality: Impacts on Customer Satisfaction 133
Figure 3: 3D printed stand components.
To create 3 levels of Kit quality, we built Kits to represent products that Exceeded Specifications, Met Specification, and were Below Specifications. Table 1 clarifies how each quality level differed from the others. While the parts in each Kit at each level were “assemble-able”, the Below Specs Kits had one piece that did not fit too easily and one piece that was a different color than the others. The Below Specs product also had only one sticky tape dot to hold the two curved pieces together (the spec is for 2 tape dots per package). Some pieces had quite a bit of the 3D printing production residue on them which had to be removed by hand as the assembly proceeded.
Table 1. Features of each quality level.
Table available in the original PDF paper.
Factors Varied in Kit Contents
Instructions Extra pcs
Residue on pieces
Stand Stability with
# of Colors
# Pieces that Fit
Product Quality Level
Exceeds Spec No Glue 1 5/5 High quality Yes (2) Meets spec Yes 2 Tape Dots 1 5/5 Medium quality No Below Spec Yes 1 Tape Dot 2 4/5 Medium quality No
High quality product had 2 extra pieces (for spares, if needed). They also had a very detailed instruction insert, showing step by step instructions with explanatory text.
The Preparedness Questionnaire This questionnaire aimed to address participant’s readiness, familiarity, and comfort levels in carrying out hands-on assembly tasks. Through a set of 7 questions with 5-point Likert scale responses that were developed for this study, participants provided insights into their confidence and experiences with various types of final product assembly tasks such as puzzles, furniture, and electronics. They also reported on their enjoyment of assembly tasks and comfort with using hand tools (although not required for the experimen- tal assembly task). One question, asked after the task had been completed asked if the participant had assembled similar products in their past. Impor- tantly, the nature of the assembly task remained undisclosed during this phase to ensure unbiased responses. Scores were summed across the 8 items linearly and converted to a 100-point scale representing each participant’s Preparedness.
The Satisfaction Questionnaire This questionnaire, consisting of 6 items, was developed to assess the par- ticipant’s overall satisfaction with the “product”. In addition, the survey covered the participant’s first impressions, instructions, assembly experience, and confidence in the functionality of the finished product. The questionnaire also inquired if the participant would recommend the item to a friend. Six item responses were scored on a scale of 1 to 5 according to the question, with 7 being the high side of the scale. Scores were summed across the six items linearly and converted to a 100-point scale representing each participant’s Satisfaction.
Procedure Each of the 103 participants performed the experiment as an individual in a controlled environment that was in a setting having minimal external sounds or activity. There were no group data collection sessions. Subjects were not required to participate by any external organization or program.
At the beginning of their session, the participant was provided an expla- nation of the study requirements and expectations. They then reviewed and signed the Consent to participate. Next, the participant completed a brief Demographics Questionnaire asking only about Gender and Age. Finally, before the experimental portion of the session, and before the participants knew what they would be asked to do in detail, they completed the Pre- paredness Questionnaire. Next, they were provided one of the three types of product Kits and asked to complete the assembly as indicated in the enclosed instructions.
The participant’s assembly time, from the time they began to read the instructions until they had completed the assembly, was recorded by obser- vation with the data collected on a paper form. A cell phone app was used as the session timer. If participants were unable to finish the assembly on their own, based on the instructions, they were coached as necessary until they completed the task and their data was included in the analysis.
RESULTS
Data collection sessions were conducted with 103 participants between December 2023 and January 2024. The average Participant ages in each study design cell was 27.6 years (Range: 24.3–38.7). The distribution of genders across the 9 design cells by preparation level is shown in the table below. Two persons stated their gender as Other and are not included in this table.
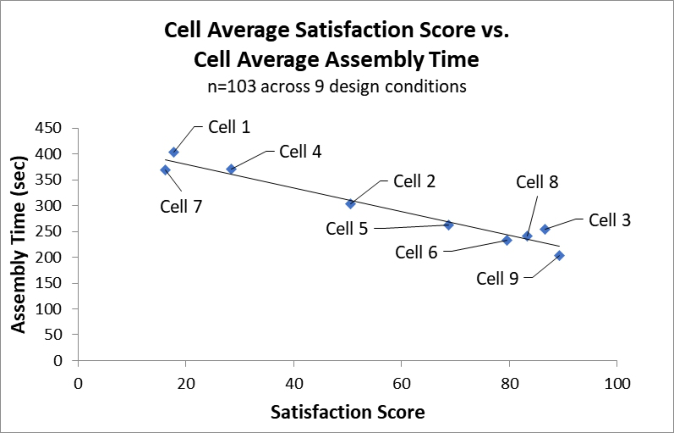
Five types of Errors were recorded if they occurred during the sessions. Overall, 76% of the participants completed the assembly with no errors. About 15% committed one error, 7% committed two errors, and less than 2% committed 3 errors. We investigated the strength of the Satisfaction scores by comparing them to assembly times. The relationship between the average satisfaction scores and the corresponding average assembly times by participants in the 9 design cells is presented in Figure 4.
The Customer’s Preparedness and Product Quality: Impacts on Customer Satisfaction 135
Table 2. Gender populations of each study cell.
Table available in the original PDF paper.
Customer Preparedness Low Prep Expected Prep High Prep
Figure 4: Satisfaction score vs. assembly time for 9 study cells.
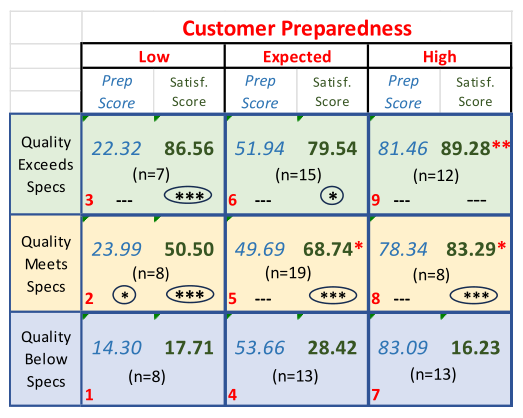
The compiled results for average Preparedness and Average Satisfaction for each design cell is presented in Table 4.
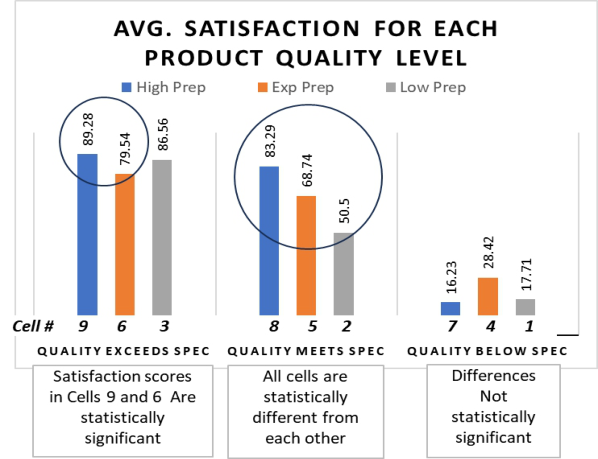
The red asterisks in Table 4 indicate that the Satisfaction score is signifi- cantly greater than the one in the adjacent column on the left. For example, the Satisfaction score in Cell 9, 89.28, is statistically greater than the score in Cell 6, 79.54 (p<0.025). The circled asterisks indicate that the value they are below is significantly greater than the corresponding value in the cell directly below it. For example, the Satisfaction score in cell 3, 86.56 is sig- nificantly greater than the corresponding score in Cell 2, 50.50, (p<0.01). Dashes indicate no vertical significant difference with the value in the cell below.
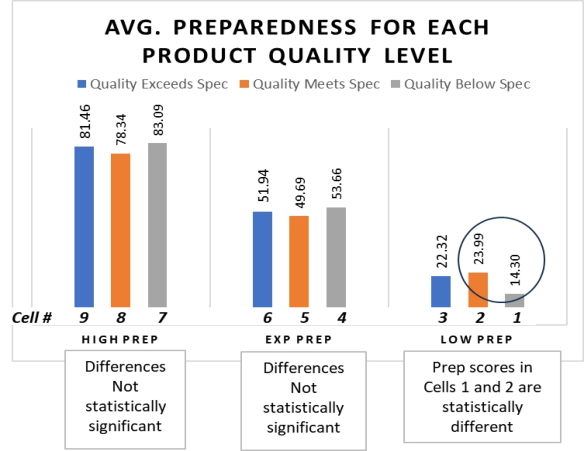
These results are further clarified by the two Figures below. Figure 5 presents the Preparedness results in Table 4 as a bar chart. The Figure clearly indicates that the participants were essentially equally Prepared for each product Quality Type at each Product Quality Level. Only the Low Prep group (circled) had a statistically lower average Prep score for the Below Spec assemblers than the Meets Spec assemblers (p<0.05).
Table 3. Average preparedness and satisfaction scores for each cell.
Figure 6 presents the Satisfaction results in Table 3 as a bar chart. When the Quality exceeds the specification, Satisfaction is generally higher than when Quality meets or is below Spec. However, when Quality meets specs, those in the High Prep group (Cell 8) had significantly higher Satisfaction than those who were in the Expected Prep group (Cell 5). And the Expected Prep group (Cell 5) had higher Satisfaction ratings than the Low Prep group (Cell 2).
Figure 5: Average preparedness scores for each product quality level.
The Customer’s Preparedness and Product Quality: Impacts on Customer Satisfaction 137
Figure 6: Average satisfaction scores for each product quality level.
DISCUSSION
If average Satisfaction target scores of 60–70 (Cell 5) represent the Satis- fied Customer that we are seeking to develop, meeting Specifications only assures this level of expected Satisfaction or greater if the customers are in the Expected or High Preparation groups (Cells 5 and 8). Participants who received product that Met Specifications but who had Low Preparedness averaged statistically lower Satisfaction scores than the target (Cell 2, Sat- isfaction = 50.5). Also, customers who received Below Standards products (Cells 1, 4, and 7) reported equally very low Satisfaction ratings across all 3 levels of Preparedness. High Preparedness cannot be expected to overcome Below Specification products (Cell 7). Finally, we observe that the best way to overcome Low Preparedness and achieve a satisfied customer is to deliver products that Exceed Expectation (Cell 3).
CONCLUSION
This study has shown that customer satisfaction surveys may not only reflect the quality of the service or product the customer received. Customers who receive products or services that meet all design specifications may report dissatisfaction due to their own lack of preparedness to use it as deliv- ered. In addition, the study suggests that delivering products or services that exceed their design Specifications is a sure way to achieve higher than expected customer satisfaction. The study confirms that customer satisfaction is strongly related to customer preparedness. Future research should be con- ducted to explore the interpretation of satisfaction surveys, especially when presented to customers who are under prepared for the product or service. The influence of expectations should also be considered.
REFERENCES
Cell Phone Stand link: https://cults3d.com/en/3d-model/gadget/tilt-phone-stand. Chase, R. B. and B. M. Stewart (1994) “Make Your Service Fail-Safe”, Sloan Management Review, Spring, pp. 35–44. Darlin, D. (2009) “Software That Monitors Your Work, Wherever You Are”. The
New York Times, April 11th, 2009. Fitzsimmons, J. A. and Fitzsimmons, M. J. (2008) Service Management, Operations, Strategy, Information Technology. 6th ed. MGraw-Hill. Haskett, J. L., W. Earl Sasser, Jr. and Leonard A. Schlesinger (1997) The Service Profit
Chain. The Free Press, New York. Montgomery, D. C. (2001) Introduction to Statistical Process Control. 4th ed., John Wiley & Sons. O’Connell, V. (2008) “Stores Count Seconds to Trim Labor Costs”. The Wall Street
Journal, November 13th, 2008. Maynard, M. (2009) “Worried About Losing Tax Revenue, Congress to Investigate Airlines’ Fees”, The New York Times, November 13th, 2009. Parasuraman, A., V. A. Zeithamal, and L. L Berry (1985) “A Conceptual Model
of Service Quality and Its Implications for Future Research”, The Journal of Marketing, Vol. 49, No. 4, Autumn, pp. 41–50. Parasuraman, A., V. A. Zeithaml, and L. L. Berry (1998) “SERVQUAL: A Multi- Item Scale or Measuring Consumer Perceptions of Service Quality,” Journal of Retailing, Vol. 64, No. 1, Spring, pp. 12–40. Parasuraman, A., V. A. Zeithmal, A. Malhotra, (2005) “E-S-Qual - A Multiple-Item
Scale for Assessing Electronic Service Quality”, Journal of Service Research, Vol. 7, No. 3, February, pp. 213–233. Schneider, B. (1980) “The Service Organization: Climate is Crucial”, Organizational Dynamics, Autumn, p. 62. Schneider, B. and S. White (2004) Service Quality, Research Perspectives. Sage
Publications.
LISTED IN THE AHFE DIGITAL BOOKSTORE CATALOGUE
Explore the complete digital volume
The Human Side of Service Engineering
Read this individual research paper free through the original publisher, or explore the full digital proceedings book.
ISBN 978-1-964867-19-9
Explore this ISBN in the AHFE Bookstore ↗Listed in the July 2026 bookstore catalogue; search by ISBN to confirm current availability · Digital book purchase optional