Daisuke Tamaki, Hisaya Tanaka (2025). Epileptic Seizure Detection from EEG Data Using the Active Threshold Method. In: Human Factors in Design, Engineering, and Computing. AHFE Open Access, vol. 199, pp. 1721–1729. https://doi.org/10.54941/ahfe1006983
Epilepsy, defined by the WHO as a "chronic brain disease," affects approximately 0.8-1.0% of the world's population, with an estimated 1 million patients in Japan.While advances in machine learning and deep learning have improved the accuracy of epilepsy detection in recent years, high computational costs limit real-time processing. In this study, we investigated the feasibility of applying the Active Threshold (AT) method, developed for real-time voluntary eye movement detection using electrooculography (EOG), to epilepsy detection. The AT method calculates the root mean square (RMS) value from biosignals and multiplies it by an arbitrary parameter, α, to determine the threshold. This method has the advantages of real-time processing and easy calibration.In this study, we applied the AT method to electroencephalogram (EEG) data, including epileptic seizures, released by Boston Children's Hospital to verify whether an appropriate threshold could be derived. In particular, we performed a detailed analysis of the effect of changes in the α value on epilepsy detection accuracy. We selected the records of subject CHB-01 from the dataset and used preprocessed data totaling 7 hours, including epileptic symptoms. The α value was varied from 7 to 10, and the RMS calculation time was fixed at 30 seconds. In the detection evaluation, detections within the range of the epileptic seizure duration recorded in the dataset plus the 30-second RMS calculation time were considered positive, and detections outside this range were considered false.As a result, epileptic seizures were detected across all tested α parameters. However, certain seizure events within the seven-hour dataset could not be detected using any of the parameter values. These undetected seizures exhibited gradual EEG amplitude changes without significant potential amplification compared to interictal periods, making them undetectable by the AT method's approach. Additionally, noise-induced artifacts were erroneously classified as seizure events, resulting in false positive detections. Future work will need to incorporate seizure classification algorithms to distinguish genuine epileptic activity from noise artifacts in the detected EEG signals.
The application of bio-signals, including electroencephalogram (EEG), in medical care is advancing. These signals are ideal for monitoring physiological conditions, and with the recent widespread adoption of wearable technology, their utility in personal health management is growing. Beyond assessing concentration and cognitive states, EEG is now a key
diagnostic tool for disorders such as epilepsy and dementia. Epilepsy, as defined by the World Health Organization, is a chronic brain disorder marked by recurrent seizures resulting from sudden, intense electrical excitation of brain nerve cells (neurons) (UCB JAPAN, 2025). The condition affects approximately 0.8%1.0% of the population, with an estimated 1 million patients in Japan (Ministry of Health, Labour and Welfare, Japan, 2025). EEG is one of the most important diagnostic methods for epilepsy, with the detection of epileptic discharges (e.g., spikes, sharp waves, and spike complexes) in interictal EEGs providing diagnostic clues. In hospital environments, continuous monitoring of all patients is not feasible. Consequently, effective early detection systems are critical for optimizing medical personnel allocation and enhancing patient safety. While recent breakthroughs in machine and deep learning have boosted detection accuracy, their high computational costs limit real-time processing (Ein Shoka et al., 2023). Furthermore, although training customized machine learning models can enhance accuracy, it requires specialized knowledge and frequent adjustments, which contributes to poor usability. A survey by the Japan Rehabilitation Engineering Society illustrates this problem, revealing that approximately 42% of patients required device replacement due to changes in residual function. The survey found an average replacement frequency of 1.6 times, with a maximum of 7 times for some individuals. This report also highlights the need for regular interface adjustments or even interface replacement (Rehabilitation Engineering Society of Japan, 2009). To address these limitations, we propose the dynamic threshold (Active Threshold [AT]) method, which was originally developed for real-time detection of electrooculography (EOG) signals (Tamaki and Tanaka, 2017; Tamaki et al., 2019). In the current study, we applied the AT method to recorded epileptic seizure data to assess its potential for epilepsy detection and to determine whether a reliable threshold could be established.
METHODOLOGY
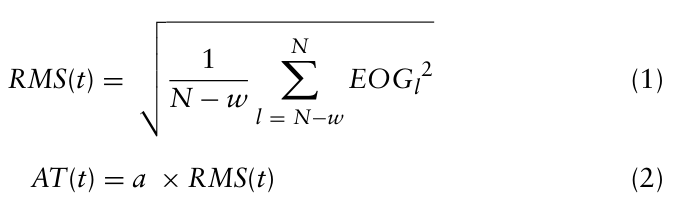
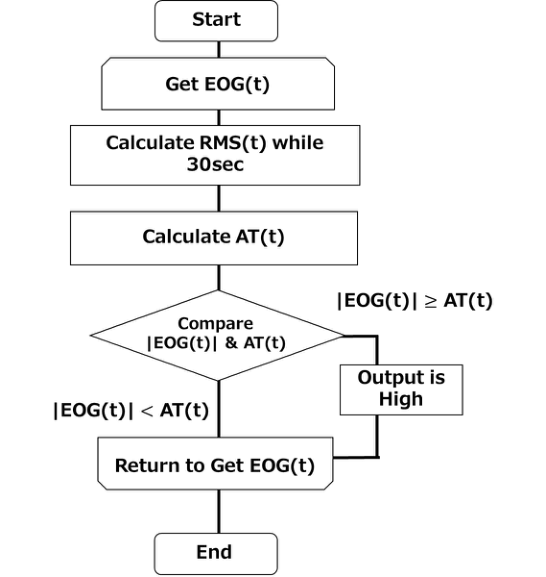
We proposed the AT method, which dynamically calculates the threshold using the root mean square (RMS), an effective metric derived from the EOG signal. RMS is computed by squaring each value and then taking the square root of the average of the squared values. It can measure the strength of the EOG signal per unit time. Therefore, we think that this characteristic makes RMS ideal for deriving a threshold that is applicable to the strength of the EOG between individuals. The AT method derives its threshold in a three-step process. First, the RMS, which represents the effective metric of the signal, is computed from the obtained EOG data, as shown in equation (1). Here, t denotes the current position, N is the total number of data, and l is defined as N minus the movement width w. RMS indicates the intensity per unit time of alternating current signals. The AT method then derives the threshold value (AT) by multiplying the calculated RMS by a constant parameter a, as shown in equation (2). The threshold is thus determined using equation (2). The AT method determines the presence of voluntary action if the absolute value of the EOG exceeds this threshold value in equation (3). The overall process and a detailed flowchart of the AT method are illustrated in Figure 1.
Epileptic Seizure Detection From EEG Data Using the Active Threshold Method 1723
N X RMS(t) =
2 (1)
EOGl
Equation reproduced from the original PDF.
EOG(t)
≥AT(t)
Output Low · · ·
EOG(t)
< AT(t)
Figure 1: AT method flowchart.
CHB-MIT SCALP EEG DATABASE The CHB-MIT Scalp EEG Database, a collaborative effort between Boston Children’s Hospital and the Massachusetts Institute of Technology, has become a standard benchmark for epileptic seizure detection research (Guttag, 2010). This comprehensive dataset consists of long-term scalp EEG recordings from 22 pediatric patients (1.5-22 years old) with intractable epilepsy. In total, the dataset contains 664 EDF files, of which 129 files contain recordings of 198 epileptic seizures. The data were sampled at
1724 Tamaki and Tanaka
256 Hz, with electrode placement based on the International 1020 system. Each file contains approximately 1–4 hours of continuous recording. Given its broad adoption as an international standard, the CHB-MIT database serves as a key benchmark for the development and evaluation of automated epileptic seizure detection algorithms, particularly those based on machine learning and deep learning.
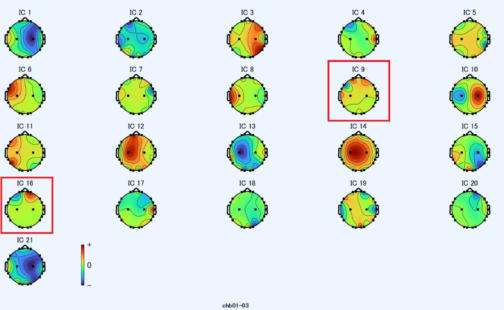
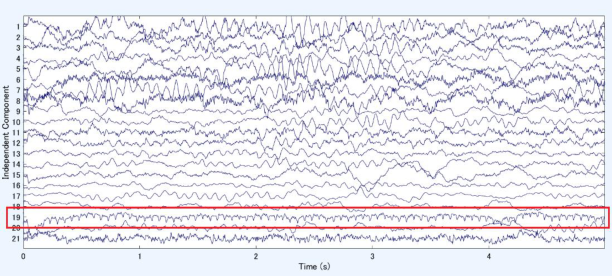
SIMULATION PROCEDURE For this study, we utilized a 7-hour segment of preprocessed data from subject CHB-01, which contained periods with epileptic symptoms. The following preprocessing steps were applied (Table 1). First, a 1–100 Hz bandpass filter was applied. Next, a notch filter was applied to eliminate 60 Hz power line noise. Finally, independent component analysis (ICA) was performed to remove components identified as electrooculogram (EOG) artifacts near the eyes and electrocardiogram (ECG) components showing regular cardiac activity. Representative examples of the removed components are provided in Figures 2 and 3. Figure 2 illustrates the analysis results in two-dimensional space, where IC9 and IC16 represent removed components identified as electrooculogram artifacts. Figure 3 shows the analysis results in a time-series format, with the vertical axis representing the component amplitude and the horizontal axis representing time (seconds). IC19 was removed as an ECG component. The a parameter was varied from 7 to 10, while the RMS calculation window was held constant at 30 seconds. The range of the a parameter was selected based on prior studies. In previous research, a range of 2.5-5 was used for resting electrooculogram analysis. In the present study, a range of 7–10 was selected for application to EEG signals, which exhibit larger amplitude fluctuations. An a = 7 was found to increase sensitivity at the cost of more false positives, whereas a = 10 decreased sensitivity while improving specificity. For the detection evaluation, any detection within the manually annotated seizure period was classified as a true positive. We quantified detection latency as the time delay between seizure onset and the algorithm detection. A tolerance window of ±30 seconds was applied around the manually annotated seizure boundaries to accommodate the RMS calculation delay and to account for potential inter- rater variability in determining seizure onset. To identify factors needed for accuracy improvement, we analyzed false positives that occurred both within and outside the designated detection periods.
Table 1: Preprocessing steps.
Table available in the original PDF paper.
Pre-Process
1. Bandpass filter (1-100 Hz) 2. Notch filter (60 Hz) 3. Removal of EOG and ECC using ICA
Epileptic Seizure Detection From EEG Data Using the Active Threshold Method 1725
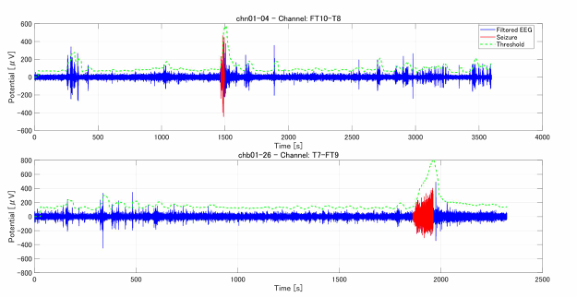
Table 2 presents a parameter-dataset matrix listing the electrodes where seizures were detected for each α value. Although detection was achieved for every parameter value, not all datasets yielded detections across all parameter combinations. False positives were present in every combination shown in Table 2. The majority of detected electrodes were located in the temporal and frontal lobes, which correspond to typical onset regions for pediatric epilepsy (Nickels et al., 2012). Notably, the T7-FT9 electrode pair was detected at all a values for dataset chb01-26, suggesting that this region may represent the primary seizure focus. Figure 4 illustrates the EEG signals and their corresponding thresholds for electrode pairs FT10-T8 (chb01-04) and T7-FT9 (chb01-26). The EEG signal is shown by the blue line, while the threshold derived by the AT method is represented by the green line. The red sections indicate the time intervals during which seizures were annotated in the dataset. Detection events occur where the blue line crosses above the green threshold line, demonstrating that appropriate thresholds can be effectively derived from EEG signals using the AT method. Nevertheless,
1726 Tamaki and Tanaka
some datasets did not show any detections, irrespective of parameter settings. In these instances, potential seizure activity was often observed before or after the annotated detection windows, with detections occurring in regions not labeled as epileptic in the original dataset annotations. This highlights a need to reconsider the definition and boundaries of the detection windows. False positives were also observed in spike-like artifacts that resembled noise rather than true epileptic activity. In addition to refining detection windows, as discussed above, future work will need to incorporate waveform classification algorithms to distinguish genuine epileptic discharges from artifacts.
Table 2: Detection results for each α parameter with a 30-second RMS window.
Figure 4: EEG signals and corresponding thresholds derived using the AT method for electrode pairs FT10-T8 (chb01-04) and T7-FT9 (chb01-26).
DISCUSSION: CONSIDERATION: DETECTION WHEN CHANGINGTHE RMS CALCULATION TIME The results previously discussed were derived from an RMS calculation performed over a 30-second period. However, the AT method offers
Epileptic Seizure Detection From EEG Data Using the Active Threshold Method 1727
flexibility in this interval, a factor that could influence detection outcomes. Consequently, we explored the effects of a 60-second RMS calculation window. We maintained the same α parameter (7-10) to compare the results with the 30 second window. The findings, presented in Table 3, indicate that with a 60 second RMS window, detection was successful in all datasets when a = 7. Furthermore, the total number of detected electrodes increased compared to when the RMS was calculated over 30 seconds. Since the AT method calculates its threshold directly from the EEG signal, it is subject to signal fluctuations. Sudden signal fluctuations immediately before a target can elevate the threshold, leading to missed detections. We found that the 60 second window, by extending the RMS calculation interval, helped to absorb some of these signal fluctuations and somewhat suppress the threshold increase, thereby allowing us to detect waveforms that would have been missed with the shorter 30-second window. Despite this improvement, false positives continued to occur, suggesting that the RMS calculation interval cannot effectively suppress them. Therefore, to enhance the accuracy of epilepsy detection using the AT method, it is crucial to incorporate a mechanism for determining whether detected waveforms represent genuine epileptic activity.
Table 3: Detection results for each parameter (RMS: 60s).
Table available in the original PDF paper.
Parameter F8-T8 FP1-F7, F8-T8, FT9-FT10
a = 7 a = 8 a = 9 a = 10 Dataset chb01-03 FP1-F7, FP2-F8, F8-T8, FT9-FT10 F8-T8, FT10-T8 FT10-T8 FT10-T8 chb01-04 FP1-F7, FP2-F4, F8-T8, FT10-T8
This study applied the AT method to EEG data to investigate its efficacy for epilepsy detection. Our findings indicate that successful detection was achieved across multiple datasets when the RMS window was set to 60 seconds with an a parameter of 7. An examination of the detected channels revealed that many were concentrated in the temporal and frontal lobe regions, consistent with the typical onset zones pediatric epilepsy. Nevertheless, a significant number of false positives were also observed. Consequently, future efforts will need to incorporate methods for classifying detected waveforms to distinguish between genuine epileptic activity and artifacts.
ACKNOWLEDGMENT
I am deeply grateful to all members of our laboratory for their insightful advice, constructive feedback, and continuous support throughout this research. This work was supported by JSPS KAKENHI Grant Number JP22K12913.
REFERENCES
Ein Shoka, A. A., Dessouky, M. M., El-Sayed, A., & Hemdan, E. E.-D. (2023). EEG seizure detection: concepts, techniques, challenges, and future trends. Multimedia Tools and Applications, 82, 42021–42051. https://doi.org/10.1007/s11042–023- 15052–2. Guttag, J. (2010). CHB-MIT scalp EEG database (version 1.0.0). PhysioNet. https://
doi.org/10.13026/C2K01R. Ministry of Health, Labour and Welfare, Japan. (2025). Epilepsy measures. Retrieved from https://www.mhlw.go.jp/stf/seisakunitsuite/bunya/ 0000070789_00008.html. Nickels, K. C., Wong-Kisiel, L. C., Moseley, B. D., & Wirrell, E. C. (2012). Temporal lobe epilepsy in children. Epilepsy Research and Treatment, 2012, 849540. https:// doi.org/10.1155/2012/849540. Rehabilitation Engineering Society of Japan. (2009). Analysis of user needs survey
on the use of communication devices Support system required for daily device use from the perspective of user needs (Report of Investigation and Research Project on Matching User Needs and Provided Functions for Ensuring the Continued Use of Communication Devices for Severely Disabled Persons). Ministry of Health, Labor and Welfare in Japan. Tamaki, D., & Tanaka, H. (2017). EOG analysis algorithm for biological switched.
In Human Interface 2017 (6D2–2). Human Interface Society.
Epileptic Seizure Detection From EEG Data Using the Active Threshold Method 1729
Tamaki, D., Fujimori, H., & Tanaka, H. (2019). An interface using electrooculography with closed eyes. In Proceedings of the 5th International Symposium on Affective Science and Engineering. Japan Society of Kansei Engineering. https://doi.org/10.5057/isase.2019-C000030. UCB JAPAN Co., Ltd. (2025). About epilepsy: What is epilepsy. Retrieved from https://www.tenkan.info/about/epilepsy/.
LISTED IN THE AHFE DIGITAL BOOKSTORE CATALOGUE
Explore the complete digital volume
Human Factors in Design, Engineering, and Computing
Read this individual research paper free through the original publisher, or explore the full digital proceedings book.
ISBN 978-1-964867-75-5
Explore this ISBN in the AHFE Bookstore ↗Listed in the July 2026 bookstore catalogue; search by ISBN to confirm current availability · Digital book purchase optional