Sodai Kondo, Hisaya Tanaka (2023). Improvement of the Accuracy of SSVEP-BCI with In-Ear EEG Using Multiple Regression Analysis. In: Neuroergonomics and Cognitive Engineering. AHFE Open Access, vol. 102, pp. 264–273. https://doi.org/10.54941/ahfe1003953
A brain-computer interface (BCI) is an interface that reads brain activity and operates a computer. Typically, BCI involves wearing a device on the head to measure brain waves. EEG meters are cumbersome for the user when worn and require individuality techniques to reduce impedance. In-Ear EEG, which is obtained from electrodes placed near the inner and outer ear, is expected to solve these problems. Users can use it to have a comfortable BCI experience. However, in-Ear EEG has the problem that the EEG used for BCI uses EEG located far from the actively observable areas of the brain, which results in poor signal quality. Steady state visual evoked potential (SSVEP) is an EEG that is predominantly observed in the primary visual cortex in the occipital region during gazing at a flashing stimulus, and SSVEP-BCI is expected to be used as a new communication tool. Ear EEG will greatly advance the social implementation of SSVEP-BCI. In this study, electrodes were placed at 10 locations near the ear and 4 locations on the back of the head. SSVEP-BCI with 28 different inputs including alphabets was designed and evaluated. The accuracy of the SSVEP-BCI with signals obtained from the occipital region was 84.92%, and that of the BCI with signals obtained from the ear was 28.17%. Using the occipital and intra-ear EEG data sets as the teacher data, multiple regression analysis was performed to improve the accuracy, and an accuracy of 55.83% was achieved. These results indicate that improvements are needed to make in-Ear EEG based SSVEP-BCI practical. It also suggests that a communication tool using in-Ear EEG based SSVEP-BCI may be feasible in the future.
Wearable electroencephalogram (EEG) measurement devices are expected to be used in everyday healthcare. An in-ear EEG obtained near the ear is well-suited for wearable devices, and study focusing on in-ear EEG is pro- gressing (Kidmose et al. 2013; Guermandi et al. 2018; Sun et al. 2022; Goverdovsky et al. 2016; Ahn et al. al. 2018). Brain-computer interface (BCI) is an interface that connects humans and computers (Vidal, 1973). SSVEP-BCI, using steady state visual evoked potential (SSVEP), is an excellent tool for character input (Chen et al. 2014). Because SSVEP is predominan- tly evoked in the human occipital primary visual cortex (Lotte et al. 2018), it is hypothesized that the SSVEP component in the in-ear EEG is attenu- ated. SSVEP is a high-signal-to-noise response in the primary visual cortex upon fixing a blinking stimulus (Lotte et al. 2018), containing double and triple harmonics (Zhu et al. 2010). A wide evoked band of 1–75 Hz has been identified (Herrmann, 2001). Using EEG data obtained from the scalp near the primary visual cortex, a previous study proposed an SSVEP-BCI with 50 input options (Kondo and Tanaka, 2022). There is also an SSVEP-BCI that utilizes an ultrawide monitor to obtain 160 inputs (Chen et al. 2021). Thus, it is not difficult to realize a multivalued input in conventional SSVEP-BCI
Improvement of the Accuracy of SSVEP-BCI With In-Ear EEG 265
that collects head EEG data. This is because SSVEP can be clearly distin- guished from background noise components in head EEG data. In a previous study that constructed SSVEP-BCI using in-ear EEG, which is farther from the primary visual cortex than conventional measurement positions and whose SSVEP components are attenuated, the number of inputs was limited to 3–6 value classification. (Sun et al. 2022; Zhu et al. 2021; Kwak and Lee, 2020; Ahn at el. 2018). The 3–6 value classification has a low degree of freedom as a BCI. This study focused on improving the number of inputs and accu- racy of SSVEP-BCI using in-ear EEG. The goal was to achieve the same level of accuracy as SSVEP-BCI, which uses head EEG data for comparison and training data.
THEORY Flashing Stimulus Design
When controlling multiple inputs with SSVEP, each flickering stimulus used to induce SSVEP is often assigned a unique flickering frequency (Kondo and Tanaka, 2022). Light emitting diode, liquid crystal display (LCD) are mainly used for stimulus presentation screens. In particular, LCDs, which are inex- pensive and easy to implement, are used in this study. The limited refresh rate is one thing to keep in mind when using an LCD. The problem is that when only simple on/off blinking stimuli are used, the types of blinking stimulus frequencies that can be presented on the LCD are limited to only submultiples of the LCD’s refresh rate. This problem was solved by sinusoidally control- ling the brightness of the blinking stimulus (Chen et al. 2014). Following a previous study, the blinking stimulus was designed in this study according to Eq. (1):
n
io
Stim
Equations and mathematical formulas are available in the original paper PDF.
1 + sin h
n, fi
R
where fi is the stimulation frequency, R is the LCD refresh rate, and n is the frame number.
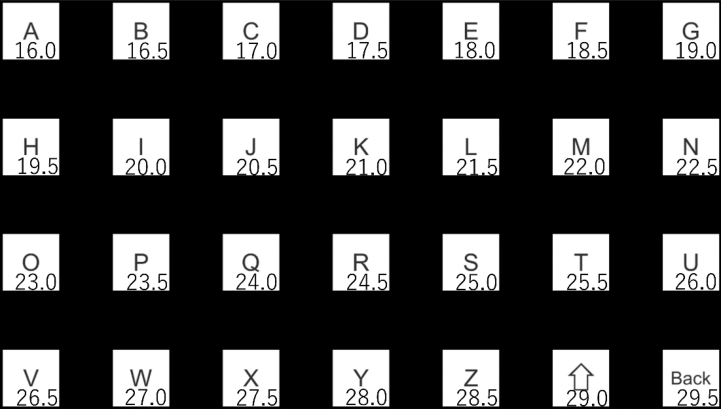
The maximum SSVEP component is generally around 10 Hz, and the SSVEP component attenuates as the stimulus frequency increases (Herrman, 2001). In this study, a stimulus frequency band of 16.0–29.5Hz (0.5 Hz step) was used according to Eq. (1). Since this band is close to 10 Hz, the SSVEP component is large. Moreover, by using a frequency band slightly higher than 10 Hz, the subject’s stress caused by flickering stimulation is reduced (Kondo and Tanaka, 2023). Since this study conducts experiments with a larger num- ber of inputs than the conventional SSVEP-BCI with in-ear EEG, a frequency band was selected to maintain the subject’s concentration. Figure 1 shows a blinking stimulus screen with 28 stimulus frequencies 16.0–29.5 Hz assigned based on Eq. (1). Inside each target is an A–Z alphabet, a capital letter, and a delete button. The number displayed on the lower right of the target is the sti- mulation frequency assigned to each target. This number was not displayed during the experiment.
266 Kondo and Tanaka
Figure 1: Flashing stimulus display. (The numbers in square are stimulus frequencies).
Canonical Correlation Analysis Canonical correlation analysis (CCA) is one of the analysis methods fre- quently used in SSVEP-BCI. It is a statistical method for integrating inputs from multiple information sources and for determining linear transformation parameters so as to maximize the number of correlations between linearly transformed values of multiple data sets (Akaho, 2013). In SSVEP-BCI, data y is defined by Eq. (2): where x is EEG data measured using an EEG device, y is a reference frequency signal to be compared, and fi indicates the frequency number.
For example, f1 is the reference frequency signal for the 16 Hz stimu- lus. fs is the sampling rate, T is the time series and the number of sample points, and j is used to accommodate the harmonic components of 2 and 3 times the stimulus frequency (Chen et al. 2014). When the time series of data x, y is t = 1, 2, . . . , T, the combination of data is expressed as
x1, y1
x2, y2
, . . . , (xT, yT). For simplicity, the sample mean of x, y is assumed to be 0. Considering the values u(x), v(y) obtained by linearly transforming x, y respectively, Eq. (3) is obtained:
a, b in Eq. (3) are the parameters to be obtained in CCA. The correlation coefficients for these values are given by dividing the covariance by their respective standard deviations. Furthermore, when the average of x, y is set
Improvement of the Accuracy of SSVEP-BCI With In-Ear EEG 267
to 0 in advance, it follows Eq. (4):
xyT
ρ
a, b
q
b q
h
h
aTE
a
bTE
b
xxT
yyT
E
E
u (x)2ir
E[f(x)] represents the sample mean. In this study, the correlation between u and v columns is defined as a sample canonical correlation vector r. Let C be the sum of r. Since C is calculated for each stimulus frequency, the sum C of sample canonical correlation vectors r for each stimulus frequency is expressed as Ci in the same way as fi in Eqs. (1) and (2). It is presumed that the subject gazed at the blinking stimulus with the maximum stimulus frequency at CC1−−28 and the output was determined.
Multiple Regression Analysis The SSVEP component in the in-ear EEG is attenuated compared with the occipital head EEG data. Therefore, it is difficult for conventional CCA and in-ear EEG data to achieve the same performance as conventional CCA and head EEG data. In this study, to improve the accuracy of SSVEP-BCI with in-ear EEG, an analysis algorithm was applied using multiple regression analysis (MRA), with the head EEG data as training data. MRA is an algo- rithm for predicting one target variable with multiple explanatory variables. In this study, CCA was performed on head EEG data and in-ear EEG data. The results were processed by MRA to predict the CCA result C of in-ear EEG data from head EEG data. In a certain input target, the model for pre- dicting the CCA result Ci using the head EEG data is presented in Eq. (5) with the CCA result earC1−−28 of the in-ear EEG data. reCi is a value output by a model constructed using Ci and earCi, and it is estimated that reCi was gazing at the blinking stimulus with the maximum stimulus frequency. N is the number of input options, i.e., 28 in this study.
EXPERIMENT SSVEP-BCI System
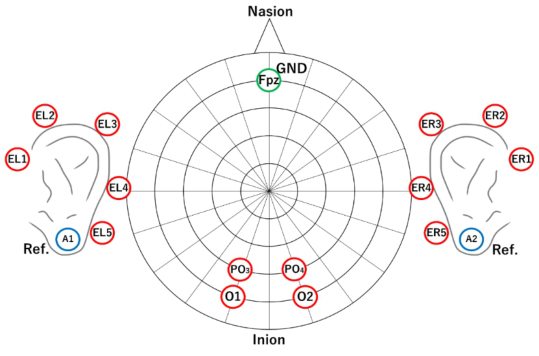
When a single or multiple flickering stimuli are presented and the subject gazes at one of the options, the frequency component equivalent to the unique stimulus frequency increases in the occipital primary visual cortex. Figure 1 shows the stimulus screen presented in this study, and the experimen- ter instructed the subject on which blinking stimulus to focus on. The subject gazed at the stimulus according to the instructions, and the state of brain activity at that time was recorded with an electroencephalograph EEG1000 (1 kHz) manufactured by Nihon Koden. The electrodes used for the measu- rement consisted of 17 channels in total, including 4 channels on the back of the head, 5 channels on the left and right near the ears, 1 channel on
268 Kondo and Tanaka
Figure 2: Measurement area.
the GND, and 2 channels on the reference. Figure 2 shows the measurement sites.
Subjects wore the EEG1000 and fixed their viewpoint at a position 50 cm from the flashing stimulus display (Z-EDGE 27-inch full HD). The stimulus shown in Figure 1 was rendered on a 27-inch display with a resolution of 1920 × 1080 pixels. Therefore, the size of the blinking stimulus was 150 pixels and 5.55 cm square. The vertical and horizontal intervals between the blinking stimuli are 156×141 pixels and 5.77×5.22 cm. This is the result of designing the screen to ensure an interval as close as possible to the size of the flickering stimulus to suppress the effects of the adjacent flickering stimuli. The visual angle of the blinking stimulus is 3.35 degrees.
Measurements As instructed by the experimenter, the subject gazes at the blinking stimulus. One measurement time is 5 s. As shown in Figure 1, three measurements are performed for each blinking stimulus, resulting in 84 trials per subject. Three measurements are performed for one flickering stimulus to calculate the accu- racy and measure the training data used for constructing the MRA model. In order to measure the calibration data used to build the MRA model, the same size measurements were taken before the measurement production. This study was conducted on nine people aged 20–23 from Kogakuin University. This experiment was conducted based on “Psychological and biometric mea- surement for humans at Kogakuin University 2022-R1-17.”In addition, prior explanation, and written consent were obtained from the subjects. In parti- cular, it was explained that the blinking stimulus presented to induce SSVEP may cause discomfort and poor physical condition and that the experiment could be stopped at any time by the subject’s will.
Improvement of the Accuracy of SSVEP-BCI With In-Ear EEG 269
RESULT
Accuracy
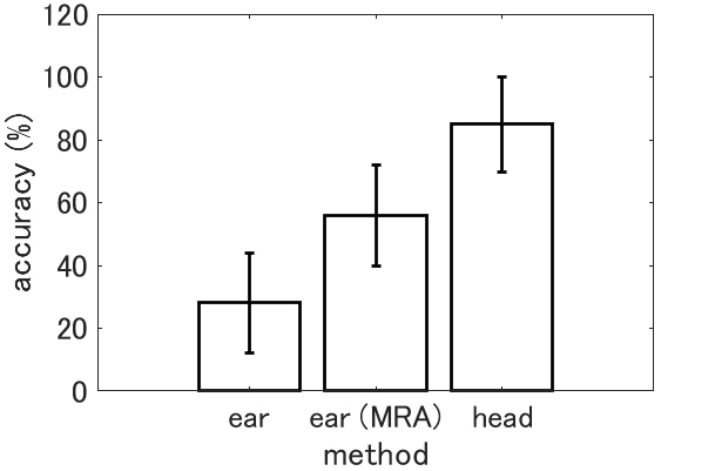
Figure 3 shows the results of in-ear EEG data analysis by CCA (ear), in-ear EEG data analysis results of MRA performed after CCA (ear (MRA)), and head EEG data analysis results by CCA (head). It also shows the accuracy and standard error of each method. As a result of the analysis, when the blinking stimulus estimated by SSVEP-BCI matched the blinking stimulus the subject gazed at, it was treated as a correct answer and counted as the number of correct answers a. Letting the number of trials be k, and using the number of correct answers a among them, the input accuracy P is given by Eq. (6).
k (6) The accuracy of each method was 28.17% for ear, 55.83% for ear (MRA), and 84.92% for head. Table 1 presents the accuracy of each method and subject to compare the accuracy of each method by subject.
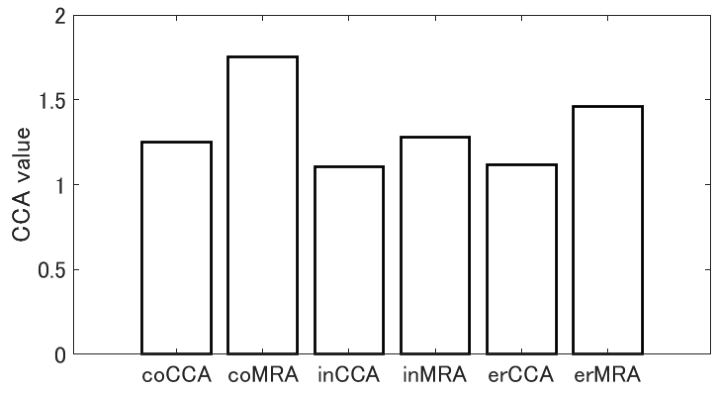
SSVEP Components for Correct and Incorrect Answers If the SSVEP-BCI did not perform the expected action, that is, if the blinking stimulus estimated by the SSVEP-BCI did not match the blinking stimulus that the subject gazed at, it would be an incorrect answer. At this time, the SSVEP component of the blinking stimulus that the subject does not gaze at is superior to the SSVEP component of the blinking stimulus that the subject gazes at. Figure 4 shows the magnitude relationship between the target SSVEP component when the answer is correct, the target SSVEP component when
Figure 3: Accuracy by analysis method.
270 Kondo and Tanaka
Table 1. Subject-specific accuracies and differences between head CCA and MRA.
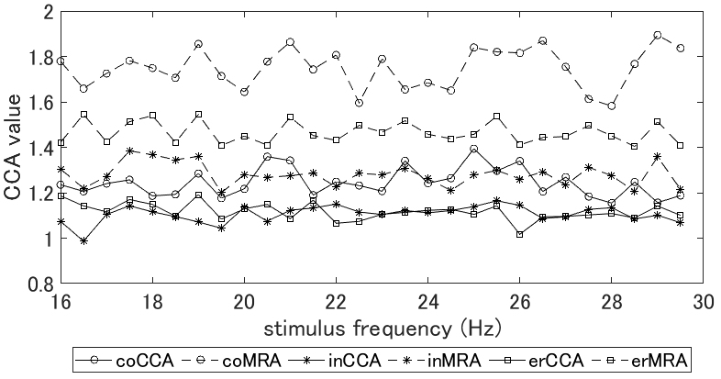
Figure 4: SSVEP components for correct and incorrect answers (coCCA: target SSVEP component for the correct answer (CCA); coMRA: target SSVEP component for the correct answer (MRA); inCCA: target SSVEP component for the incorrect answer (CCA); inMRA: target SSVEP component for the incorrect answer (MRA); erCCA: maximum SSVEP component at the incorrect anwer (CCA); erMRA: maximum SSVEP component at the incorrect answer (MRA)).
the answer is incorrect, and the SSVEP component of the blinking stimulus whose analysis result shows the maximum value when the answer is incor- rect. Figure 5 shows the analysis of the magnitude relationship between the SSVEP components for each condition shown in Figure 4 by stimulus frequ- ency. Figure 5 also shows the target SSVEP component at the correct answer, the target SSVEP component at the incorrect answer, and the SSVEP com- ponent of the blinking stimulus whose analysis result showed the maximum value at the incorrect answer.
Improvement of the Accuracy of SSVEP-BCI With In-Ear EEG 271
Figure 5: SSVEP components for correct and incorrect answers by frequency (coCCA: target SSVEP component for the correct answer (CCA); coMRA: target SSVEP compo- nent for the correct answer (MRA); inCCA: target SSVEP component for the incorrect answer (CCA); inMRA: target SSVEP component for the incorrect answer (MRA); erCCA: maximum SSVEP component at the incorrect answer (CCA); erMRA: maximum SSVEP component at the incorrect answer (MRA)).
DISCUSSION
Performance Comparison of SSVEP-BCI As shown in Figure 3, the accuracy of SSVEP-BCI using in-ear EEG and CCA and using MRA was 28.17% and 55.83%, respectively. The performance difference between the two methods was 27.66% and 1.98 times, indicating that SSVEP-BCI using MRA achieved higher accuracy than SSVEP-BCI using in-ear EEG and CCA. However, the accuracy using head EEG in Figure 3 was 84.92%, and the performance difference with SSVEP-BCI using MRA was 29.09% and 1.52 times. Therefore, the goal of this study, i.e., to realize SSVEP-BCI with in-ear EEG with the same accuracy as SSVEP-BCI with head EEG data, could not be achieved. To solve the problem that the SSVEP com- ponent is attenuated more in the vicinity of the ears than in the back of the head, MRA was applied, and a performance improvement of 27.66% was achieved. In addition to that, we aim to improve performance by comparing CCA with task-related component analysis (TRCA).
Indicators to Prevent Misjudgment Tt is necessary for the SSVEP-BCI designer to grasp the expected value of the SSVEP component for each blinking stimulus to effectively use SSVEP-BCI by MRA proposed in this study. As shown in In Figure 4, only one coMRA value exceeds 1.5. Both the target blinking stimulus at the time of misjudgment and the blinking stimulus showing the maximum value were below 1.5. In other words, it can be asserted that the SSVEP component was unequivocally indu- ced when the MRA value exceeds 1.5. It is suggested that misjudgment may
272 Kondo and Tanaka
be reduced by setting a threshold for the MRA analysis result and outputting it in this way.
However, as described in “flashing stimulus design,” the magnitude relati- onship of the SSVEP component changes depending on the flashing stimulus frequency. Moreover, its peak exists around 10 Hz, and SSVEP decreases with increasing frequency (Herrmann, 2001). Therefore, a threshold for redu- cing erroneous determination should also be examined for each frequency. As shown in Figure 5, the magnitude relationship between the frequency and the correct/incorrect SSVEP components changes with each frequency, but diffe- rences can be confirmed for each condition. Comparing the target SSVEP component at the correct answer indicated by coMRA and the blinking sti- mulus SSVEP component showing the maximum value at the wrong decision indicated by erMRA, it can be seen that there is a boundary line near 1.6. Since this is a plot of mean values for all subjects and all trials, the presence of outliers must be considered. However, this study discriminates between cases in which the SSVEP component increased when the subject gazed at the blinking stimulus, cases in which the SSVEP component did not incre- ase when the subject gazed at the blinking stimulus, and cases in which the SSVEP component increased when the subject did not gaze at the blinking stimulus. There is a possibility that it can be done. In this study, one subject performed three measurements for one type of stimulus; thus, not enough data was collected to determine the threshold. The future, study will aim to improve the performance by collecting enough data to determine the thresh- old value of the SSVEP component for each subject and stimulus frequency and by introducing a reduction in misjudgment by setting the threshold value.
CONCLUSION
As study of wearable BCI progresses, applications using EEG data near the ear have been proposed. SSVEP-BCI, which is a multi-value input, high-speed, high-precision BCI, is conventionally used by attaching electrodes near the primary visual cortex of the occipital region. In a previous study aimed at transplanting SSVEP-BCI to BCI as a wearable device, there was only SSVEP-BCI with a maximum number of inputs of eight values. This is as the SSVEP component decreased because the measurement site moved near the ear instead of the back of the head, making it difficult to classify the input options. This study proposed an analysis algorithm using CCA and MRA to realize multilevel input of SSVEP-BCI using in-ear EEG with the same accu- racy as conventional occipital EEG-based SSVEP-BCI. The accuracy of CCA performed with ear EEG was 28.17%, the accuracy of CCA performed with occipital EEG was 84.92%, and accuracy through the analysis method using the MRA model constructed from the results of CCA using occipital EEG and ear EEG was 55.83%. This suggests that MRA can improve the perfor- mance of SSVEP-BCI using ear EEG. The goal of this study is to achieve the same level of accuracy with in-ear EEG as with head EEG; however, this was not achieved. To improve the accuracy in the future, setting SSVEP compo- nent thresholds will be considered for each method and stimulation frequency
Improvement of the Accuracy of SSVEP-BCI With In-Ear EEG 273
as shown in Figures 4 and 5. This is expected to have the effect of preven- ting misjudgments when the SSVEP component of the target frequency is not clearly induced for some reason, and prompting remeasurement. From the results of this study, although there is a problem in achieving both multi- value input and accuracy in SSVEP-BCI using in-ear EEG, future performance improvement is expected.
REFERENCES
Ahn, J. W.et al. (2018), Wearable in-the-ear EEG system for SSVEP-based braincomputer interface, Electronics Letters, 54(7), pp. 413–414. Akaho, S. (2013), Introduction to Canonical Correlation Analysis - Mutual
Information Extraction from Multimodal Observations-, Societas Neurologica Japonica, Vol. 20, No. 2, pp. 62–72. Chen, X. et al. (2014), A high-ITR SSVEP-based BCI speller, Brain-Computer Interfaces, 1(3-4), pp. 181–191. Chen, X. et al. (2014), Hybrid frequency and phase coding for a high-speed
SSVEP-based BCI speller, In 2014 36th Annual International Conference of the IEEE Engineering in Medicine and Biology Society, pp. 3993–3996. Chen, Y. et al. (2021), Implementing a calibration-free SSVEP-based BCI system with 160 targets, Journal of Neural Engineering, 18(4), p. 046094. Goverdovsky, V. et al. (2015), In-ear EEG from visco elastic generic earpieces: robust
and unobtrusive 24/7 monitoring, IEEE Sensors Journal, 16(1), pp. 271–277. Guermandi, M. et al. (2018), A wearable device for minimally-invasive behind-theear eeg and evoked potentials, In 2018 IEEE Biomedical Circuits and Systems Conference (BioCAS), pp. 1–4. Herrmann, C. S. (2001), Human EEG responses to 1–100 Hz flicker: resonance phe-
nomena in visual cortex and their potential correlation to cognitive phenomena, Experimental Brain Research, 137(3-4), pp. 346–353. Kidmose, P. et al. (2013), A study of evoked potentials from ear-EEG, IEEE Transactions on Biomedical Engineering, 60(10), pp. 2824–2830. Kondo, S. and Tanaka, H. (2022), The SSVEP-BCI for fifty-Hiragana Characters,
Proceeding of the Human Interface Society Human Interface Symposium 2022, 1T-P5, pp. 138–144. Kondo, S. and Tanaka, H. (2023), Development of SSVEP-BCI with Less Flickering Sensation, Proceeding of AROB-ISBC-SWARM 2023, OS13-1, pp. 1277–1282. Kwak, N. S., & Lee, S. W. (2019), Error correction regression framework for
enhancing the decoding accuracies of ear-EEG brain–computer interfaces, IEEE Transactions on Cybernetics, 50(8), pp. 3654–3667. Lotte, F. et al. (2018), A review of classification algorithms for EEG-based brain– computer interfaces: a 10 year update, Journal of Neural Engineering, 15(3), p. 031005. Sun, Y. et al. (2022), Cross-subject fusion based on time-weighting canonical
correlation analysis in SSVEP-BCIs, Measurement, 199, 111524. Vidal, J. J. (1973), Toward direct brain-computer communication, Annual Review of Biophysics and Bioengineering, 2(1), pp. 157–180. Zhu, D. et al. (2010), A survey of stimulation methods used in SSVEP-based BCIs,
Computational Intelligence and Neuroscience, 2010, p. 702357. Zhu, Y. et al. (2021), EEG Net with ensemble learning to improve the crosssession classification of SSVEP based BCI from ear-EEG, IEEE Access, 9, pp. 15295–15303.
LISTED IN THE AHFE DIGITAL BOOKSTORE CATALOGUE
Explore the complete digital volume
Neuroergonomics and Cognitive Engineering
Read this individual research paper free through the original publisher, or explore the full digital proceedings book.
ISBN 978-1-958651-78-0
Explore this ISBN in the AHFE Bookstore ↗Listed in the July 2026 bookstore catalogue; search by ISBN to confirm current availability · Digital book purchase optional