Yan Zhao, Xiaonan Yang, Yahui Wang, Wanni Wei, Heng Zuo, Yuan Yu (2023). EEG assessment of driving cognitive distraction caused by central control information. In: Neuroergonomics and Cognitive Engineering. AHFE Open Access, vol. 102, pp. 113–121. https://doi.org/10.54941/ahfe1003011
This study collected EEG data using a driving simulator and analyzed it using the average spectral power density of EEG features to study the assessment method of cognitive distraction in driving caused by central control information. The results showed that Theta, Beta1 and Beta2 brain waves in the frontal lobe and central region could reflect the driver's cognitive load and cognitive processes. As cognitive difficulty increases, Theta and Beta2 brain waves in the frontal lobe and central region gradually calm down, and Beta1 becomes more active. By recording the driver's EEG signals and analyzing changes in brain waves, the impact of in-vehicle central control system de-sign on driver cognitive distraction can be evaluated. This EEG-based evaluation method can provide a more objective and accurate assessment, providing a scientific basis for optimizing and improving the design.
Driving is a complex task that requires high levels of attention and cogni- tive processing. However, with the development of automotive technology and demand, more and more cars are equipped with central control systems. While central control systems can alleviate cognitive fatigue to some extent, they can also cause cognitive distraction because of the complexity of central control information. Cognitive distraction is a type of distraction in driving (Pettitt et al., 2005; Greenberg et al., 2003; Lee et al., 2013; Regan et al., 2011), which refers to the driver’s inability to drive safely or delayed reaction time due to thinking about other issues. When drivers experience cognitive distraction, it increases the risk of accidents to some extent (Klauer et al., 2006). In particular, cognitive distraction caused by central control informa- tion has been identified as an important factor in causing traffic accidents (Sabey and Staughton, 1975).
To address cognitive distraction while driving, researchers have been exploring various ways to measure and assess cognitive workload. After lite- rature review, the use of electroencephalogram (EEG) data to assess cognitive load is a feasible method (Chin-Teng et al., 2008; Lin et al., 2011; Wang et al., 2010). EEG signals can intuitively reflect the physiological activity of the brain, thereby further reflecting the psychological perceptual activity of the individual (He et al., 2010; Kannan et al., 2017; Wai et al., 2018). By analy- zing EEG data, researchers can identify patterns of brain activity associated with different levels of cognitive workload (Wester et al., 2008).
At present, the application of EEG research results in the field of traffic driving behavior is relatively limited, mainly focusing on traffic safety. In the field of intelligent transportation, the development of vehicle driver assista- nce systems mainly revolves around monitoring the driver’s driving status (Tian-Hong, 2007; Wang et al., 2013). In traffic flow theory, some explora- tory studies have begun to incorporate the physiological and psychological perception of drivers during dynamic driving as parameters into traffic flow models (Tang et al., 2012).
In this paper, an effective driving cognitive distraction assessment method based on EEG data is proposed, and the EEG research results are applied to the field of traffic driving behavior, which can provide reliable and objective cognitive workload measurement, which can be used to evaluate the impact of different types of distractions on driving performance, and provide help for the establishment of relevant traffic models including driver perception.
METHOD
Participants The study involved 30 participants with an average age of 33.40 years and a standard deviation of 6.47. All participants had a naked-eye or corrected visual acuity of 4.9 or higher on the logarithmic visual acuity chart. Those with monocular visual impairment had a naked-eye or corrected visual acuity of 5.0 or higher on the logarithmic visual acuity chart in their better eye, with a horizontal visual field of at least 150 degrees. None of the participants engaged in fatigued driving, drunk driving, or were under the influence of drugs during the experiment.
The collected data was divided into two groups based on the difference in experimental purposes. The first data group consisted of subjects 1 to 20 and was used to determine the threshold of distracted driving evaluation indica- tors. The second data group consisted of subjects 21 to 30 and was used to verify the usability of the distracted driving model when using touch-based smart products.
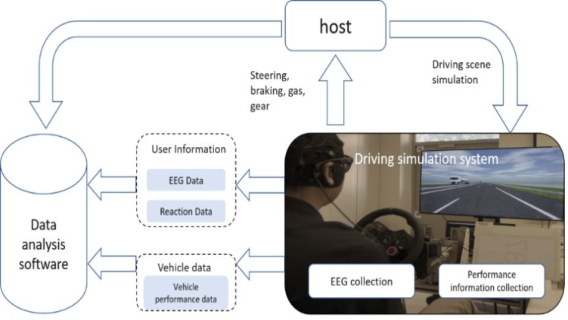
Experimental Equipment The driving simulation system includes a driving simulator, an environmen- tal simulator, and a Huawei tablet as the experimental display device. The Logitech G29 is used to connect the driving simulator to the computer, and
EEG Assessment of Driving Cognitive Distraction 115
the SCANeR studio software is used to model the experimental road envi- ronment. The tablet is placed in a fixed position within the driver’s visible range as a car-mounted touch screen for the experiment. The seat height and screen position are set according to the distance of the actual car. The road scene includes various road landscapes such as lane markings, traffic signs, and greenery, as shown in Fig. 1.
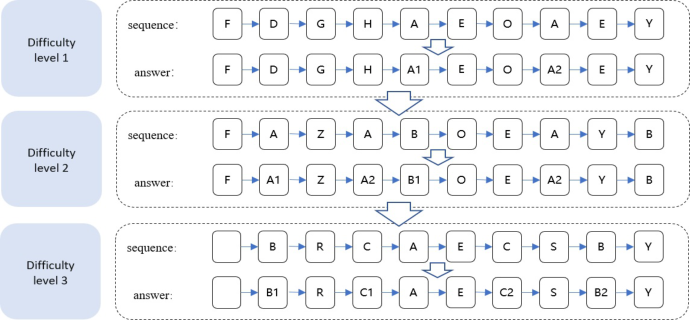
Task and Procedure Task We cognitive distraction task refers to the scenario where different letters are displayed on the central control screen of the car during the driving process. After the target sound stimulus appears, the subject needs to say the tar- get sound and its occurrence frequency. The instruction release interval is 3 seconds, and the target sound accounts for 30% of the total stimuli. During the entire experiment, the subject does not need to focus their gaze on the central control screen. The experiment is divided into difficulty levels 1, 2, and 3 based on the number of target sounds. In difficulty level 1, the target sound is A; in difficulty level 2, the target sound is A/B; and in difficulty level 3, the target sound is A/B/C. Examples of the three difficulty levels of the cognitive distraction task are shown in Fig. 2.
Procedure The driving simulation experiment consists of three parts: experimental pre- paration, subject driver training, and formal experiment, with a total time of about 1 hour. In the experimental preparation stage, the subject signs an informed consent form, and basic information is collected and equipment functions are confirmed. The subject driver undergoes about 10 minutes of simulated driving operation training. The formal experiment includes cogni- tive task experiment, with the experimental order evenly distributed. To avoid the influence of the experimental order on the data, the subject driver needs to
Figure 2: Examples of Three Levels of Difficulty in Cognitive Distractor Tasks.
maintain a focused driving state and complete the control experiment before the formal experiment.
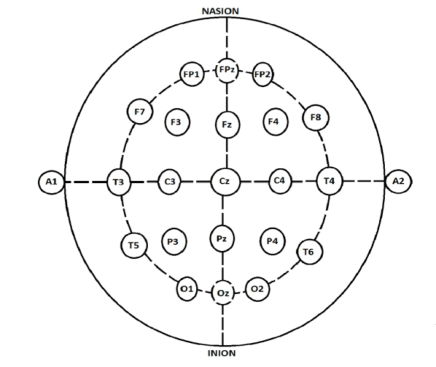
Data Analysis Firstly, preprocessing of the EEG signal is performed before EEG signal analy- sis, which involves processing the raw EEG signal to remove noise, artifacts, and other interference, and improve the quality and reliability of the EEG signal. Extract the power spectral density of Delta, Theta, Alpha, Beta1, Beta2, and Gamma for each EEG electrode channel. Divide the 18 EEG ele- ctrodes into 6 regions: Fp1, Fp2 (Frontal pole), F3, F4, F7, F8 (Frontal), T3, T4, T5, T6 (Temporal), O1, O2 (Occipital), C3, C4 (Central), P3, P4 (Parietal), as shown in Fig. 3. Calculate the mean power spectral density for each type of brain wave within each region. Use repeated measures analy- sis of variance (ANOVA) to investigate the effect of increasing task difficulty and resulting cognitive distraction on regional brain waves. Mauchly’s test is used to test the sphericity assumption of repeated measures ANOVA.
Result
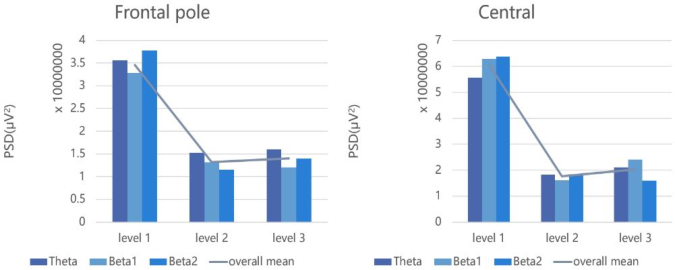
The power spectral density of the EEG signal was divided into 36 groups of data based on the six regions and six frequency bands corresponding to the EEG electrodes. ANOVA was performed on the cognitive distraction experi- ment data of 30 participants under three difficulty levels. The results showed significant differences in the experimental data corresponding to the Theta, Beta1, and Beta2 brain waves in the Frontal Pole and Central regions. as shown in Table 1.
Experiment Data A one-way ANOVA was first conducted to confirm that differences in difficulty levels would have an effect on these metrics. If an effect was determined, the LSD method was used to further determine the extent to which the different levels of subtasks affected the metrics. The results of
EEG Assessment of Driving Cognitive Distraction 117
Delta Theta Alpha Beta1 Beta2 Gamma Frontal pole P = 0.64 P = 0.01 P = 0.31 P = 0.02 P = 0.007 P = 0.52 Frontal P = 0.33 P = 0.21 P = 0.161 P = 0.44 P = 0.37 P = 0.104 Temporal P = 0.41 P = 0.14 P = 0.54 P = 0.305 P = 0.69 P = 0.13 Occipital P = 0.55 P = 0.36 P = 0.37 P = 0.402 P = 0.236 P = 0.64 Central P = 0.498 P = 0.008 P = 0.731 P = 0.022 P = 0.005 P = 0.511 Parietal P = 0.107 P = 0.35 P = 0.454 P = 0.313 P = 0.507 P = 0.359
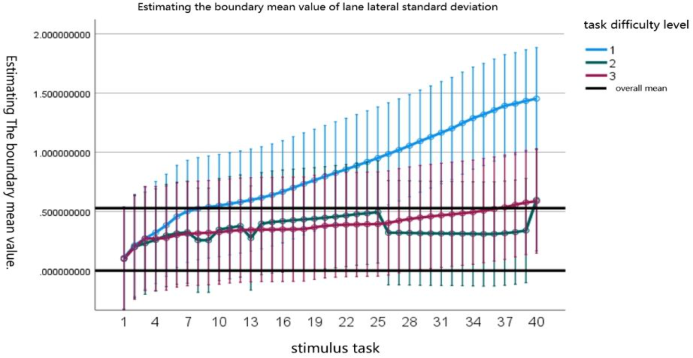
the one-way ANOVA revealed a significant difference in the standard devi- ation of lane lateral excursion by different levels of the cognitive distraction task (p = 0.007<0.05). A post hoc test using the LSD method obtained that there was a significant difference between difficulty one and three (P = 0.002<0.05), a significant difference between difficulty one and two (P = 0.005<0.05), and no significant difference between difficulty two and three (P = 0.454>0.05), as shown in Fig. 4.
EEG Data A one-way ANOVA was first conducted to confirm that differences in dif- ficulty levels of the cognitive distraction experiment would have an effect on the power spectral density of Theta, Beta1, and Beta2 waves in diffe- rent brain regions. If an effect was determined, the LSD method was used to further determine the extent to which the different levels of subtasks affe- cted the metrics. The results of the one-way ANOVA revealed a significant difference in the standard deviation of the power spectral density of Theta, Beta1, and Beta2 waves in the frontal polar region by different levels of the cognitive distraction task (P = 0.01<0.05, P = 0.02<0.05, P = 0.007<0.05). The post hoc test using the LSD method for power spectral density stan- dard deviation found that there was a significant difference between difficulty one and two (P = 0.02<0.05), a significant difference between difficulty one
Figure 4: Estimating the boundary mean value of lane lateral excursion.
and three (P = 0.005<0.05), and no significant difference between difficulty two and three (P = 0.628>0.05). The different levels of cognitive distraction also had a significant effect on the power spectral density of Theta, Beta1, and Beta2 waves in the central region (P = 0.008<0.05, P = 0.022<0.05, P = 0.005<0.05). The post hoc test using the LSD method for power spe- ctral density standard deviation found that there was a significant difference between difficulty one and two (P = 0.013<0.05), a significant difference between difficulty one and two(P = 0.008<0.05), and no significant dif- ference between difficulty two and three (P = 0.574>0.05), as shown in Fig. 5.
Figure 5: Average power spectral density of frontal and central regions.
Discussion
This study investigated the effects of cognitive distraction task difficulty on the power spectral density of six brain regions and six frequency bands in EEG signals. The results showed that as task difficulty increased, there were significant differences in the power spectral density of Theta, Beta1, and Beta2 brain waves in the frontal polar and central regions, while there
EEG Assessment of Driving Cognitive Distraction 119
were no significant differences in other regions. Previous EEG studies have shown that the frontal polar and central regions play important roles in many cognitive tasks, and Theta, Beta1, and Beta2 power spectral density exhibit different patterns of change in different cognitive tasks. However, the lack of significant changes in other regions may be due to different brain regions pla- ying different roles in different cognitive tasks. The cognitive distraction task used in this study did not involve cognitive processes controlled by other regi- ons. In addition, there were significant differences between task difficulty one and two, and task difficulty one and three, but no difference between task difficulty two and three. Comparing the behavioral data, this was mainly because the difficulty of task three was set too high, and in order to maintain the normal progress of the main driving task, the participants actively gave up the cognitive distraction subtask, resulting in the cognitive distraction level of task three being relatively stable or slightly increased compared to task two. Therefore, in order to more comprehensively understand the characteristics of EEG signals and the neural mechanisms of cognitive processes, further research is needed to investigate the patterns of EEG wave changes in other regions during different cognitive tasks.
CONCLUSION
According to the research results, the Theta, Beta1, and Beta2 brainwaves in the frontal and central regions can reflect the driver’s cognitive load and cognitive processes. This finding has significant implications for evaluating the impact of in-vehicle infotainment system design on driver cognitive distra- ction. Therefore, in the evaluation of in-vehicle infotainment system design on driver cognitive distraction, electroencephalogram (EEG) recording and analysis can be used to assess the impact of the design on the driver’s cognitive load and cognitive processes.
Specifically, by recording the driver’s EEG signals and analyzing the chan- ges in Theta, Beta1, and Beta2 brainwaves in the frontal and central regions, the impact of the design on the driver’s cognitive load and cognitive proces- ses can be evaluated. In addition, driver feedback and behavioral data can be combined to comprehensively evaluate the impact of the design on driver cognitive distraction. This EEG-based evaluation method can provide more objective and accurate assessment of the impact of in-vehicle infotainment system design on driver cognitive distraction, and provide scientific evidence for optimizing and improving the design.
ACKNOWLEDGEMENT
The authors would like to thank the National Natural Science Foundation (52205513) and Foundation Strengthening Project (2021-JCJQ-JJ-1042). We express our sincere gratitude to Changan Automobile Co., Ltd for the data collection.
REFERENCES
A. A. P. Wai, H. Dajiang, and N. S. Huat, “IoT-enabled multimodal sensing head wear system,” in 2018 IEEE 4th World Forumon Internet of Things (WF-IoT), 5–8 Feb. 2018 2018, pp. 286–290, doi:10.1109/WF-IoT.2018.8355103. A. E. Wester, K. B. E. Böcker, E. R. Volkerts, J. C. Verster, and J. L. Kenemans,
“Event-related potentials and secondary task performance during simulated dri- ving,” Accident Analysis & Prevention, vol. 40, no. 1, pp. 1–7, 2008/01/01/ 2008, doi: https://doi.org/10.1016/j.aap.2007.02.014. B. E. Sabey and G. C. Staughton, “INTERACTING ROLES OF ROAD ENVIRON- MENT VEHICLE AND ROAD USER IN ACCIDENTS,” 1975. C. T. Lin, S. A. Chen, L. W. Ko, and Y. K. Wang, “EEG-based brain dynamics of driving distraction,” in The 2011 International Joint Confere- nce on Neural Networks, 31 July-5 Aug. 2011 2011, pp. 1497–1500, doi: 10.1109/IJCNN.2011.6033401. J. Greenberg et al., “Driver Distraction: Evaluation with Event Detection Paradigm,”
Transportation Research Record, vol. 1843, no. 1, pp. 1–9, 2003/01/01 2003, doi: 10.3141/1843-01. J. Wang, L. Zhang, D. Zhang, and K. Li, “An Adaptive Longitudinal Driving Assistance System Based on Driver Characteristics,” IEEE Transacti- ons on Intelligent Transportation Systems, vol. 14, no. 1, pp. 1–12, 2013, doi:10.1109/TITS.2012.2205143. L. Chin-Teng et al., “Distraction-related EEG dynamics in virtual rea- lity driving simulation,” in 2008 IEEE International Symposium on Circuits and Systems (ISCAS), 18–21 May 20082008, pp. 1088–1091, doi: 10.1109/ISCAS.2008.4541611. M. A. Regan, C. Hallett, and C. P. Gordon, “Driver distraction and driver inatten-
tion: Definition, relationship and taxonomy,” Accident Analysis & Prevention, vol. 43, no. 5, pp. 1771–1781, 2011/09/01/ 2011, doi: https://doi.org/10.1016/j. aap.2011.04.008. M. Pettitt, G. Burnett, and A. Stevens, “Defining Driver Distraction,” Intelligent Transportation Society of America-12th World Congress on Intelligent Transport Systems 2005, vol. 5, 01/01 2009. R. Kannan, S. S. A. Ali, A. Farah, S. H. Adil, and A. Khan, “Smart Wearable EEG
Sensor,” Procedia Computer Science, vol. 105, pp. 138–143, 2017/01/01/ 2017, doi: https://doi.org/10.1016/j.procs.2017.01.193. S. He, W. Guan, and L. Song, “Explaining traffic patterns at on-ramp vicinity by a driver perception model in the framework of three-phase traffic theory,” Phy- sica A: Statistical Mechanics and its Applications, vol. 389, no. 4, pp. 825–836, 2010/02/15/2010, doi: https://doi.org/10.1016/j.physa.2009.10.014. S. Klauer, T. Dingus, T. Neale, J. Sudweeks, and D. Ramsey, “The Impact of
Driver Inattention on Near-Crash/Crash Risk: An Analysis Using the 100-Car Naturalistic Driving Study Data,” vol. 594, 01/012006. T. Tang, C. Li, H. Huang, and H. Shang, “A new fundamental diagram theory with the individual difference of the driver’s perceptionability,” Nonlinear Dyna- mics, vol. 67, no. 3, pp. 2255–2265, 2012/02/01 2012, doi: 10.1007/s11071-011 -0143-y. V. K. Lee, C. R. Champagne, and L. H. Francescutti, “Fatal distraction: cell phone
use while driving,” (in eng), Can Fam Physician, vol. 59, no. 7, pp. 723–5, Jul 2013. Y. K. Wang, N. R. Pal, C. T. Lin, and S. A. Chen, “Analyzing effect of distraction caused by dual-tasks on sharing of brain resources using SOM,” in The 2010
EEG Assessment of Driving Cognitive Distraction 121
International Joint Conference on Neural Networks (IJCNN), 18–23 July 2010 2010, pp. 1–6, doi:10.1109/IJCNN.2010.5596860. Y. Tian-hong, “Review on the Research of Intelligent Vehicle Safety Driving Assistant Technology,” Journal of Highway and Transportation Research and Development, 2007.
LISTED IN THE AHFE DIGITAL BOOKSTORE CATALOGUE
Explore the complete digital volume
Neuroergonomics and Cognitive Engineering
Read this individual research paper free through the original publisher, or explore the full digital proceedings book.
ISBN 978-1-958651-78-0
Explore this ISBN in the AHFE Bookstore ↗Listed in the July 2026 bookstore catalogue; search by ISBN to confirm current availability · Digital book purchase optional