Wuweidan Duolikun, Binjue Wang, Xiaonan Yang, Hongwei Niu, Xuanzhu Wan, Qing Xue, Yan Zhao (2023). Effect of Secondary Tasks in Touchscreen In-Vehicle Information System Operation on Driving Distraction. In: Human Factors in Transportation. AHFE Open Access, vol. 95, pp. 36–46. https://doi.org/10.54941/ahfe1003790
With the rapid development of the automotive industry and the advancement of mobile communication technology, In-Vehicle Information System shifted from traditional button to touchscreen. However, while enriching the drivers' driving experience, there are also certain potential driving distractions when operating touchscreen IVIS during the driving process. This study takes the operation of touchscreen IVIS by the driver as the secondary driving task, and designs a simulated driving experiment to explore the im-pact of the operation of secondary tasks on driving safety from driving performance, secondary task performance and EEG. Research has shown that low load operation tasks can easily cause drivers to be distracted, while high load operation tasks can affect drivers' judgment ability and occupy too much action resources. And when the difficulty level increases, drivers develop a compensation mechanism to complete secondary tasks through self-regulation.
In recent years, with the transformation of the automotive industry and the development of intelligence, increasingly intelligent connected vehicles have emerged in the public’s view and their demand is showing a growing trend (McKinsey). In order to quickly respond to market demand, car enterprises have increased their research and development efforts on the key aspect of In-Vehicle Information System (IVIS) in intelligent connected vehicles (Kim et al., 2016), aiming to improve the driver experience and Intellectualiza- tion the basic functions of the car. Therefore, IVIS is increasingly developing towards complexity and large screens, and is transitioning from traditional button based IVIS to touch screen based IVIS. However, while enriching the drivers’ driving experience, interactive touchscreen IVIS poses certain driving distraction.
Effect of Secondary Tasks in Touchscreen In-Vehicle Information System Operation 37
Touchscreen IVIS blindly reduces mechanical buttons and integrates but- ton functions into various menus in the interactive interface, which also increases the complexity of driver operations and leads to driving distra- ction. When using touchscreen IVIS, a large number of touch controls are required, such as radio frequency modulation, navigation settings, and music playback (Gupte and Askhedkar, 2018, Marinkov et al., 2022), which can distract drivers and lead to traffic accidents (Zahabi, 2017). According to official media reports, in 2017, more than 3 million traffic accidents occur- red due to driver distraction, accounting for almost half of the total traffic accidents. Among them, 36% of traffic accidents were caused by drivers acti- vely operating secondary tasks (Kenneth et al., 2008), and distraction caused by operating secondary tasks has become an important cause of traffic safety accidents. Therefore, it is urgent to study the effect of secondary tasks in touchscreen IVIS operation on Driving distraction.
At present, the indicators of driving safety mainly focus on driving per- formance, secondary task performance and EEG signal. In terms of driving performance indicators, they mainly include steering rate, steering angle speed, lateral vehicle movement, lane lateral deviation standard deviation, longitudinal acceleration standard deviation, and other indicators (Kim and Yang, 2018, Tarabay and AbouZeid, 2018a). In terms of secondary task performance indicators, secondary task response time and secondary task accuracy are widely used, and the use of IVIS can reduce the drivers’ response ability (Yan et al., 2015). In terms of EEG indicators, they are commonly used to analyze driving safety issues (Chung et al., 2001), and they are found that as the difficulty of driving tasks increases β enhanced wave activity, α weakened wave activity (Smith et al., 2001).
Therefore, in order to make car enterprises pay attention to the importance of touchscreen IVIS interaction design while meeting user needs, this paper focuses on the effect of touchscreen IVIS operation on driving distraction. Firstly, design a simulation experiment on the difficulty of three driving ope- rations under touch interaction state. Secondly, process and analyze data on driving performance indicators, reaction indicators, and EEG signal indica- tors. Finally, the relationship between the difficulty of touch interaction tasks and the driver’s driving behavior was obtained. This study aims to improve the safety and convenience of touchscreen IVIS, while also providing develo- pment direction for car enterprises in presenting and designing information on touchscreen IVIS, and helping them have more competitive advantages in the market.
Method
Participant 30 participants aged between 23 and 60 were recruited from the surrounding com-munity, including 7 females and 23 males, as shown in the Table 1. All participants are in good physical condition, have sufficient sleep, and need to wash their hair before the experiment to ensure that their scalp and hair are dry before starting the experiment.
Table 1. Age distribution and proportion of subjects.
Table available in the original PDF paper.
age distribution number proportion 20-29 11 36.67% 30–39 14 46.67% 40–49 4 13.33% over 50 1 3.33%
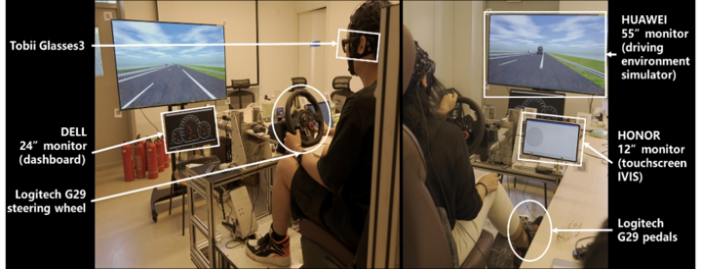
Figure 1: Experiment apparatus.
Apparatus and Driving Environment This thesis uses a simulated driving experiment, and the equipment of the experiment is divided into two parts, which are the driving simulation system and the data acquisition system, as shown in Figure 1. The main equipment of the driving simulation system consists of a Logitech G29 steering wheel and foot pedals, a HUAWEI 55′′ monitor, a Dell 24′′ monitor, and an HONOR 12′′ Android pad. The data acquisition system is mainly divided into colle- cting driving performance data and EEG signal data. And the experimental scenario is a two-way four lane fully enclosed road simulated using SCANeR Studio 2021, with a flat road surface and clear weather.
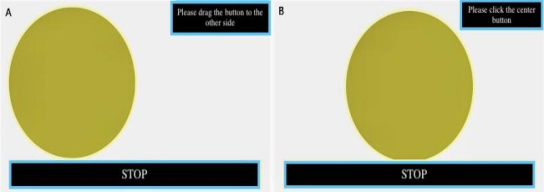
Experimental Design A typical dual-task design was chosen for the experiment type. The primary task was a simulated driving task, which required the driver to drive in a straight line in the right lane on a city road and to control the speed at 40- 60km/h to perform a normal following driving task. The secondary task is the operating task, which requires the driver to perform corresponding gestu- res (drag / click) on the touchscreen IVIS according to voice instructions, as shown in Figure 2. During the driver’s driving process, the touchscreen IVIS of the car issued specific instructions, namely “Please drag the button to the other side” and “Please click the central button”, and the subjects completed the task according to the instructions. The task was divided into three diffi- culty levels, from easy to difficult, as shown in Table 2, and the total duration of the experiment was 6 minutes.
Effect of Secondary Tasks in Touchscreen In-Vehicle Information System Operation 39
Procedure The experimental process includes three parts: experimental preparation, training stage, and formal experiment, with the specific steps as follows.
Experimental preparation. Introduce the purpose and content of the experiment to the participants, and wear relevant experimental equipment.
Training stage. Participants are trained to familiarize themselves with experimental tasks and equipment.
Formal experiment. The subjects completed the secondary task while dri- ving at a speed of 40–60 km/h. Among them, take a 1-minute break between tasks at different difficulty levels.
Dependent Variables The dependent variables in this study can be divided into driving perfor- mance, secondary task performance and EEG signals. Driving performance indicators are divided into horizontal and vertical: horizontal indicators are the standard deviation of vehicle lateral position (SDLP) and steering wheel angle standard deviation (SASTD) (average, standard deviation, 95% con- fidence interval). The SDLP and SASTD reflect the driver’s lane-keeping ability and visually represent the driver’s ability to maneuver the vehicle late- rally. Vertical indicators are the standard deviation of acceleration (ASTD) (average, standard deviation, 95% confidence interval). The ASTD is the parameter that most directly reflects the state of the vehicle movement and is closely related to driving efficiency and safety. The two secondary task per- formance indicators were secondary task reaction and secondary task correct rate. Secondary task response time is the period between a stimulus’s presen- tation and a reaction’s onset. The secondary task correct rate is the degree to which the driver is correct in completing the secondary task and reflects.
They reflect the speed of the driver’s reaction to a secondary task scenario and how well the driver reacts to the operational task. The EEG signal indicators were beta and theta. They are often used as indicators to identify distracted and fatigued drivers.
Performance of Driving and Secondary Tasks Data Pre-Processing The data are obtained from the simulated driver. During the experiment, changes in the environment, the operational stability of the experimental equipment, and driver operation errors may cause data anomalies. Therefore, the outliers in the experimental data need to be removed before further rese- arch is conducted. Comparing each method of handling outliers, the Pauta criterion method (3σ) was selected as the solution for managing outliers in experimental data. This method mainly processes driving performance indi- cators and secondary task reaction times. Secondary task correctness requires manual rejection of abnormal user data.
EEG Pre-Processing Because EEG signals are susceptible to environmental interference, rando- mness, low signal-to-noise ratio, instability, and nonlinearity, they are prone to artifacts. Usually, common EEG signal artifacts and interferences include ocular artifacts, ECG artifacts, EMG artifacts, cardiac artifacts, and power frequency interference, so it is necessary to pre-process the EEG signal before analysis. The following are the steps of EEG signal processing for artifacts and interferences: Firstly, delete those subjects who did not achieve complete recording by the naked eye and those whose data were misrepresented due to the movement of the EEG signal collector caused. Determine the channel locations, and the sampling rate for this experiment is still 500 Hz. The next step is to filter the data. For the presence of power frequency interference, a 50 Hz notch filter can be used to filter it out. A 1 Hz high-pass filter and a 40 Hz low-pass filter are used. The EEG data recorded throughout the expe- riment is segmented according to the time of the task. After segmentation, independent component analysis (ICA) was performed to eliminate oculo- motor interference and EMG artifacts. The frequency structure of the signal is decomposed using the fast Fourier transform, using a Hanning window with an overlap of 50%. The power values of each band are calculated in the ranges of theta (4 to 7.5 Hz) and beta (14 to 30 Hz).
Results
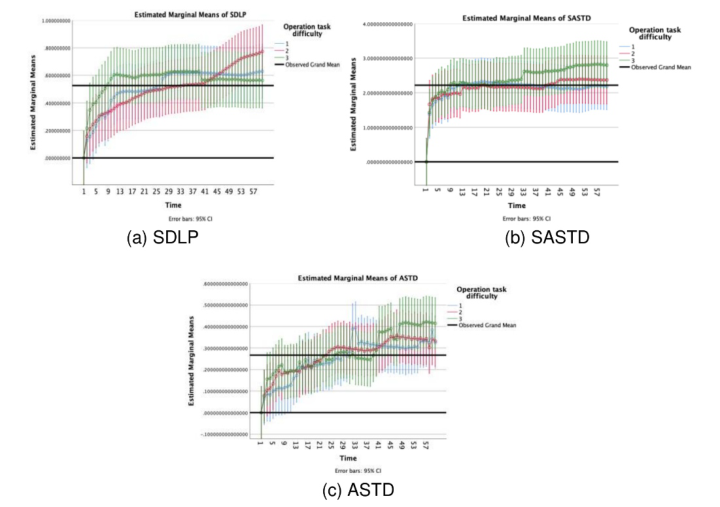
Driving Performance A one-way ANOVA was first conducted on these indicators to confirm that difficulty levels of secondary tasks would affect these indicators. If there is a significant effect, then the LSD method is further used to determine whether there is a significant difference between operation tasks of different diffi- culty levels. Table 3 shows the mean, standard deviation and 95% confidence interval of the driver’s driving performance in completing three different dif- ficulty levels of operation and the ANOVA results. Figure 3 offers the driving performance results.
Effect of Secondary Tasks in Touchscreen In-Vehicle Information System Operation 41
The results of the one-way ANOVA revealed a significant difference in the standard deviation of lane lateral position by different levels of the operatio- nal task (p = 0.01<0.05). A post hoc test LSD method obtained that there was a significant difference between difficulty one and three (P = 0.02<0.05), a significant difference between difficulty two and three (P = 0.005<0.05), and no significant difference between difficulty one and two (P = 0.628>0.05). A one-way ANOVA on the steering wheel corner standard deviation yielded a significant effect of different levels of touch interaction operations on the steering wheel corner standard deviation (P = 0.004<0.05), a significant dif- ference between difficulty one and three (P = 0<0.05), a significant difference between difficulty two and three (P = 0<0.05), and no significant difference
between difficulty one and two (P = 0.696> 0.05). A one-way ANOVA on the standard deviation of longitudinal acceleration yielded that the secondary task difficulty level of the operation would have a significant difference in the standard deviation of longitudinal acceleration (P = 0.016<0.05). Further, it was obtained that there was a significant difference between difficulty one and three (P = 0.003<0.05), no significant difference between difficulty one and two (P = 0.168>0.05), and no significant difference between difficulty two and three (P = 0.110>0.05).
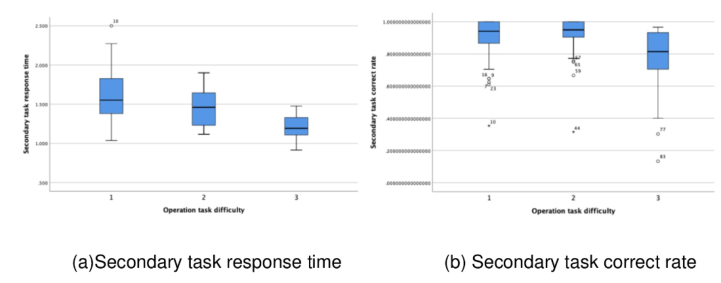
Secondary Task Performance A one-way ANOVA yielded a significant difference in secondary task reaction time by the difficulty level of the touch interaction operation secondary task (p = 0<0.05). The LSD method delivered significant differences between dif- ficulty one and difficulty two (P = 0.005<0.05), difficulty one and difficulty three (P = 0<0.05), and difficulty two and difficulty three (P = 0.001<0.05). An ANOVA test was performed on the secondary correctness, and it was obtained that the difficulty level of the touch interaction operation significan- tly affected the secondary task correctness (P = 0.004<0.05). The LSD got that there was no significant difference between difficulty one and difficulty two (P = 0.644>0.05); there was a significant difference between difficulty one and difficulty three (P = 0.008<0.05) and between difficulty two and difficulty three. (P = 0.002<0.05). Table 4 shows the mean, standard devia- tion and 95% confidence interval of the driver’s secondary task performance in completing three different difficulty levels of operation and the ANOVA results. Figure 4 offers the secondary task performance results.
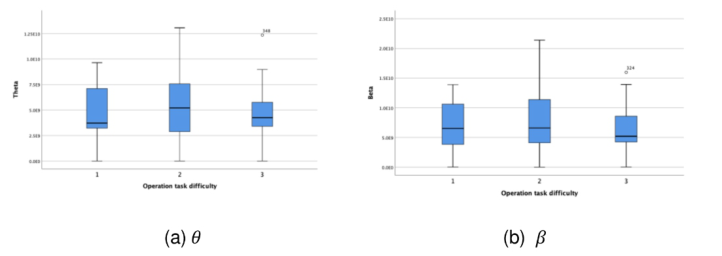
EEG The Shapiro-Wilk test was performed on the power of θ and β at the three operational secondary task levels, and it was determined that there was no normality in either of the two bands of the EEG signal (P<0.05). The inde- pendent samples Kruskal-Wallis test was then performed for nonparametric analysis of both waves. Table 5 shows the mean, standard deviation and 95% confidence interval of the driver’s EEG in completing three different difficulty levels of operation and the ANOVA results. Figure 5 offers the EEG results.
The results showed that operational secondary tasks of difficulty levels were significantly different for β (P = 0.011<0.05) and also
for θ (P = 0.044<0.05). Further analysis yielded that θ was significantly different between difficulty one and difficulty two operational secondary tasks (P = 0.022<0.05), difficulty two and difficulty three operational secon- dary tasks (P = 0.044<0.05), and not at difficulty one and difficulty three (P = 0.785>0.05). β was significantly different only at difficulty two and dif- ficulty three (P = 0.003< 0.05), and no significant differences existed in all other levels (P>0.05).
DISCUSSION AND CONCLUSION This study investigated the effects of three difficult operational secondary tasks on driving performance, secondary task performance, and EEG.
Regarding driving performance indicators, there was no significant dif- ference in the standard deviation of lane position, steering wheel angle and acceleration when the driver completed the touch operation task between dif- ficulties one and two. On the contrary, there was a significant increase in these indicators in difficulty level three. Although there was no significant differe- nce between difficulty levels one and two in the early stage, in the second half of the experiment, the standard deviation of lane lateral position increased, the standard deviation of steering wheel angle also increased, and the driver’s ability to control the car weakened. This means that when there is a secondary task load, although, in the short term, the driver does not experience much change in lane control. But when the duration becomes longer, the adverse effects of operating the secondary task become more severe, neglecting the main task of driving and thus reducing the ability to control the vehicle. The insignificant difference in the pre-task between difficulty one and two can be explained by the compensatory concept of driver presence. The driver’s additional operational resources are used to cope with the increased diffi- culty of the secondary task and instinctively keep regulating the time spent on the secondary task engagement. The driver’s compensatory adjustment behavior manifests as small changes in the vehicle’s longitudinal and lateral control metrics (standard deviation of lane position lateral excursions, etc.). However, as demonstrated in much of the literature, the resources available to control the driving task may be depleted over time, leading to impaired driving performance (Tarabay and Abou-Zeid, 2018b).
In terms of the secondary task performance, the driver’s secondary task response time showed a decrease as the operation difficulty increased. How- ever, the operation task difficulty two had the highest secondary task cor- rectness, followed by difficulty one, and finally, difficulty three, and the secondary task correctness rate for difficulty three was much lower than that of difficulty one and two. It can be inferred from the results that the download of difficulty level one makes the driver less attentive and alert. In contrast, the high burden of difficulty level three makes the driver overly distracted and unable to process information, so the driver pays attention to the primary mission. Regarding the highest correctness in level two, it can be concluded that the driver is trying to allocate their cognitive resources or energy. This confirms the self-regulatory behavior explored in the driving performance indicators above, inferring that the driver adopts a compensatory mechanism.
The theta band is often used to judge whether a driver is distracted (Lin et al., 2008). Theta band power is highest at difficult two due to the increased brain workload and the additional operational resources the driver needs to take up to complete the secondary task compared to the difficult one. The decrease in theta wave power for rank three is caused by the driver focusing on the primary driving task.
Compared to the tasks of operation levels one and two, the beta power increases, and the driver is more focused when completing difficulty two.
Effect of Secondary Tasks in Touchscreen In-Vehicle Information System Operation 45
When reaching operation task level three, the beta power decreases. The dri- ver is too mentally stressed because the brain’s cognitive resources occupied by the operation distraction task are more than the driver can bear. The driver needs to spend more time digesting and processing the information.
ACKNOWLEDGMENT
The authors would like to thank the National Natural Science Foundation (52205513) and Foundation Strengthening Project (2021-JCJQ-JJ-1042). We express our sincere gratitude to Changan Automobile Co., Ltd for the data collection.
REFERENCES
Chung, B. J., RESEARCHER, C., CENTER, H., CORPORATION, K. H., Keumto- Dong & Sujeong (2001), “Limit Length Evaluation of Tangent on Freeway according to Driver’s Physiological Response”, TRB ID, 01–3166. Gupte, S. & Askhedkar, A. R. (2018) An Innovative Wireless Design for a Car Info-
tainment System. 2018 Second International Conference on Intelligent Compu- ting and Control Systems (ICICCS). Madurai, India. Kenneth, M., Jæger, M. G., Skov, M. B. & Thomassen, N. G. (2008), “You can touch, but you can’t look: interacting with in-vehicle systems”, in Annual SIGCHI conference On Human factors in computing systems, pp. Kim, J. R., Shin, S., Choi, S. & Yoo, Y. (2016), “Multimodal Interaction on Au-
tomultiscopic Content with Mobile Surface Haptics”, Etri Journal, Vol. 38 No. 6, pp. 1085–1094. Kim, S. L. & Yang, J. H. (2018), “Evaluation of the Effects of Driver Distraction Part 1: Based on Simulator Experiments”, in 2018 IEEE International Conference on Systems, Man, and Cybernetics (SMC), pp. Lin, C. T., Lin, H. Z., Chiu, T. W., Chao, C. F. & KO, L. W. (2008), “Distraction-
related EEG dynamics in virtual reality driving simulation”, in IEEE International Symposium on Circuits & Systems. Marinkov, S., Mihajlovic, R., Kenjic, D. & Antic, M. (2022), “One Solu-tion of a Communication Manager for Connecting Advanced Driver Assistance Sys-tems with In-Vehicle Infotainment Systems”, in 45th Jubilee International Conven-tion on Information, Communication and Electronic Technology, MIPRO 2022, May 23, 2022 - May 27, 2022, Institute of Electrical and Electronics Engineers Inc., Opatija, Croatia, pp. 1399–1403. Mckinsey McKinsey’s electric vehicle index [EB/OL]. (2019-10-31) [2021-05-01]. Smith, M. E., Gevins, A., Brown, H., Karnik, A. & Du, R. (2001), “Monitor-ing
Task Loading with Multivariate EEG Measures during Complex Forms of Hu- man-Computer Interaction”, Human Factors, Vol. 43. Tarabay, R. & Abou-Zeid, M. (2018a), “Assessing the effects of auditory-vocal distraction on driving performance and physiological measures using a driving simulator”, Transportation Research Part F Traffic Psychology and Behaviour, Vol. 58 No. OCT., pp. 351–364. Tarabay, R. & Abou-Zeid, M. (2018b), “Assessing the effects of auditory-vocal
distraction on driving performance and physiological measures using a driving simulator”, Transportation Research Part F Traffic Psychology and Behaviour, Vol. 58 No. OCT., pp. 351–364.
Yan, W., Wong, S. C., Li, Y. C., Sze, N. N. & Yan, X. (2015), “Young driver distraction by text messaging: A comparison of the effects of reading and typing text messages in Chinese versus English”, Transportation Research Part F: Psychology & Behaviour, Vol. 3187–98. Zahabi, M. (2017), “Analysis and Redesign of Police Vehicle Mobile Computer
Terminal for Minimizing Officer Driving Distraction.”
LISTED IN THE AHFE DIGITAL BOOKSTORE CATALOGUE
Explore the complete digital volume
Human Factors in Transportation
Read this individual research paper free through the original publisher, or explore the full digital proceedings book.
ISBN 978-1-958651-71-1
Explore this ISBN in the AHFE Bookstore ↗Listed in the July 2026 bookstore catalogue; search by ISBN to confirm current availability · Digital book purchase optional