Víctor De Nalda Tárrega, Andrés Soler, Jose Laparra, Jose Solaz, Adrian Morales Casas (2023). Can haptic signals aid to solve ADAS limitations?. In: Human Factors in Transportation. AHFE Open Access, vol. 95, pp. 133–142. https://doi.org/10.54941/ahfe1003799
The number of Advanced Driving Assistance Systems (ADAS) in the vehicle has continuously increased during the last years. There is, however, a lack of understanding in how this information can be better conveyed to the driver, in order to optimize its help. Drivers may become overexposed to visual information when driving, or acoustic alerts can be masked in noised environments. Moreover, if the user is not paying attention to the road or using headphones, visual and acoustic alerts would not be as efficient or desirable, but the key is the multimodal communication.Therefore, a study has been carried to evaluate the effectiveness of a new haptic and acoustic ADAS system comparing it to conventional visual ADAS. This new system is called Vibe system, that consists of a seat with haptic actuators and acoustic signals. In order to carry out the experiment, 20 subjects in ‘standard’ sleeping conditions and 10 in ‘sleep deprived’ conditions participated in the experiment. The experimentations were taken place in the dynamic driving simulator developed by the IBV’s Human Autonomous Vehicle (HAV). Users were immersed in driving tasks, in day and night conditions, with CARLA SW in the HAV simulator while several visual, auditive and haptic alerts appeared to simulate different ADAS of some of the most common vehicle brands. In every hazardous situation during the driving tasks, the following alerts were triggered: drowsiness, blind spot alert, overspeed alert and lane change. The driving behavior, the mental status and the user opinion of each user was gathered using telemetry, physiological signals and validated questionnaires such as TAM or SUS.In a general overview, there are barely no statistically significant difference in the main parameters between the haptic and the conventional visual ADAS evaluated, so the effect of each signal is similar in controlled conditions. Currently, the acceptance of traditional ADAS is slightly higher but haptic ADAS acceptance improves along sessions, even being a new technology.
In recent years, the ADAS (Advanced Driver Assistance Systems) develo- pment has been of great importance for the OEM in the automotive industry (Nidamanuri et al. 2022). Due to this increasing interest in the developing systems that assist the driver (or passenger in case of autonomous vehicles) by the vehicle purchasers (Greenwood, Lenneman, y Baldwin, 2022), and
the need to communicate more things to the driver without saturating their visual field, new methods to do this in a more optimized way, have also arisen.
Recent studies show that including haptic signals to the conventional visual alerts to create a multimodal warning system, performs better in take-over requests according to the users (Yun y Yang, 2020). Other studies have been carried evaluating different ways of conveying the alerts to the users: voice alerts and visual icons (Janssen et al. 2019), as well as older studies in which the conclusions are that the use of haptic seats is recommended when quick and accurate manual responses are required (Fitch et al. 2011), and that mul- tisensory warning signals offer a particularly effective means of capturing driver attention in demanding situations such as driving (Ho, Reed, y Spence, 2007). However, there is a lack of published articles that focus on comparing TRL 7 haptic systems with already-commercial visual ones.
This study has been completed to evaluate user’s usability and techno- logical acceptance of the haptic feedback and the benefits of multimodal communication, using as basis visual commercial ADAS of some brands and a new haptic system Vibe.
The Vibe System, consist of a driver seat with haptic actuators installed in it. These actuators are controlled by a software that has different vibrating patterns stored and conveys information to the driver. Therefore, the Vibe system may generate acoustic and vibrating signals for each alert. By using different vibration patterns different alerts can be transmitted to the user in a more efficient way.
MATERIAL AND METHODS The experimentation was completed in two different loops. A first loop of experimentations was taken place with 9 users (6 in ‘standard’ conditions and 3 with sleep deprivation) and, after a data revision, some improvements in the experimental plan were made. Afterwards, a second loop was carried out with 30 users (20 in standard conditions and 10 with sleep deprivation).
In order to evaluate how the haptic seat conveys the information to the users compared to other conventional visual and acoustic alerts, and how they react and accept this technology, the following assessments have taken place during the study.
Analysis of the telemetric data of each user in real time to determine driving behavior after different alerts were triggered.
Subjective evaluation of the users on different aspects of alerts system with different designed questionnaires.
Analysis of physiological data of the users to determine level of activation or arousal (Laparra-Hernández et al. 2009).
The study consisted of assessing the aforementioned aspects of the users driving behavior in two different driving scenarios (night and daylight). Users rest state was divided in a) standard (at least 6 sleep hours in the last 24 hours) and b) sleep deprived (awake in the last 20 hours). The night driving
Can Haptic Signals Aid to Solve ADAS Limitations? 135
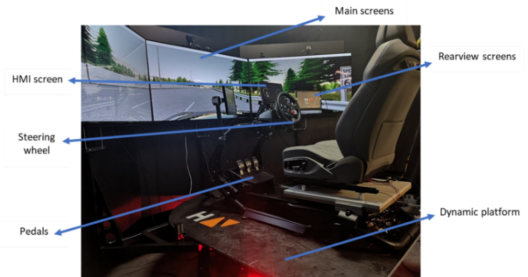
Figure 1: Driving simulator layout during the experimentation.
scenario was intended for users in ‘sleep deprived’ condition. The experi- mentations were carried in the HAV (Human Autonomous Vehicle) at the Instituto de Biomecánica de Valencia facilities (Figure 1), where visual, audi- tive and haptic ADAS for the following hazardous situations: Drowsiness, Blind spot, Overspeed and Lane Change, were evaluated.
Experimentation Setup The IBV’s dynamic driving simulator (HAV) consists of a dynamic platform, reproducing the different accelerations in the vehicle; the CARLA simulation software, where the different driving scenarios can be programmed; stee- ring wheel and pedals, to control the vehicle in the simulation; “three 55” screens, creating a wide FOV for the user; and an HMI where different infor- mation about the driving environment can be shown (including visual icons) (Tárrega et al. 2022). Therefore, the different driving scenarios could be pro- grammed to enhance different hazardous situations and increase the chance of the different alerts being triggered.
The simulation script, developed by IBV, controlled the different events happening in a driving scenario (traffic jams, pedestrians crossing), stored the telemetry data for further analysis and trigger the different alerts. The alerts were displayed as a visual icon imitating conventional ADAS, or as an acoustic and haptic signal from the Vibe system.
The Vibe system consists of the Vibe seat, with different actuators, that vibrated in different patterns whenever the different alerts were triggered by the simulator, and some headphones that played the different acoustic signals of the different alerts.
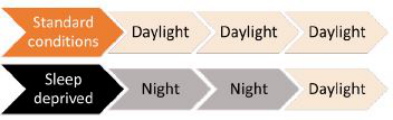
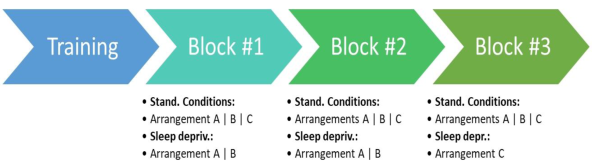
Driving Scenes Two types of driving scenes were developed for the two different user cases. Standard conditions users did the experimentation with 3 daylight scenes, and sleep deprived users did the first two scenarios with nightlight scenes and one final daylight scene (Figure 2). The scheme for the different users was as follows.
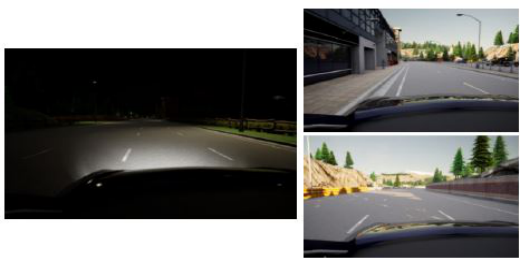
Night scene was used for the first two blocks of ‘sleep deprivation’ experi- mentation. It consisted of a night-light environment scene, with a long bypass
Figure 2: Scheme for different user’s conditions.
of an urban landscape. The main idea of this scene was to enhance fatigue behavior while driving, to test the acceptance and effect of the drowsiness alert on the user. This was achieved by having a long monotonous drive in simulated night conditions, with few turns (Figure 3). In this scene, only dro- wsiness, that was triggered manually by the technician once per scene, when a sleepy activity by the user was detected, could be triggered. If not, an excess number of alerts could make more difficult to create the situation where the user was falling asleep while driving.
Daylight scene was used for the three ‘standard conditions’ blocks, and the third “sleep deprivation”block. It is composed of a driveway loop and a small urban landscape. The weather conditions were sunny, dry and with good visibility (Figure 3). During this scene, the alerts evaluated were overspeed, lane change and blind spot. These alerts were triggered automatically with the virtual sensors spawned onto the vehicle in the simulation.
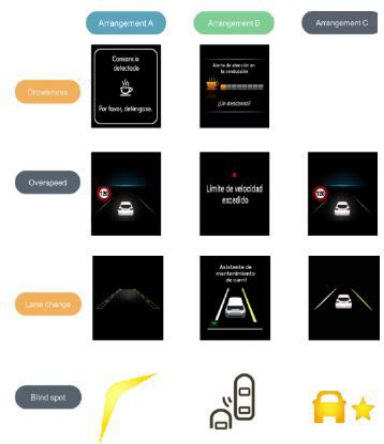
Driving Alerts The main goal of the experimentation was to compare the Vibe system alerts with other conventional already-on-the-market visual alerts. Different icons were associated to specific arrangements in the following way (Figure 4).
Haptic alerts worked in a similar way than the visual ones. Whenever the simulation detected a hazardous event, the simulation script sent the signal to the Vibe software. The signal specified which type of alert should be trig- gered, and the software had the different designed vibration patterns stored, activating the specific actuators in the seat for each alert.
Each user participated in an experimentation with three evaluated driving blocks. Each block was composed of an alert’s arrangement, that stated the
Figure 3: Example of night (left) and daylight (right) scenes.
Can Haptic Signals Aid to Solve ADAS Limitations? 137
Figure 4: Visual icons displayed in the HMI (conventional ADAS) per scenario.
order of alerts appearance for each driving scenario, and a driving scene. The driving scenes have been previously described, and the alert’s arrangement were organized as follows (Figure 5).
Arrangement A. Standard conditions had 6 minutes of vibration alerts and then 6 minutes of visual alerts. Sleep deprivation had 7.5 minutes of vibration alerts and then 7.5 minutes of visual alerts.
Arrangement B. Standard conditions had 6 minutes of visual alerts and then 6 minutes of vibration alerts. Sleep deprivation had 7.5 minutes of visual alerts and then 7.5 minutes of vibration alerts.
Arrangement C. 6 minutes of vibration overspeed alert + visual blind spot and lane change alert, and then 6 minutes of visual overspeed alert + vibra- tion blind spot and lane change alert. Arrangement C does not differ for sleep deprivation conditions. In the case of a sleep deprivation experi- mentation, this arrangement is reserved for the third block and is always composed of a daylight scene, introducing the other three alerts. No drowsiness alert is evaluated in this arrangement.
Different arrangements were defined, so that users did not have always one type of alerts first. The order in which the three different arrangements
Figure 5: Scheme of the possible arrangements for each block.
appeared was randomized. Standard conditions had the order of the arran- gements completely randomized and sleep deprivation experimentations had arrangements A and B randomized to see which one was used for the first and second block, as the third block always used arrangement C. This was due to the introduction of the other three alerts, not evaluated until that moment, under standard conditions.
The drowsiness alert was only triggered in the night light scenes, and it was triggered manually whenever the user seemed to get sleepy during the scena- rio. Blind spot, overspeed and lane change alert were automatically triggered when each risk appeared in daylight scenarios. Blindspot was triggered whe- never a vehicle travelling in an adjacent lane of the user’s vehicle reached the blind spot of the rear-view screen. Overspeed alert was automatically triggered whenever the user was travelling faster than the road speed limit. Lane change alerts was automatically triggered whenever the user invaded an adjacent lane without indicating the manoeuvre with the turning lights at a velocity higher than 45 kmh.
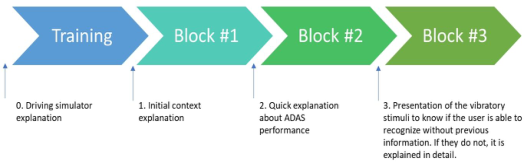
Test Procedure The test procedure consisted of six steps, and the experimentation time- line is shown in Figure 6. The welcome step, where the user was informed about the test they were going to complete; the trial driving scenario, where the user drove for 5 minutes and no measurements were taken (the sole purpose of it was to get the user used to the simulator movements and dri- ving behaviour, as it could differ from a real driving experience); the three driving scenarios, where, for the first two, there were differences between sleep deprivation and standard conditions users, and for the last one, the driving scenario was the same for both users. Before the beginning of the third scenario, the user completed a short questionnaire, checking if all of the alerts (visual and vibration) were understood correctly. If there was any incorrect alert identification, the correct alert was explained to the user. Therefore, the user had then the knowledge to identify each alert corre- ctly in the last scenario. In the case of sleep deprivation, it would be the first time the overspeed, lane change and blind spot alerts were introduced, so more difficulty to identify all of them was expected. The experimenta- tion ended with a final questionnaire, where the opinion of the users in the specific visual and vibration alerts, as well as the general system, was evaluated.
Figure 6: Experimentation timeline.
Can Haptic Signals Aid to Solve ADAS Limitations? 139
Data Analysis In order to evaluate how the users reacted to the Vibe system alerts while driving, compared to conventional and visual ADAS, three types of data were measured in the study (telemetry, subjective and physiological data).
During the measured scenarios, telemetry data of the driving behaviour was stored for each frame in a file (frame number, time elapsed since the beginning of the scenario in ms, acceleration of the vehicle [x, y, z], speed of the vehicle, road speed limit, steering wheel angle, throttle and brake pedal level [0, to 1], type of alert being triggered if any). For each type of alert, the following variables were studied.
Drowsiness. The mean velocity of the vehicle after the alert was triggered compared to the mean velocity before.
Blindspot. The mean position and the angular velocity of the steering wheel after the alert compared to before.
Overspeed. The mean velocity and acceleration of the vehicle after the alert was triggered compared to before.
Lane change. The mean position and the angular velocity of the steering wheel after the alert compared to before.
The analysis of mental state is based on the following physiological signals: electro dermal activity (EDA) of the skin, heart rate variability (HRV) and peripheral skin temperature (TEMP). EDA has two main components, the tonic signal, that allows the recognition of slow changing patterns, and the phasic signal, which corresponds to very rapid changes in the signal that occur in response to a certain stimulus. HRV allows us to identify users who felt more relaxed during the tasks in comparison to the users who were more focused on the task. TEMP increment is related with stress situations in non-changing thermal conditions.
The subjective data was collected by means of questionnaires. An ini- tial questionnaire was completed for characterizing the user and gathering their driving habits. The intermediate questionnaires (completed after every driving scenario) included questions about perceived comfort and safety during the drive; and questions about comprehension, quantity and emo- tional responses to the alerts. The final questionnaire comprised rating and comparison between all the triggered alerts in both systems, usability testing regarding technology acceptance model (TAM) and the system usability scale (SUS) comparing again both models, and questions about the user’s interest and general rating of the system.
RESULTS
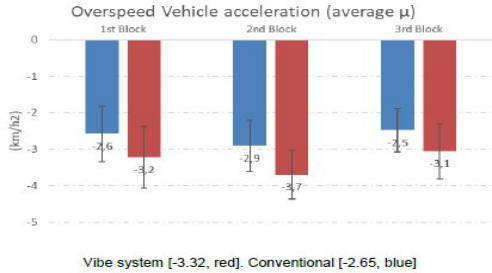
Telemetry Results The telemetry analysis has been focused on how the reaction of the users differ for each alert and scenario, comparing the results of the Vibe system with the conventional visual alerts (Figure 7).
In overall, no statistically significant differences were detected in the telemetry analysis among both systems for the different alerts, taking into
Figure 7: Difference in linear acceleration after overspeed alert is triggered.
consideration the telemetry data mentioned before for each alert. There- fore, both systems, haptic and traditional ADAS, have a similar effect on the reaction and behaviour of drivers. However, the only statistically signifi- cant difference detected, showed the users tend to decelerate more, when the overspeed alert was triggered through the Vibe system in comparison to the conventional visual alerts (Figure 7).
Physiological Results Analogous to telemetry, there were not statistically differences in the level of activation of drivers between haptic and visual ADAS, with similar results in EDA responses and amplitude, heart rate variability and mean skin tempe- rature. Therefore, both systems, haptic and traditional ADAS, have a similar effect on the attention or level of cognitive demand of the users. It has been detected that sleep deprived users had higher number of EDA peaks but lower amplitude (Table 1).
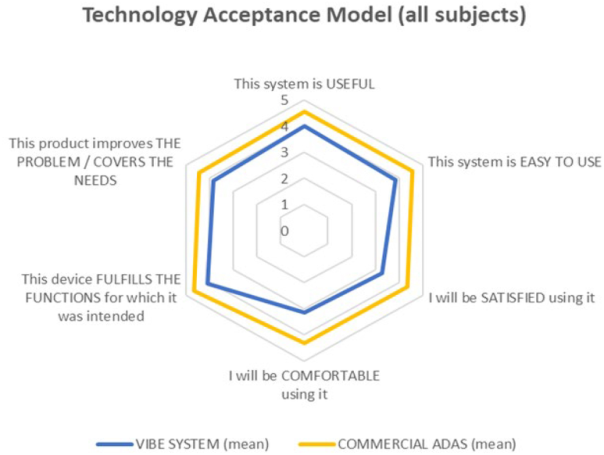
Subjective Results According to the subjective results, the visual ADAS have a slightly higher acceptance in the users (Figure 8), as it can be seen in the technology acceptance model (TAM).
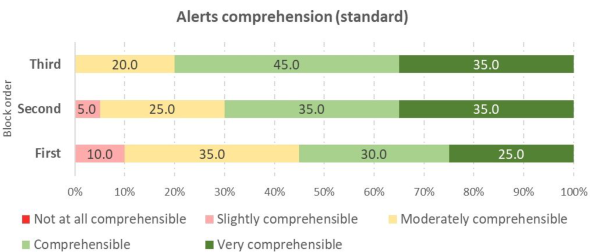
It should be highlighted that this scale is used for assessing the acceptance on new technologies and here, a new one (vibratory solution) was compared as an alternative to a conventional solution, already known for most users (visual and acoustic alerts). Moreover, haptic system’s comprehension incre- ased throughout the experimentation for standard conditions users, showing a positive learning effect in short time during the test sessions (Figure 9).
Table 1. Parameters of EDA analysis per user’s condition.
Table available in the original PDF paper.
User’s condition Standard Sleep deprived
Number of peaks (avg) 13.5 16.1 Amplitude (avg) 1.6 µS 1.2 µS
Can Haptic Signals Aid to Solve ADAS Limitations? 141
Figure 8: TAM model “HMI/commercial ADAS” and “VIBE” systems.Figure 9: VIBE alerts comprehension level for standard conditions users in every driving scenario.
CONCLUSION
The Vibe system, combining haptic and auditive, is an alternative to the conventional ADAS systems. It takes advantage of the non-saturated com- munication channels (like the visual information while driving) and can also be detected when the driver is distracted.
Although, commercial visual ADAS have higher acceptance among the dri- vers, the haptic acceptance improves along sessions showing a good learning effect in short time, and reducing differences.
From a general overview, both systems, haptic and traditional ADAS, have a similar effect on the driver, there were not found significant differences in most of the behaviour, mental state and subjective opinion variables. Even Vibe system’s overspeed alert has a higher impact on driver behaviour, as the user tends to decelerate the vehicle more when the overspeed alert is triggered.
More research is needed to fine tune the optimal multimodal interaction for each hazard scenario and current driving situations, but also to new scenarios related to automation’s level 3-5.
ACKNOWLEDGMENT
The authors would like to acknowledge the participation of Faurecia, spe- cially Anne Isabelle Mallet-Dacosta, and Aurasens, by providing the Vibe system seat and assisting with every technical problem that arose while setting up the experimentation.
REFERENCES
Fitch, Gregory M., Jonathan M. Hankey, Brian M. Kleiner, y Thomas A. Dingus.
2011. ≪Driver Comprehension of Multiple Haptic Seat Alerts Intended for Use in an Integrated Collision Avoidance System≫. Transportation Research Part F: Traffic Psychology and Behaviour 14 (4): 278–90. Greenwood, Pamela M., John K. Lenneman, y Carryl L. Baldwin. 2022. ≪Advanced Driver Assistance Systems (ADAS): Demographics, Preferred Sources of Infor- mation, and Accuracy of ADAS Knowledge≫. Transportation Research Part F: Traffic Psychology and Behaviour 86 (abril): 131–50. Ho, Cristy, Nick Reed, y Charles Spence. 2007. ≪Multisensory In-Car Warning
Signals for Collision Avoidance≫. Human Factors 49 (6): 1107–14. Janssen, Christian P., Remo M. A. van der Heiden, Stella F. Donker, y J. Leon Kenemans. 2019. ≪Measuring susceptibility to alerts while encountering mental workload≫. En Proceedings of the 11th International Conference on Automo- tive User Interfaces and Interactive Vehicular Applications: Adjunct Proceedings, 415–20. AutomotiveUI ’19. New York, NY, USA: Association for Computing Machinery. Laparra-Hernández, J., J. M. Belda-Lois, E. Medina, N. Campos, y R. Poveda. 2009.
≪EMG and GSR Signals for Evaluating User’s Perception of Different Types of Ceramic Flooring≫. International Journal of Industrial Ergonomics 39 (2): 326–32. Nidamanuri, Jaswanth, Chinmayi Nibhanupudi, Rolf Assfalg, y Hrishikesh Venkataraman. 2022. ≪A Progressive Review: Emerging Technologies for ADAS Driven Solutions≫. IEEE Transactions on Intelligent Vehicles 7 (2): 326–41. Tárrega, Víctor De Nalda, Andrés Soler, Nicolás Palomares, Javier Silva, Jose
Laparra, y Jose Solaz. 2022. ≪Human Autonomous Vehicle (HAV): From Sickness Prevention to Emotional Response≫. En Human Factors in Transpor- tation. Vol. 60. AHFE Open Acces. Yun, Hanna, y Ji Hyun Yang. 2020. ≪Multimodal Warning Design for Take-over Request in Conditionally Automated Driving≫. European Transport Research Review 12 (1): 34.
LISTED IN THE AHFE DIGITAL BOOKSTORE CATALOGUE
Explore the complete digital volume
Human Factors in Transportation
Read this individual research paper free through the original publisher, or explore the full digital proceedings book.
ISBN 978-1-958651-71-1
Explore this ISBN in the AHFE Bookstore ↗Listed in the July 2026 bookstore catalogue; search by ISBN to confirm current availability · Digital book purchase optional