Anna Antonakopoulou, Eleni Vlahogianni, Giannis Karaseitanidis, Eleni Patatouka, Evangelia Portouli, Angelos Amditis, Odysseas Raptis, Evangelia Latsa (2023). A research approach for studying the a priori acceptance of autonomous passenger transportation towards sustainable urban mobility planning. In: Human Factors in Transportation. AHFE Open Access, vol. 95, pp. 143–153. https://doi.org/10.54941/ahfe1003800
In this paper we investigated the a priori acceptance and the economic sustainability of passenger transportation with autonomous mini vans from the city center to the suburban area, in the context of the AVINT Program. In AVINT framework a pilot operation of autonomous mini vas has been performed in the Trikala city as a continuation of the pilot application of autonomous buses within the framework of the European project CityMobil2 in 2016. The acceptance analysis sample consists of 720 answered questionnaires and its distribution has been done by age, gender, vehicle ownership, education level, occupation, purpose of travel and means of travel. The research aimed to i) investigate the factors that will influence the choice of an autonomous vehicle's service over the existing service with conventional vehicles, ii) estimate the number of passengers who will ultimately choose the autonomous vehicle service over the conventional one and iii) examine a future deployment of the autonomous fleet service as well as new business opportunities for the transport operators and service providers. The study was a stated preference research, based on commuting interviews and wide online citizen’s survey. Information collected using structured questionnaires following a well-defined questionnaires’ design methodology. This method enabled the investigation of commuter choices presenting different hypothetical choice scenarios, covering a range of different system states and values of its attributes. In this way, the required variability was ensured for estimating the parameters of a suitable model, which satisfactorily describes the respondents' preferences. In order to record the respondents' characteristics and preferences, questionnaires included three distinct parts: i) scenarios of transport mean selection, ii) demographic characteristics, and iii) transportation profile. Particular attention was paid to determining eligibility and sample size, thus different questionnaires were designed, in terms mainly of the autonomous vehicles’ route. These have been distributed to two different important in terms of mobility, locations of the city. The collected data were first analyzed with the help of descriptive statistics tools, while appropriate econometric models (Multinomial logit models – MNL) are then used, through which the selection factors of autonomous vehicles were identified and the number of their potential users has been estimated. Results shown that from the 22% of the participants who answered positively to the question "Are you interested in the new service?", the selection of transportation mean between public transportation with conventional mini bus and autonomous vehicle is highly relevant to cost, waiting time and travel time. An increase in these variables leads to a decrease in the utility and selection possibility of the mean. The constant for autonomous vehicle choice is negative and statistically significant. Results have been correlated to the a posteriori analysis conducted within the framework of the Citymobil2 project and several similarities noticed. This led to the optimized specification of the service with the autonomous fleet based on user preferences and commuting attitudes.Furthermore, taking into account the existing demand for commuting by public transport in the city of Trikala at the selected scenarios, routes and locations as well as the demand that will be assumed by the new service, it emerged that users are willing to pay €0.30 extra for the autonomous fleet service to reduce the waiting time, an amount corresponding to 25% of the existing ticket price and €0.26 extra to their ticket to reduce the travel time.Finally, an economic sustainability analysis of the service with autonomous vehicles has been performed based on the assumption that the project has a 12-year horizon (2019-2031). As regards financial autonomy, it was examined whether the revenues from the operation of the autonomous vehicles can offset the costs of operation and maintenance and it emerged that the operation of them is financially sustainable.
The continuing evolution of automotive technology and of automated systems in the transportation system aims to deliver even greater benefits than earlier technologies such as safety (i.e., reducing the number of road accidents caused by human error; environment (i.e., reducing transport emissions and congestion by smoothening traffic flow and avoiding unnecessary trips) and inclusiveness (i.e., ensuring inclusive mobility and good access for all) (Sagir et al., 2018).
On the other hand, successful deployment of this new technology requires broad acceptance in society, as regardless the benefits that autonomous dri- ving promises to bring with it, many people remain reluctant about letting
a computer control a car. Therefore, numerous studies in the literature have investigated when, how and why people would (or would not) be willing to make use of ARTS (Mara, M et al. 2022).
The present ARTS acceptance research aims on the one hand to investi- gate the factors that will influence the preference of an autonomous vehicle over the existing conventional vehicle service and on the other hand to estimate the number of passengers who will ultimately choose the ARTS over the conventional ones, thus leading to their sustainable future deploy- ment. The study conducted within the city of Trikala in the context of the AVINT project where a real pilot operation of autonomous mini buses is deployed and it was based on a stated preference research, including commu- ting interviews and wide online citizen’s survey. Information collected using structured questionnaires following a well-defined questionnaires’ design methodology.
This method enabled the investigation of commuter preferences presen- ting different hypothetical scenarios, covering a range of different system states and values of its attributes. In this way, the required variability was ensured for estimating the parameters of a suitable model, which satisfa- ctorily describes the respondents’ preferences. Questionnaires included three distinct parts: i) scenarios of transport mean selection, ii) demographic cha- racteristics, and iii) transportation profile. Particular attention was paid to determining eligibility and sample size, thus different questionnaires were designed, in terms of the autonomous vehicles’ route. These have been distri- buted to two different locations of the city in spots with importance in terms of mobility. The collected data were first analyzed with the help of descri- ptive statistics tools, while appropriate econometric models (Multinomial logit models – MNL) are then used, through which the selection factors of ARTS were identified and the number of their potential users has been esti- mated. The final stage of analysis concerns the financial evaluation with the aim of investigating the necessity, the financial viability and feasibility of the project from the business perspective towards future deployment and urban sustainability.
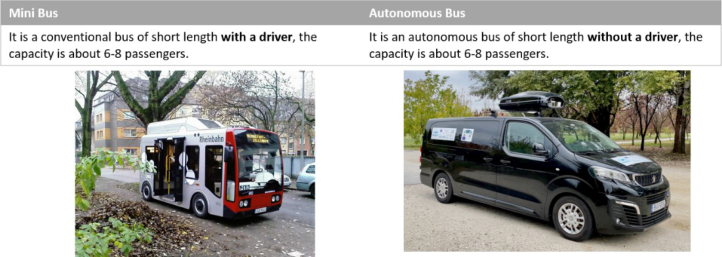
QUESTIONNAIRE DESIGN The questionnaire includes a brief description of the purpose of the research and the typical route in the area of Trikala, on which the stated preference experiment is based. Then the characteristics of the two alternative types of vehicles, which can serve this typical route, are described. These are a conven- tional minibus and an autonomous minivan (ARTS), for which respondents are asked to express their preference (Figure 1).
The design of the questionnaire is based on the following principles (Ritter L. A et al., 2007):
Simplicity and clarity in the wording of the questions.
Emphasis on who is doing the research and creating a level of trust.
Ability to fill out the questionnaire quickly (on average 5 minutes).
Grouping questions into homogeneous sections.
A Research Approach for Studying the A Priori Acceptance 145
Figure 1: The two different types of vehicles of the survey.
Succession of the questions from simple to complex, in order to facilitate the respondent in her answers.
Avoid negative type questions.
The body of the questionnaire, includes three distinct parts: (a) Transpor- tation mean selection scenarios: For the two alternative types of vehicles, which are presented to the respondent, scenarios are structured according to the characteristics of Table 1.
In stated preference surveys, the fractional factorial design can be used against the fully factorial design (Cerchi E et al., 2015). Both of these desi- gns ensure orthogonality, but the fractional usually involves many fewer combinations than the fully factorial, while guaranteeing the satisfaction of certain desirable statistical properties, such as identification and precision (Ben-Akiva M., 2007). For the selection of scenarios, code was developed in R to create a fractional factorial experiment with the Federov method (Federov, V. V., 1972). (b) Demographic characteristics: The second part includes questions about demographic characteristics, such as: (i) age, (ii) gender, (iii) income, (iv) edu- cation level, (v) occupation, (vi) private car ownership and (vii) possession of a monthly travel card. An open-ended question is also included regar- ding the mean the respondent will choose in the event that the two avai- lable means do not differ in terms of travel times and stops as well as travel costs. (c) Travel profile: The third part of the questionnaire includes questions rela- ted to the respondents’ travel profile, such as: (i) point of origin and point of destination, (ii) transportation means, (iii) purpose of travel, (iv) capacity of the vehicle and (v) route selection.
Table 1. Structure of different scenarios.
Table available in the original PDF paper.
Variable No of Levels Levels Minibus/ARTS Waiting time 2 5/10 minutes Travel time 2 8/16 minutes Ticket cost 2 Current/ plus €2
RESEARCH DESIGN AND EXECUTION In designing the research, particular attention was paid to determining eligi- bility and sample size (Smith, T. M. F., 1976). The suitability of the sample depends on whether it meets some basic conditions:
The sample must be selected each time from the appropriate population.
The size of the sample is of great importance and more precisely the larger it is, the more reliable the results of the research.
It must be selected in such a way that the sample is representative of the population in terms of its characteristics. The sample had to consist of people with a variety of socio-economic characteristics.
For this reason, as aforementioned, two questionnaires which differed in terms of the description of the route of the new mean, were distribu- ted to two different major points of interest of Trikala city, the University and the Intercity Bus station respectively. Furthermore, test questionnaires were completed to verify the completeness and feasibility of the research. According to theoretical and empirical approaches (Morpace & Cambridge Systematics, 1999), the suggested sample size for a margin of error of 5%, a confidence level of 95%, a population of more than 20,000 potential users is that of 377 questionnaires, a size set as the lower limit when collecting questionnaires.
The analysis of the stated preference survey is done with the help of random utility and the corresponding MNL (multinomial logit) accounting model (Ortuzar, J., & Willumsen, L. G., 2011). In general, users aim to maximize their utility (Ben-Akiva, M., Lerman, S.R., 1985). Utility is an unmeasured variable consisting of two terms (Washington, P et al., 2010): the systematic utility (Vi) and the random error (εi). A typical mathematical expression of the utility in the present application is as follows: Vi = βCC + βWTWT + βTTTT (1)
Where C is the travel cost, WT is the waiting time and TT is the travel time with the coefficients βC, βWT and βTT respectively showing the influence of each factor on the utility. In the case of two options (e.g. minibus or ARTS) the probability of choosing one means over another is:
Pminibus = eVminibus
eVminibus + eVARTS (2)
PARTS = eVARTS
eVARTS + eVminibus (3) where V(minibus) and VARTS are the systematic utilities of the two options. Derivative of the above analysis is the user’s time cost estimate (“Willingness- To-Pay” -WTP (Hensher et al., 2005)). This results, after estimating the coefficients βi from the following relations:
A Research Approach for Studying the A Priori Acceptance 147
(4)
WTPWT = βWT βC
. (5)
WTPTT = βTT βC
ANALYSIS RESULTS The final sample consists of 720 fully answered questionnaires. About 14% of the completed questionnaires derived from the online survey. In the sample, the distribution by age, gender, vehicle ownership, education level, occupation, purpose of travel and means of travel are represented as a whole. The sample consists of 48% men. 45% of respondents were between 25 and 45 years old. 44% of the sample were university graduates and 33% high school graduates. Also, 24% students and 34% employees. Regarding the travel profile, 82% were car owners.
For their last trip, the respondents answered that the main purpose of their trip was for work (29%) or shopping (41%) and their means of transpor- tation was the bicycle (33%) and to a lesser extent the car (24%) and an intercity bus (24%).
The analysis concerns 22% of the sample, who answered positively to the question “Are you interested in the new service?” and turned out that the greatest percentage of acceptance of the new mean exists among men aged between 25 and 45 years. Those with a high level of education, as well as those who own a car, are clearly more positive about the new transporta- tion mean and service. Finally, the new mean would be used by a greater percentage of those who commute to/from work and for professional rea- sons. In relation to cost (C), waiting time (WT) and travel time (TT), the results of the analysis of the preference of transportation mean between minibus and autonomous vehicle are shown in Table 2. From the signs of C, WT and TT it can be seen that an increase in C, WT and TT leads to a decrease in the utility of the new mean and hence the preference over it. The constant for autonomous vehicle preference is negative and statistically significant.
Additionally, the results of Table 2 show that the user is willing to pay €0.30 to reduce the waiting time, an amount that corresponds to 25% of the existing ticket price. Accordingly, each user is willing to pay €0.26 extra on his ticket to reduce his travel time. It also follows that, in the case of
the introduction of the new transportation mean for a typical route with an average minibus speed of 25 km/h and an autonomous vehicle of 12 km/h and with the constant cost assumption, approximately 20% of the existing demand will move directly to the autonomous vehicle.
For the estimation of the passenger movement (demand) using the new mean, it is considered that the new service should serve the two major points of interest. Also, the new mean will replace the existing minibus line that connects the city center with the two points of interest in the suburbs, but it is estimated that it will take over some of the passengers from the conventional minibus. This assumption does not take into account the possibility of users moving from a car to an autonomous vehicle, and it is reasonable for the following reasons:
The characteristics of the new vehicle are similar to those of a minibus and, therefore, cannot be attractive to users who choose a vehicle for their journeys, especially for commuting, where the expected speeds of a veh- icle are significantly better than those of an autonomous vehicle public transportation.
The new mean will mainly attract students and users of the public transportation, who to a large extent do not own a car.
The new line is located some distance from the city center. Therefore, this means that, even if someone wishes to use the autonomous vehicle to approach the town of Trikala, she should be prepared to walk a dista- nce of about 800 meters, which is marginally acceptable for a provincial town.
According to the city’s sustainable urban plan (SUMP) and historical tran- sportation data, the minibus line handles an average of 400 passengers per day and presents a peak demand of 10 passengers/hour/direction, which cor- responds to 5.7% of the daily demand. In the case of the University, it derives that at the peak, 40 passengers/hour are moved and considering that the demand of the University is more unevenly distributed over the time (8% of the daily demand) it follows that the daily demand for travels to and from the University is 500 per day. For the new mean, the daily demand is estimated as follows: (a) Given that the results of the stated preference survey showed that approximately 20% of the existing passenger traffic will move to the autonomous vehicle, it is estimated that the daily passenger traffic for the routes to / from the University facilities is 100 passengers/day and in peak 8 passengers/hour. (b) For the Intercity Bus station, it is estimated that, due to the lack of another line connecting the center with the intercity bus terminal, the new autonomous vehicle will absorb approximately 50% of the daily demand, i.e. 200 passengers/day and an average of 10 passengers/hour. In total, the new mean should serve an average of 300 passengers/day.
CORRELATION WITH CITYMOBIL2 PROJECT FINDINGS Regarding the attractiveness of the new mean in relation to the traditional minibus with a driver, earlier analyzes of responses to a stated preference
A Research Approach for Studying the A Priori Acceptance 149
questionnaire survey in the central area of Trikala in the context of the CityMobil2 project in 2016, showed that the probability of choosing an auto- nomous vehicle in relative to that of the minibus, it increases for men and for younger users of public transport. In relation to the occupation of the respondents showed that the probability of choosing an autonomous vehi- cle for a route in the center of Trikala compared to that of carrying out the same journey by minibus increases among students, workers and unemplo- yed, but decreases among women engaged in the domestic ones. The same research highlighted a positive correlation with the level of education and the possession of a monthly public transport card. Also, more than half of the interviewed passengers (54%) were willing to pay the same as the current Public Transport fare for the ARTS service and almost one third of respon- dents (30%) were willing to pay more than the current PT fare (Portouli, E., 2017). Furthermore, in a follow-up survey of 315 passengers who trave- led with the autonomous minibus in the center of Trikala between October 2015 and January 2016, it emerged that users rated their experience as ple- asant, were satisfied with the service and would they used it again in the future (Madigan et al. 2017, Portouli et al. 2017). The CityMobil2 research project constitutes an important legacy for the acceptance of the automated buses into the urban context. Through continuous participatory processes, the residents accepted and used the new mean, despite initial reluctance. The AVINT research program ensures the social consensus regarding the integra- tion of automatic vehicles with the aim of the effective operation of the new mean.
ECONOMIC VIABILITY AND FEASIBILITY ASSESSMENT The objective of the financial assessment is to investigate whether the project “needs” and “should” be funded and briefly includes the following steps:
Defining the parameters that will be used for the evaluation
The assessment and forecast of the demand for use of the project
The financial evaluation of the project
The sensitivity/risk analysis for critical parameters of the financial evalu- ation.
Through this analysis, (a) the financial and socio-economic indicators of the project can be derived, (b) the possible rates of possible co-financing of the project, (c) the evaluation of different lending scenarios and (d) the critical variables, that affect the financial viability of the project. The key parameters of the financial evaluation include the time horizon of the analysis, the basic discount rate for the financial analysis, the exact timetable for the implemen- tation and completion and start-up of the scenarios and the assumption of constant prices in the framework of the analysis.
In the context of the financial evaluation, using market development data (passenger traffic) and the details of the considered scenarios, their corre- sponding inputs and outputs during the analysis period are calculated. Using the outflows and inflows for the period of the analysis, a financial evaluation
is carried out on the one hand of the investment (Financial Return on Inve- stment), as well as of its maintainability (Financial Sustainability), and on the other hand of the invested funds of the beneficiary (Financial Return on Capi- tal), for the time horizon of the project to its completion. For this purpose, the differential inputs and outputs of the alternative scenarios compared to the basic one are used. Both the financial evaluation of the investment and the invested funds are subject to sensitivity analysis and risk analysis of their key parameters. Overall, the financial analysis determines the amount of fun- ding and assesses the financial viability and benefit of the investment from the beneficiary’s side. The following indicators are determined for specific discount rates: (a) the net present value (NPV) of the project, and (b) the benefit-cost ratio and the internal rate of return (IRR) (if defined). With sen- sitivity analysis, the value of which is modified by a certain percentage, and the change in the evaluation indices is examined.
In general, it is considered that a change of at least 5% in some index, which is due to a 1% change in size, makes the size critical. The contractor will choose a number of parameters of the financial evaluation (discount rate, demand, inputs, outputs per category) and will investigate the effects of these changes on the financial and economic indicators of the project. It is noted that the sensitivity analysis will reveal the most sensitive vari- ables of the financial assessment, which, as long as they are characterized by high uncertainty (based on international experience), will be included in its risk analysis. The risk analysis again concerns the possibility of a change in the critical dimensions of the project. Thus, based on appropriate probability distributions on the critical variables, probability distributions for the financial and economic performance indicators can be calculated. Specifically, Monte Carlo simulation is used to generate prices of financial and economic indicators, considering triangular distributions of the pro- bability of price change and reasonable assumptions about the minimum, most likely and maximum value of the distribution. From the above pro- cess, the chances of significant diversification of the financials and indicators (and possibly failure of the investment) will arise, for changes in the critical variables.
The sustainability analysis performed was based on the assumption that the base (start) year is 2019, the project has a 12-year horizon (last year of analysis 2031) and with real (constant) base year 2019 prices, for which data were available, as well as a base discount rate of 4%. City buses have a maximum lifespan of 12 years (Federal Transit Administration, 2007) (the average lifespan in the EU is 12 years (CIVITAS, 2013)), while supply and delivery will take place immediately (within a year - base). The project’s Value Added Tax is not eligible.
PROCUREMENT SCENARIOS Two basic bus procurement scenarios are being considered as follows: Scenario A: Supply of two (2) autonomous electric buses to serve passenger traffic on Linear Route B (City Terminal – Intercity Bus station). Based on
A Research Approach for Studying the A Priori Acceptance 151
the above, the estimated daily passenger traffic for this line is 200 passenger- s/day (year 2019), and constitutes 50% of the existing passenger traffic. The operating frequency of the buses will be 6 crossings per hour (crossing every 10 minutes). Scenario B:
1. Supply of one (1) autonomous electric bus to serve passenger traffic on Linear Route A (City Terminal - University). Based on the above, the estimated daily passenger traffic for the line this is 100 passengers/day (year 2019), and constitutes 50% of the existing passenger traffic. The bus frequency will be 5–6 routes per hour (every 11 minutes). 2. Supply of two (2) autonomous electric buses to serve passenger traf- fic on Linear Route B (City Terminal – Intercity Bus Station). Based on the above, the estimated daily passenger traffic for this line is 200 pas- sengers/day (year 2019) for the Intercity Bus station, and constitutes 50% of the existing passenger traffic. The operating frequency of the buses will be 6 routes per hour (every 10 minutes). These two scenarios are evaluated in terms of their financial viability.
From the scenarios investigated, it emerged that for the scenario of the supply of two (2) autonomous electric buses to serve passenger traffic on Linear Route B with an estimated daily passenger traffic of 200 passen- gers/ day (year 2019) and frequency of operation of the buses 6 routes per hour (every 10 minutes) inputs exceed outputs, with this scenario having the advantage of scenario B which assumes the supply of one (1) autono- mous electric bus to serve the passenger traffic on Linear Route A (frequency 5–6 routes/hour) and 2 autonomous electric buses to serve passenger traf- fic on Linear Route B (frequency 6 routes/hour). However, Scenario B has proportionally smaller additional revenues and costs, and Scenario B is fina- ncially viable. Furthermore, the operation of the buses can offset the costs of operation and maintenance and the operation of the buses is financially autonomous.
The sensitivity analysis showed that financial performance of both scena- rios is highly sensitive to passenger traffic and operating costs. Nevertheless, even a change of these parameters towards the worst up to 10% leads to posi- tive financial results. In any case, however, especially with regard to passenger traffic (which is the most sensitive parameter to external influences), emph- asis should be placed on remaining at the (conservative in any case) levels of the present estimates exposure, so as not to jeopardize the financial balance of the investment. This practically means that there should be appropriate actions to promote autonomous buses, but also to maintain and improve their attractiveness, thus correlating the financial sustainability study with user acceptance (Wahl, R et al., 2007).
CONCLUSION
In this paper, the description of the characteristics of the proposed solution ARTS integration into the urban transport network of the city of Trikala within the framework of the AVINT program was presented. In summary, the following topics were investigated:
The assessment of the public acceptance as regards the operation of a public transportation line with autonomous mini buses
The travel demand prediction that will be undertaken by the new mean and according to specific destinations.
The financial viability analysis of the new transportation mean line and its dependence to the travel demand, thus user engagement and acceptance.
In order to assess the acceptance of the new transportation mean, the recor- ding of the citizens’ characteristics and preferences has been performed by using survey questionnaires which include three distinct parts: i) scenarios of transport mean selection, ii) demographic characteristics, and iii) transporta- tion profile. These have been distributed to two different important in terms of mobility, locations of the city. The collected data were first analyzed with the help of descriptive statistics tools, while appropriate econometric models (Multinomial logit models – MNL) are then used, through which the sele- ction factors of autonomous vehicles were identified and the number of their potential users has been estimated.
Results shown that from the 22% of the participants who are interested in the new service, the selection of transportation mean between public tran- sportation with conventional mini bus and autonomous vehicle is highly relevant to cost, waiting time and travel time. An increase in these variables leads to a decrease in the utility and selection possibility of the mean. The con- stant for autonomous vehicle choice is negative and statistically significant. Results have been correlated to the a posteriori analysis conducted within the framework of the Citymobil2 project and several similarities noticed. This led to the optimized specification of the service with the autonomous fleet based on user preferences and attitudes within the framework of the project. Furthermore, taking into account the existing demand for com- muting by public transport in the city of Trikala at the selected scenarios, routes and locations as well as the demand that will be assumed by the new service, it emerged that users are willing to pay approximately 25% extra for the autonomous fleet service to reduce the waiting time as well as the travel time.
Finally, an economic sustainability analysis of the service with autonomous vehicles has been performed based on the assumption that the project has a 12-year horizon (2019-2031). As regards financial autonomy, it was exami- ned whether the revenues from the operation of the autonomous vehicles can offset the costs of operation and maintenance and it emerged that the ope- ration of them is financially autonomous. However, according to sensitivity and risk analysis of the investment it derived that user acceptance it is of great importance as it significantly determines the travel demand. Consequ- ently, there should be appropriate actions to promote autonomous mobility, but also to maintain and improve their attractiveness.
ACKNOWLEDGMENT
This work is a part of the AVINT project under grant agreement no 04395.
A Research Approach for Studying the A Priori Acceptance 153
REFERENCES
Ben-Akiva M., (2007). Discrete Choice Analysis: Predicting Demand and Market Shares, The MIT Press. Ben-Akiva, M., & Lerman, S. R. (1985). Discrete Choice Analysis: Theory and
Applications Travel Demand. The MIT Press, Cambridge. CIVITAS (2013). Smart choices for cities: Clean buses for your city. Policy Paper, TNO, EU. Elisabetta Cherchi, & David A. Hensher, (2015). Workshop Synthesis: Stated Prefe-
rence Surveys and Experimental Design, an Audit of the Journey so far and Future Research Perspectives, Transportation Research Procedia„ Volume 11, 154–164. Federal Transit Administation (2007). Useful Life of Transit Buses and Vans. Report No. FTA VA-26-7229-07.1, Washington DC, USA. Federov, V. V. (1972). Theory of optimal experiments. Academic Press, N. Y. Hensher, D. A., Rose, J. & Greene, W. H. (2005). The implications on willingness to
pay of respondents ignoring specific attributes. Transportation 32, 203–222. Madigan, R., Louw, T., Wilbrink, M., Schieben, A., & Merat, N. (2017). What influences the decision to use automated public transport? Using UTAUT to under- stand public acceptance of Automated Road Transport Systems. Transportation Research Part F: Traffic Psychology and Behaviour. 50. 55–64. Mara, M., & Meyer, K. (2022). Acceptance of Autonomous Vehicles: An Overview
of User-Specific, Car-Specific and Contextual Determinants. In: Riener, A., Jeon, M., Alvarez, I. (eds) User Experience Design in the Era of Automated Driving. Studies in Computational Intelligence, vol 980. Springer, Cham. Morpace and Cambridge Systematics (1999). A Handbook for Measuring Customer Satisfaction and Service Quality. TCRP Report 47, Transportation Research Board, National Academy Press, Washington DC, USA. Ortuzar, J., & Willumsen, L. G. (2011). Modelling transport. John Wiley & Sons. Portouli, E., Karaseitanidis, I., Lytrivis, P., Amditis, A., Raptis O., & Karaberi,
C., (2017). Public attitudes towards autonomous mini buses operating in real conditions in a Hellenic city. 571–576. Ritter L. A., & Sue V. M., (2007). The survey questionnaire. New Direct Eval, 115:37–45. Sagir F., & Ukkusuri, S. V., (2018). “Mobility Impacts of Autonomous Vehicle
Systems,” 21st International Conference on Intelligent Transportation Systems (ITSC), pp. 485–490. Smith, T. M. F. (1976). The foundations of survey sampling: A review. Journal of the Royal Statistical Society A, 139, 183–204. Wahl, R., Tørset T., & VaaLarge T. (2007). Large scale introduction of automated
transport Which legal and administrative barriers are present?, Proceedings of the 14th world congress on intelligent transport systems (ITS), Beijing, ITS America publication. Washington, P, Karlaftis, M. G., & Mannering, F. (2010). Statistical and Econometric Methods for Transportation Data Analysis, Second Edition, Chapman and Hall/CRC.
LISTED IN THE AHFE DIGITAL BOOKSTORE CATALOGUE
Explore the complete digital volume
Human Factors in Transportation
Read this individual research paper free through the original publisher, or explore the full digital proceedings book.
ISBN 978-1-958651-71-1
Explore this ISBN in the AHFE Bookstore ↗Listed in the July 2026 bookstore catalogue; search by ISBN to confirm current availability · Digital book purchase optional