Niki Georgiou, Evangelia Portouli, Angelos Amditis (2025). Automated vehicles with communication capabilities: Is there an added impact on traffic efficiency at yield sign-controlled intersections?. In: Human Factors in Robots, Drones and Unmanned Systems. AHFE Open Access, vol. 179, pp. 103–114. https://doi.org/10.54941/ahfe1006379
The present study aimed to evaluate the effects of Automated Vehicles (AVs) with and without communication capabilities on traffic efficiency at yield sign-controlled intersections. When equipped with communication capabilities, the AVs may be able to take earlier decisions on whether they need to yield or not and this may affect, consequently, their travel time and queue formation at the intersection. Detailed models of intersection behaviour were developed for Baseline AVs (that use only their onboard sensors for perception and decision taking) and for Enabled AVs (equipped with communication capabilities). A microscopic simulation study was carried in a yield sign-controlled intersection, with varying traffic volumes and AV penetration rates. The findings support the expectation that the addition of communication capabilities may reduce the travel time and queue length at such intersections. The size of reduction and the number of vehicle routes affected seemed to attenuate as the AV penetration and traffic volume increased. The relation between the number of routes affected and traffic volume was not straightforward.
A lot of research and development efforts have been dedicated to the automation of vehicle technology, motivated by the need to reduce drivers’ errors that are a contributing factor in many road accidents. Vehicles at low levels of automation, i.e. equipped with assistance systems like ACC (Active Cruise Control), are already in circulation, and the focus is on developing vehicles at higher automation levels, that will be able to drive without human supervision.
Besides the expected impact on safety due to the reduction of drivers’ errors, there are indications that automated vehicles (AVs) may have an impact on traffic efficiency. Kesting et al. (2007) note that a 10% increase in ACC-equipped vehicles can reduce maximum delays by approximately 30% and cumulative delays by 50% on a motorway. Ntousakis et al. (2015) report that high penetration of ACC vehicles can improve capacity when their time gap is smaller than that of manual vehicles. Friedrich (2016) concludes
that an AV penetration rate of 100% could increase capacity by about 40% in urban areas and by 80% on highways. James et al. (2019) report that a percentage of 25% of ACC vehicles in the traffic flow can improve the throughput by 4% although with a 100% percentage there is a loss in throughput of 5%. Lu et al. (2020) found a quasi-linear increase in urban road network capacity with higher AV penetration. Tympakianaki et al. (2020) report improvements in capacity and reductions in travel time starting to appear with 10-20% AV penetration which continue as the penetration rate increases, peaking around 60-100%, though potential congestion effects may arise at higher densities. The study by Park et al. (2021) showed that AVs in urban network decreased travel time and delay while increasing speed and these improvements increased with the penetration rate. At 100% AV penetration, the travel time decreased by 17%, the delay reduced by 31% and vehicle speed increased by 21%.
On the contrary, Shladover et al. (2012) conclude that ACC is unlikely to produce any significant change in the capacity of highways showing that the achievable traffic flow is insensitive to the penetration rate of ACC vehicles. Jerath et al. (2012) report that while ACC systems increase critical density, a small proportion of manually-driven vehicles in an ACC-dominated system can trigger traffic instability and is more likely to cause a “phantom” traffic jam. Ntousakis et al. (2015) found that the desired time-gap setting has a direct impact on capacity and when the desired time-gap setting is longer than 1.10–1.20 s, this can lead to a reduced capacity with increasing penetration rates of ACC-equipped vehicles. Calvert et al. (2017) noted that a share of less than 30% of vehicles at low automation level has a small negative effect on capacity of motorways compared to high penetration level of AVs. Mattas et al. (2018) report that the introduction of AVs can negatively affect the network’s performance, even at low penetration rates, because of their larger headways compared to the human drivers’ vehicles and their more conservative behaviour. Almusawi et al. (2022) evaluated different AV driving behaviours on urban signalised intersections, showing that cautious driving by AVs improves safety but results in longer delays.
When AVs only use data from their onboard sensors, their perception capabilities are limited, so they can function reliably only at specific conditions. This is why development efforts focus on integrating communication technologies into AVs to provide information about objects that are not visible by the onboard sensors. With this information, the AVs perception capabilities can be improved, thus enabling the vehicles’ reliable operation under more conditions. These communication capabilities may have an additional impact on traffic efficiency. Van Arem et al. (2006) report that an ACC that can communicate with other vehicles or with a traffic centre, contributes to improved traffic flow performance on highways, particularly at high-traffic volumes, when significant portions of the fleet (> 60%) are equipped. Similarly, Shladover et al. (2012) concluded that ACC with communication capabilities at higher penetrations is able to increase lane capacity up to about 4000 vehicles per hour (veh/h) on a motorway corridor, while ACC without such capabilities is not expected to have an impact. Mattas et al. (2018) report that at high penetration rates and high
Automated Vehicles With Communication Capabilities 105
level of demand, AVs with communication showed benefits on a ring road, as they can form platoons and support higher average speeds, while at low penetration rates they have small negative results. Liu et al. (2024) examined the performance of mixed traffic flows at signalized intersections under different penetration rates of AVs with communication capabilities and conclude that higher AV penetration rates reduce average delays and stop times, making the flow smoother.
Given the resources required to integrate communication technologies into AVs, an open question is whether these additions would result in additional benefits compared to AVs without such capabilities. Still, we have found few studies that specifically compare AVs with and without communication capabilities, such as those by Mattas et al. (2018) and Makridis et al. (2020), who studied AVs on a ring road and Shladover et al. (2012) and Dong et al. (2023), who studied ACC equipped vehicles. This knowledge gap is particularly pronounced for AVs at higher automation levels and complex urban scenarios, such as unsignalized intersections, where the driver decisions on gap acceptance and yielding behaviour significantly influence the overall traffic dynamics. The present study aimed to address this gap by comparing the impact of AVs with and without communication capabilities on traffic efficiency at yield sign-controlled intersections.
METHODOLOGY
The assumption of this research was that AVs with communication capabilities, having a perception at greater distances from the intersection, would be able to take earlier decisions on whether they need to yield or not. It was expected that this would improve traffic efficiency compared to AVs whose perception relies solely on data from onboard sensors, which have a more limited range and are subject to obstructions.
The work was carried out within the framework of the Hi-DRIVE research project1 that develops technologies for the deployment of AVs at high levels of automation. The study adopted a microsimulation approach using the Vissim traffic simulation software. Two dedicated driving models for AVs, with and without communication capabilities, were designed and developed using Vissim’s External Driver Model and were implemented as DLL files.
The Baseline AV model simulated AVs that rely solely on their onboard sensors for environment perception. The Enabled AV model simulated AVs with integrated communication capabilities that provide data about approaching vehicles at distances greater than those provided by the onboard sensors. Both AV models used a car-following module developed in the Hi-DRIVE project. For the present study, the authors developed a yield sign- controlled intersection model to simulate the complex behavior of AVs at yield sign-controlled intersections focusing on the many challenges posed by multiple conflict areas. This model takes into account potential conflicts with vehicles approaching the intersection from other road links and generates decisions on whether the AV should yield or proceed.
1https://www.hi-drive.eu/
Baseline AV Model at a Yield Sign-Controlled Intersection When approaching an intersection, where yielding is required, the Baseline AV follows a controlled deceleration profile. It initially decelerates with a comfortable rate of -1.5 m/s2, so that its speed is reduced to approximately 10 km/h at 1.0 m upstream of the first conflict area of the intersection, where it can reliably detect approaching vehicles on other links via its onboard sensors. At this point, if the Baseline AV does not identify a conflict with an approaching vehicle for any of the conflict areas in the intersection, it accelerates smoothly with a comfortable rate of 2.5 m/s2, otherwise it decelerates and comes to a complete stop before the intersection. After the Baseline AV has stopped, it begins assessing the flow of approaching conflicting vehicles for an adequate gap, so that it can cross or turn with the rate of 2.5 m/s2, before the first conflicting vehicle enters. When adequate gaps are available for all conflict areas in the intersection, the Baseline AV initiates its crossing or turning maneuver.
Enabled AV Model at a Yield Sign-Controlled Intersection Via its communication capabilities, the Enabled AV can overcome the onboard sensors limitations. Therefore, it can take reliable decisions about yielding or not earlier than the Baseline AV, thus eliminating the need for unnecessary deceleration when approaching the intersection. The messages exchanged periodically between connected vehicles are being specified by international standardization bodies. The messages contents include the vehicle’s position, kinematics, map of perceived objects and others.
Starting from the distance where it would be possible to stop before the intersection with the comfortable rate of −1.5 m/s2, the Enabled AV checks for conflicts with approaching vehicles on other links. If the time required by the Enabled AV to pass each conflict area is shorter than the time required by the first conflicting vehicle to enter it, the Enabled AV continues without stopping. However, if the calculated time to pass the conflict area is greater than the time required by the first conflicting vehicle to enter for at least one of the yielding conflict areas, the Enabled AV decelerates and stops before the intersection. Following a complete stop, the Enabled AV re-evaluates the situation for adequate gaps, in the same way like the Baseline AV.
Network Set-Up The simulated network consisted of one intersecting major and one minor road, the latter featuring yielding signs at the intersection. Both the major and minor roads were two-way roads with one lane of 3.5 m width per direction. The length of each link was 500 m, which means that each vehicle had to travel the same distance of 1000 m. Both left and right turns were allowed from each link, resulting in 12 distinct vehicle movements. The distribution of these movements per link was as follows: 70% of vehicles proceeded straight, 20% performed right turns and 10% performed left turns. Four queue counters were set on all links upstream of the intersection. Vehicles on the minor links and vehicles on the major links intending to turn left had to yield, if needed.
Automated Vehicles With Communication Capabilities 107
As our interest was on urban intersections, the Wiedemann 74 model of Vissim was used to replicate the driving behavior of manually-driven vehicles (MVs). The speed limit was set at 50 km/h. The desired speed of MVs ranged from 48 km/h to 58 km/h. The desired speed of AVs was fixed at 50 km/h.
The traffic flow was mixed consisting of MVs (passenger cars and heavy vehicles) and AVs. The percentage of heavy vehicles was always set at 4% of the traffic volume.
Scenarios and Runs The simulation runtime was set to 1 hour, including a 5-minute warm- up period. The simulations were run with varying volume levels on the major links and different penetrations of the two AV variations, Baseline or Enabled AVs. Each run included only one AV variation. The traffic volume on the major links was set at 200, 400, and 600 veh/h, representing low to high volumes for the specific network. The volume on the minor links was consistently set at 100 veh/h. The AV penetration rate was set at 10%, 30%, and 50% of the passenger car volume. This resulted in 18 scenarios (Volume x AV Penetration x AV variation). All simulation scenarios were executed 20 times with different seed numbers.
Indicators and Analysis The Travel time needed by each individual vehicle to drive the distance of 1000 m and the Queue length were used as basis for the analysis. For our analysis, the vehicles routes were grouped as “On major link – going straight (Ma-GS)”, “On major link – turning left (Ma-TL)”, “On major link – turning right (Ma-TR)”, “On minor link – going straight (Mi-GS)”, “On minor link – turning left (Mi-TL)”, “On minor link – turning right (Mi-TR)”.
For each simulation run the mean Travel time was calculated for each route, for the AV vehicles only and for the total flow, and the mean and maximum Queue length per link type. A comparison was made between the Travel time of Enabled vs Baseline AVs, to assess the effect of communication capabilities on the performance of these vehicles. Additionally, comparisons were made of the total flow Travel time, as well as the mean and maximum Queue length, when each AV variation was included. The Student’s t-test was used to evaluate if any differences are statistically significant.
RESULTS
In the following, the statistically significant results are presented. For the lower volume on the major links (200 veh/h), there was a significant effect of the AV variation on the AVs mean Travel time. As the AV penetration increased, there were effects on more routes (Table 1). Specifically, for the 10% penetration there was a significant effect for 3 out of 6 routes (Mi-GS, Mi-TR, Ma-TL), for the 30% penetration there was a Travel time reduction in 4 out of 6 routes (Mi-GS, Mi-TR, Ma-TL, Ma-TR) and in all 6 routes for the 50% penetration. Results are similar when comparing the Travel time of the total flow. There were significant effects for all 6 routes for the 50% AV penetration, for 4 out of 6 routes for the 30% penetration and only for vehicles on the minor link going straight for the 10% penetration.
Table 1: Mean travel time (s) and standard deviation (in parenthesis) for 200 veh/h on major links.
Table available in the original PDF paper.
Total flow (MVs + AVs) AVs Baseline AVs Enabled AVs p Baseline AVs Enabled AVs p
50% AVs Ma-GS 71.02 (0.39) 70.95 (0.37) < 0.01 72.72 (0.35) 72.64 (0.34) < 0.01 Mi-GS 80.36 (1.27) 77.72 (1.34) < 0.01 83.57 (1.58) 78.63 (1.97) < 0.01 Ma-TL 77.61 (1.61) 76.95 (1.60) < 0.01 82.98 (1.87) 81.35 (1.77) < 0.01 Mi-TL 83.11 (3.57) 81.76 (3.45) < 0.01 86.71 (4.84) 84.35 (4.19) < 0.01 Ma-TR 76.32 (0.77) 76.28 (0.77) < 0.05 79.70 (0.26) 79.66 (0.19) < 0.05 Mi-TR 79.01 (1.31) 78.17 (1.19) < 0.01 81.89 (1.67) 80.50 (1.26) < 0.01 The runs with the volume of 400 veh/h on the major links reveal similar results (Table 2). At the 50% and 30% AV penetrations, the Travel time of Enabled AVs was lower than that of Baseline AVs for all routes except from the route where AVs are on the minor link and turn left. For the 10% AV penetration there was a reduction only for the route where AVs are on the minor link and go straight.
There was a similar beneficial effect also for the Travel time of the total flow. It was lower when the flow included Enabled AVs than when it included Baseline AVs in all routes for the 50% penetration, in 4 out of 6 routes (except from left and right turns from the minor link) for the 30% penetration, and in only 1 route (vehicles on the minor link going straight) for the 10% penetration.
Table 2: Mean travel time (s) and standard deviation (in parenthesis) for 400 veh/h on major links.
Table available in the original PDF paper.
Total flow (MVs + AVs) AVs Baseline AVs Enabled AVs p Baseline AVs Enabled AVs p
Automated Vehicles With Communication Capabilities 109
Table 2: Continued
Table available in the original PDF paper.
Total flow (MVs + AVs) AVs Baseline AVs Enabled AVs p Baseline AVs Enabled AVs p
50% AVs Ma-GS 75.79 (8.34) 73.09 (0.99) < 0.05 77.10 (9.32) 74.25 (0.89) < 0.05 Mi-GS 99.10 (16.63) 89.88 (4.42) < 0.01 107.42 (20.96) 95.18 (6.20) < 0.01 Ma-TL 85.45 (11.69) 81.36 (2.52) < 0.05 91.22 (12.01) 86.40 (3.68) < 0.01 Mi-TL 100.68 (18.80) 96.39 (11.71) < 0.05 108.92 (23.27) 104.92 (17.8) ns Ma-TR 80.55 (7.96) 77.97 (1.11) < 0.05 84.03 (9.61) 81.10 (1.23) < 0.05 Mi-TR 91.30 (21.39) 84.45 (5.83) < 0.05 94.78 (22.49) 86.89 (5.71) < 0.05 The findings are a bit different for the higher volume of 600 veh/h on the major links (Table 3). There was a significant reduction of the Travel time of the Enabled compared to the Baseline AVs for all routes for the 50% penetration. But for the 10% and 30% penetration rates there were effects on only 1 out of 6 routes (vehicles on the major link turning left). Similarly, the Travel time of the total flow was significantly lower for all 6 routes for the 50% penetration, but there was no effect of the AV variation on any route for the 30% penetration and only for 1 route (going straight on the major links) for the 10% penetration.
Table 3: Mean travel time (s) and standard deviation (in parenthesis) for 600 veh/h on major links.
Table available in the original PDF paper.
Total flow (MVs + AVs) AVs Baseline AVs Enabled AVs p Baseline AVs Enabled AVs p
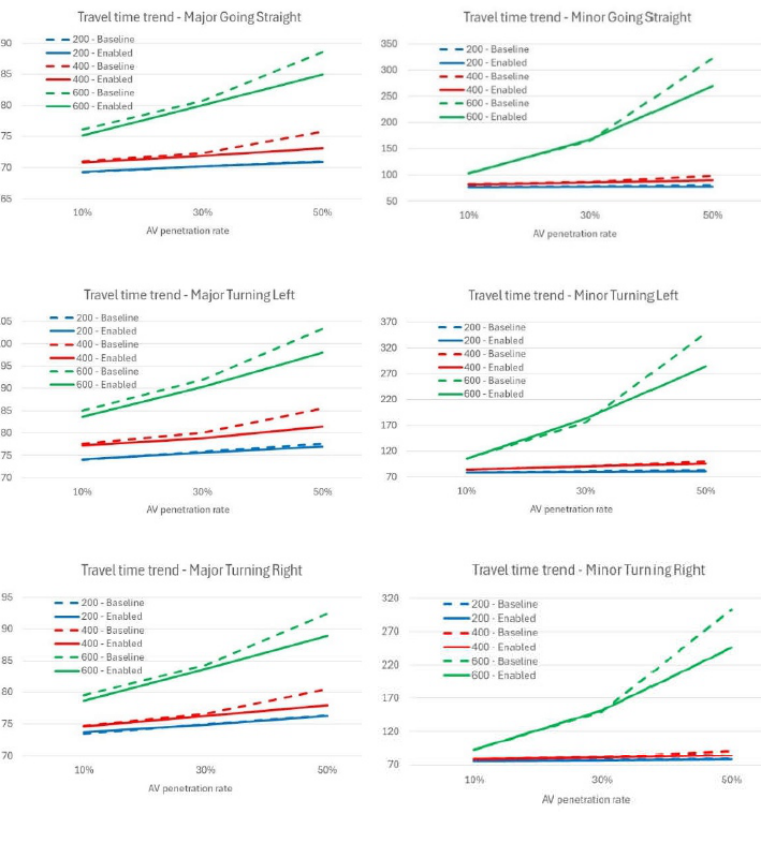
To visualize the size of impact of the AV variation on the Travel time versus AV penetration rates and volume, the Travel time trends for all routes are presented in Figure 1. Although not all findings are significant, the Travel time is consistently lower when the flow included Enabled compared to Baseline AVs. The higher AV penetration rate resulted in higher Travel time reduction. Under lower volumes, the difference in Travel time was lower. However, as the traffic volume on the major links increased, a clearer distinction was observed, with flows including Enabled AVs achieving lower
travel times by more than 16% for all minor link routes for the 600 veh/h and 50% penetration scenario.
Figure 1: Travel time trend (s) for the total flow.
Table 4 presents the mean and maximum Queue length per scenario. There were reductions in the mean and maximum Queue length for both major and minor links when the penetration was 30% or 50% and the volume 200 or 400 veh/h. For the medium volume of 400 veh/h there was a significant reduction of the maximum length on major links for the low penetration of 10% too. For the high volume (600 veh/hour) there were reductions only for the high penetration of 50% on the mean Queue length for both link types and on the maximum length on major links.
Automated Vehicles With Communication Capabilities 111
Table 4: Mean and maximum queue length (in m) per volume and AV penetration.
Table available in the original PDF paper.
Queue Length Mean Queue Length Max Volume % AV Link Baseline AV Enabled AV P Baseline AV Enabled AV p
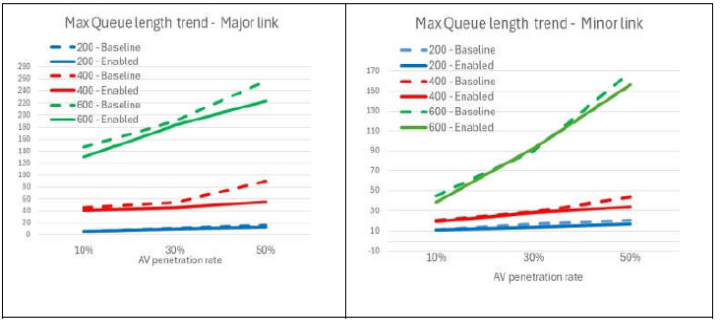
Figure 2 presents a graph of the trends of the maximum Queue length per scenario and link type. Consistently, the maximum length is lower when the flow includes Enabled AVs than when it includes Baseline ones. The figure visualises that the bigger reductions were found in the medium and higher volumes of 400 and 600 veh/h, and the lowest reduction in the low volume.
Figure 2: Maximum queue length (m) trends.
DISCUSSION
This microsimulation study aimed to assess whether equipping AVs with communication capabilities would impact the traffic efficiency of unsignalised urban intersections. Detailed models of yield sign-controlled intersection behaviour were developed for Baseline AVs, which rely solely on their onboard sensors for perception and decision taking, and for Enabled AVs, that are equipped with communication capabilities and can perceive vehicles at greater distances.
The findings of this study support the expectation that the addition of communication capabilities may reduce travel time and queue length at yield sign-controlled intersections. This could be the result of the different behaviour of AVs when approaching the intersection. The Enabled AVs, having earlier information about approaching vehicles from other links, do not always need to decelerate to a very low speed when approaching an intersection from a minor link, unlike the Baseline AVs. Instead, if they detect an acceptable gap, they continue. This behaviour has a cascading effect on the overall flow, as it also influences their following vehicles that would need to decelerate to a very low speed if they are following a Baseline AV. A similar effect occurs on the major links, although the reductions in travel time were smaller than those found for the minor links, if the vehicles on the major link are following an AV intending to turn left. If the latter is a Baseline AV, the following vehicles must stop and restart. On the contrary, if it is an Enabled AV, which does not need to stop, the following vehicles on the major link can continue without stopping.
Considering only the significant results, the percentage reduction in Travel time and maximum Queue length increased with AV penetration and traffic volume on the major links. As regards the number of effects, more routes were affected as the AV penetration increased (Table 5). At 50% penetration, there was a significant reduction in Travel time for the total flow across all 6 routes, while at 10% penetration a reduction was found in only 1 route. The findings do not indicate a clear relation between the number of routes affected (Travel time of the total flow) and the volume on the major links. At 10% penetration there was a reduction in only 1 route for all three volumes studied. At 50% penetration there was a reduction for all 6 routes for all volumes. At 30% penetration, there was a reduction for 4 routes for the volumes of 200 and 400 veh/h but no significant effect on any route for the 600 veh/h. An explanation could be that at such high volumes (600 veh/h) on the major link, the Enabled AVs cannot find an acceptable gap. However, as AV penetration increases, the characteristics of the traffic flow change. AVs have more conservative driving behaviour than MVs, with larger headways, and as a result, at 50% AV penetration, these conservative behaviours create more gaps in the traffic flow at the intersection, allowing the Enabled AVs to merge more easily. In contrast, at lower AV penetration levels (e.g., 30%), the number of AVs in the flow is insufficient to create the necessary gaps, which explains the absence of effects at 30% and 600 veh/h. This change in the traffic flow characteristics can also be a reason why more routes are affected and the reductions in travel time and queue length are greater with higher AV penetration and increased traffic volume.
Automated Vehicles With Communication Capabilities 113
Table 5: Number of routes with significant travel time reductions.
In conclusion, this study provides some evidence that the addition of communication capabilities on AVs can have a positive impact on traffic efficiency at yield sign-controlled intersections, as it reduces travel time and queue length under several conditions. The findings have to be verified in the future using more accurate models of the AVs driving behaviour and more reliable representation of their communication capabilities at yield sign- controlled intersections and in more urban setups with different percentage of vehicle routes, geometry and number of lanes. A similar modelling approach can be implemented in other yielding type patterns, such as 4-way stops, in order to study possible effects of communication capabilities on efficiency.
ACKNOWLEDGMENT
The authors would like to thank all partners within the Hi-Drive project for their cooperation and valuable contribution. This project has received funding from the European Union’s Horizon 2020 research and innovation programme under grant agreement No. 101006664. The sole responsibility of this publication lies with the authors. Neither the European Commission nor CINEA – in its capacity of Granting Authority – can be made responsible for any use that may be made of the information this document contains.
REFERENCES
Almusawi, A., Albdairi, M., and Qadri, S. S. S. M. (2024). Integrating Autonomous Vehicles (AVs) into Urban Traffic: Simulating Driving and Signal Control. Applied Sciences, 14(19), p. 8851. Calvert, S. C., Schakel, W. J., and van Lint, J. W. C. (2017). Will Automated
Vehicles Negatively Impact Traffic Flow? Journal of Advanced Transportation, p. 3082781. Dong, J., Luo, D., Gao, Zh., Wang, J., Chen, L. (2023). Benefit of connectivity on promoting stability and capacity of traffic flow in automation era: An analytical and numerical investigation, Physica A: Statistical Mechanics and its Applications, 629, p. 129170. Friedrich, B. (2016). The Effect of Autonomous Vehicles on Traffic. In: Maurer, M.,
et al. (Eds.), Autonomous Driving. pp. 317–334. James, R. M., Melson, C., Hu, J. and Bared, J. (2019). Characterizing the Impact of Production Adaptive Cruise Control on Traffic Flow: An investigation. Transportmetrica B: Transport Dynamics, 7(1), pp. 992–1012. Jerath, K., and Brennan, S. N. (2012). Analytical Prediction of Self-Organized Traffic
Jams as a Function of Increasing ACC Penetration. IEE Transactions on Intelligent Transportation Systems, 13(4), pp. 1782–1791.
Kesting, A., Treiber, M., Schönhof, M., Kranke, F., and Helbing, D. (2006). Jam- Avoiding Adaptive Cruise Control (ACC) and its Impact on Traffic Dynamics. In: Helbing, D. (Ed.), Proceedings of the Sixteenth Annual Symposium of the International Council on Systems Engineering. pp. 634–643. Liu, H.; Niu, K.; Wang, H.;Wu, Z.; Song, A. (2024). Analysis of Mixed Traffic Flow
Characteristics Based on Fleet Composition. Symmetry, 16(7), p. 865. Lu, Q., Tettamanti, T., Hörcher, D., and Varga, I. (2020). The impact of autonomous vehicles on urban traffic network capacity: An experimental analysis by microscopic traffic simulation. In: Transportation Letters, 12(8), pp. 540–549. Makridis, M. Konstantinos Mattas, Caterina Mogno, Biagio Ciuffo, Georgios
Fontaras (2020). The impact of automation and connectivity on traffic flow and CO2 emissions. A detailed microsimulation study, Atmospheric Environment, 226, 117399. Mattas, K., Makridis, M., Hallac, P., Raposo, M. A., Thiel, C., Toledo, T. and Ciuffo, B. (2018). Simulating Deployment of Connectivity and Automation on the Antwerp Ring Road. IET Intelligent Transport Systems, 12(9), pp. 1036–1044. Ntousakis, I. A., Nikolos, I. K. and Papageorgiou, M. (2015). On Microscopic
modelling of Adaptive Cruise Control Systems. Transportation Research Procedia, 6, pp. 111–127. Park, J. E., Byun, W., Kim, Y., Ahn, H., and Shin, D. K. (2021). The Impact of Automated Vehicles on Traffic Flow and Road Capacity on Urban Road Networks. In: Journal of Advanced Transportation. 2021, Article ID 8404951. pp. 1–10. PTV Group, Vissim 2023 user manual, 2023. Shladover, S. E., Su, D. and Lu, X. Y. (2012). Impacts of Cooperative Adaptive Cruise
Control on Freeway Traffic Flow. Transportation Research Record: Journal of the Transportation Research Board, No. 2324, pp. 63–70. Tympakianaki, A., Nogues, L., Casas, J., Brackstone, M., Oikonomou, M. G., Vlahogianni, E. I., Djukic, T., & Yannis, G. (2022). Autonomous Vehicles in Urban Networks: A Simulation-Based Assessment. Transportation Research Record, 2676(10), 540–552. Van Arem, B., van Driel, C. J. G., and Visser, R. (2006). The Impact of Cooperative
Adaptive Cruise Control on Traffic-Flow Characteristics. IEEE Transactions on Intelligent Transportation Systems, 7(4), 429–436.
LISTED IN THE AHFE DIGITAL BOOKSTORE CATALOGUE
Explore the complete digital volume
Human Factors in Robots, Drones and Unmanned Systems
Read this individual research paper free through the original publisher, or explore the full digital proceedings book.
ISBN 978-1-964867-55-7
Explore this ISBN in the AHFE Bookstore ↗Listed in the July 2026 bookstore catalogue; search by ISBN to confirm current availability · Digital book purchase optional