Hongyu Hu, Yunhan Liang, Xinying Liang, Xuelian Zheng (2025). The effect of AR HUD on enhancing the driver's trust in automated vehicles operation under high-risk scenarios. In: Advances in Human Factors of Transportation. AHFE Open Access, vol. 186, pp. 361–371. https://doi.org/10.54941/ahfe1006525
With the continuous development of intelligent vehicle technology, Augmented Reality Head Up Display (AR HUD), as a new type of human-machine interaction interface, is gradually being applied to automated vehicles. AR HUD provides drivers with intuitive, real-time driving information by seamlessly integrating virtual images with the real road environment, significantly improving driving safety and comfort. The guidance function of AR HUD can not only prompt obstacles, but also effectively reduce the cognitive burden during driving. This paper investigates the effect of AR HUD on the driver's interaction responses in emergency obstacle avoidance scenarios during automated driving mode. First, we built a Level 2 automated vehicle model in a driving simulator environment. A collision scenario was built between the automated vehicle and the motorcycle at the un-signaled intersection. Secondly, we developed three HMI information reminder modes for traffic conflicts during the automated driving operation, namely baseline type, risk-alert type, and AR HUD risk visualization type. 8 subjects were recruited to conduct our experiment to analyze what type of information presentation would give drivers more confidence to let the automated vehicle run autonomously without takeover when it driving in conflict scenarios.
With the rapid advancement of automotive technology, automated driving systems are gradually transforming traditional driving methods (Xu, 2020). However, the AVs are still likely to remain in the stage of human–machine collaborative driving for a prolonged period (Ma and Zhang, 2024). The level of trust that drivers place in automated driving systems directly affects both system effectiveness and overall safety (Azevedo-Sa et al., 2021; Manchon et al., 2022). As an innovative human-machine interaction interface, Augmented Reality Head-Up Display (AR HUD) seamlessly integrates virtual information into the real road environment, offering new possibilities for enhancing driver trust in automated driving systems (Schömig et al., 2018).
Driver trust is a critical factor in automated driving systems. Studies have shown that a lack of trust in the system often leads to excessive takeover
behavior, which not only reduces the efficiency of automated driving but may also introduce additional safety risks (Pan et al., 2023). This is particularly crucial in high-risk scenarios, such as emergency obstacle avoidance, where the driver’s level of trust significantly impacts the system’s normal operation. If drivers can appropriately trust the system’s decision-making capabilities and allow it to operate autonomously within its designed scope, the advantages of automated driving technology can be more effectively realized (Ma and Zhang, 2021).
Driver perception of risk plays a crucial role in the trust-building process. Perceived risk reflects the level of risk experienced by automated driving users, which may differ from the actual risk (Griffin et al., 2020). In recent years, extensive research has been conducted on the relationship between perceived risk and trust. According to Hoff and Bashir’s trust model (Hoff and Bashir, 2015), situational trust is formed and adjusted based on the driver’s perception when interacting with an automated driving system (ADS). Hu et al., (2024) hypothesized that perceived risk hinders driver trust and proposed a trust estimation framework based on perceived risk and driver behavior characteristics. He et al., (2022) evaluated drivers’ perceived risk and trust levels under SAE Level 2 automated driving conditions when encountering cut-in and hard-braking vehicles. Their findings indicate a strong correlation between perceived risk and trust, with both sharing similar determining factors. Since drivers are not directly engaged in the driving task, they may misinterpret traffic risks in complex scenarios (Qu et al., 2023). Therefore, designing appropriate human-machine interaction interfaces to help drivers develop an accurate perception of risk is essential for fostering a healthy human-machine trust relationship.
During L2 automated driving, while the system handles basic vehicle control tasks such as steering and speed adjustment, drivers must remain vigilant and ready to take over control at any time (SAE International, 2021). This dual-task requirement of monitoring both the driving environment and the automation system creates unique challenges for information processing and situation awareness (Avetisyan et al., 2022). Traditional in-vehicle information display systems primarily rely on dashboards and central control screens. However, these conventional display methods often suffer from low information retrieval efficiency and high cognitive load. In complex driving scenarios, drivers must quickly acquire and process large amounts of information, and the limitations of traditional displays may undermine their trust in the system (Kim et al., 2024). In contrast, AR HUD projects critical information directly into the driver’s field of view, enabling natural information presentation and real-time interaction, which presents a promising solution (Detjen et al., 2021; Xia et al., 2023).
AR HUD offers distinct advantages in automated driving scenarios. First, it intuitively displays potential hazards and system decision-making intentions, helping drivers better understand system behavior. Second, by minimizing the need for gaze shifts and reducing cognitive load, AR HUD enhances drivers’ situational awareness. Finally, real-time visual feedback can strengthen drivers’ confidence in the system, fostering more effective human-machine collaboration (You et al., 2024). Despite these advantages, there is still a
The Effect of AR HUD on Enhancing the Driver’s Trust in Automated Vehicles Operation 363
lack of systematic research on how AR HUD can enhance driver trust in automated driving systems under challenging conditions (Kettle and Lee, 2022).
METHODOLOGY
Participants A total of eight drivers (five males and three females) participated in the driving simulator experiment. The participants were between 20 and 29 years old, with an average age of 22. All participants had held a valid driver’s license for at least one year, were in healthy state. Upon completion of the experiment, each participant received a compensation of 50 RMB.
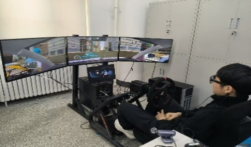
Apparatus This study utilized a fixed-base driving simulator consisting of a triple-screen display with a resolution of 1920 × 1080, an instrument panel screen, a Logitech G27 steering wheel, a set of accelerator and brake pedals, and a driver’s seat, as shown in Figure 1(a). Participants’ eye-tracking data were collected using the Tobii Pro Glasses 3 (Figure 1(b)), a head-mounted eye tracker developed by Tobii, which allows for precise recording of gaze behavior.
(a) Driving simulator. (b) Eye-tracking data collection.
Figure 1: Experiment setup.
Experimental Scenario The experimental scenario was developed using Unity, simulating an urban environment with bidirectional three-lane roads. The weather was set to clear. The ego vehicle traveled at a constant speed of 40 km/h on a 4.2 km straight road segment leading to an unsignalized intersection, where it executed left or right turns.
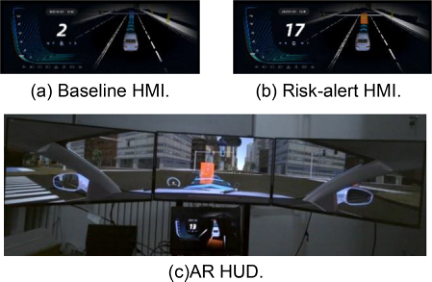
Three types of HMI information display modes were designed and implemented, as shown in Figure 2. The baseline mode featured an instrument panel that displayed only basic driving information including vehicle speed and simple icons representing surrounding traffic participants. The risk-alert mode enhanced the instrument panel by incorporating a color- coded risk warning system based on time-to-collision (TTC) thresholds. Following the risky thresholds in (Mahmud et al., 2017), the system used red indicators for critical situations (TTC ≤1s), orange for moderate risk (1s < TTC ≤2s), and green for low risk (2s < TTC ≤3s). The AR HUD display
mode utilized a head-up display to project the same risk-coded information directly onto the driver’s forward field of view, overlaying warning indicators on the actual traffic participants.
Two risk conditions were designed to evaluate driver responses: a low-risk condition where the TTC consistently remained above 2s, and a high-risk condition where the TTC dropped below 1s during the turning maneuver, followed by ego vehicle braking to maintain a TTC above 2s.
Figure 2: HMI information display modes.
Experimental Procedure The experimental procedure consisted of several stages. Before the formal experiment, participants were given 10 minutes to acclimate to the environment and familiarize themselves with the simulator, during which they wore the eye tracker and completed the calibration process.
The experiment employed a Latin square design to counterbalance the presentation order of the three HMI modes. For each mode, participants experienced four experimental conditions, consisting of different combinations of two risk levels and two road scenarios. They were informed that they could take control of the vehicle at any time. After each scenario, participants verbally rated their perceived risk (“How dangerous did you find the previous event?”) and situational trust (“Based on the system’s previous performance, to what extent do you trust the driving automation?”) using a predefined scale.
Figure 3: Experimental procedure of each HMI condition.
Figure available in the original PDF paper.
After completing the four conditions within each HMI mode, a short break was provided, during which the researcher organized the experimental data. This procedure was repeated for all three HMI modes. In total, each
The Effect of AR HUD on Enhancing the Driver’s Trust in Automated Vehicles Operation 365
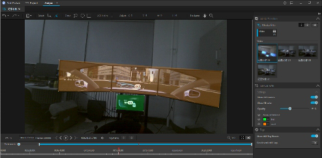
Data Processing The collected data included behavioral measures, subjective ratings, and eye- tracking metrics. Behavioral data consisted of takeover responses recorded for each trial. Subjective measurements were obtained using a 7-point Likert scale, where participants rated their perceived risk and situational trust. Eye-tracking data from the intersection turning phase were segmented and analyzed. As shown in Figure 4, Areas of Interest (AOIs) were defined, specifically targeting the road and the instrument screen, to analyze participants’ visual attention distribution.
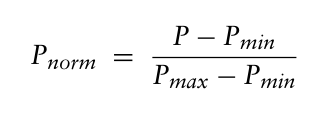
For pupil diameter analysis, we applied min-max normalization to minimize individual differences between participants (Alrefaie et al., 2019). For each participant, the maximum and minimum values of mean pupil diameter data were extracted across all 12 scenarios and normalized to values between 0 and 1 using Equation (1): (1)
Equation reproduced from the original PDF.
where P represents the original mean pupil diameter value, Pmin and Pmax are the minimum and maximum values for each participant across all scenarios, and Pnorm is the normalized value.
Statistical analyses were performed using SPSS 26.0. Given the limited sample size and non-normal data distribution, non-parametric tests were employed. non-parametric tests were employed. Wilcoxon signed-rank tests were used to compare differences between risk conditions, while Friedman tests were conducted to examine the effects of different HMI modes. For significant Friedman test results, post-hoc pairwise comparisons with Bonferroni correction were performed.
Figure 4: Areas of interest (AOIs).
RESULTS AND DISCUSSIONS Analysis of Subjective Measures
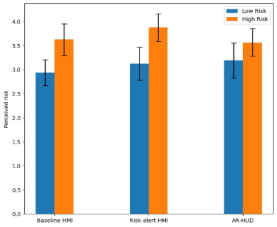
The perceived risk of participants under three HMI conditions and two risk levels is illustrated in Figure 5. Analyzing the perceived risk metrics, the paired-sample Wilcoxon test results indicate a statistically significant
difference between the low-risk and high-risk conditions (p = 0.002 < 0.05). Specifically, the perceived risk in the low-risk condition (M = 5.06, SD = 1.450) is significantly lower than that in the high-risk condition (M = 5.19, SD = 1.104). Furthermore, the Friedman test was conducted to examine the impact of the three HMI modes. The results show that there is no statistically significant difference among the three HMI modes (p = 0.708 > 0.05). This finding suggests that in emergency obstacle avoidance scenarios, drivers can accurately recognize different levels of risk., while variations in the HMI display mode do not significantly influence their risk perception.
Figure 5: Perceived risk under different HMI modes and risk levels.
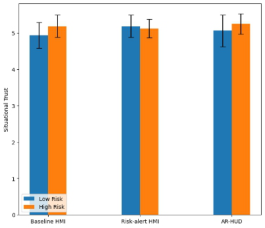
The situational trust of participants under three HMI conditions and two risk levels is illustrated in Figure 6. Analyzing the situational trust data, the paired-sample Wilcoxon test results indicate no statistically significant difference between the low-risk and high-risk conditions (p = 0.622 > 0.05). Furthermore, the Friedman test was conducted to examine the effect of the three HMI modes. The results show that there is no statistically significant difference among the three HMI modes (p = 0.760 > 0.05). This suggests that drivers’ situational trust in the system remains relatively stable regardless of the risk level or the specific HMI display mode. These findings imply that the drivers’ situational trust in the automated system is not easily influenced by variations in risk or interface design.
Figure 6: Situational trust under different HMI modes and risk levels.
The Effect of AR HUD on Enhancing the Driver’s Trust in Automated Vehicles Operation 367
To further explore the relationship between perceived risk and situational trust, a Spearman correlation analysis was performed. The results revealed a significant negative correlation between these two variables (r = −0.665, p < 0.001), indicating that as drivers’ perceived risk of the system increases, their situational trust in the system correspondingly decreases. This finding suggests that drivers’ risk assessment during the human-machine interaction process significantly influences their trust in autonomous driving systems.
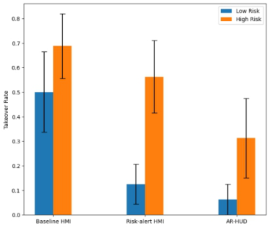
The analysis of the takeover rate indicated a significant difference between the low-risk and high-risk conditions, as revealed by the paired-sample Wilcoxon test (p = 0.011 < 0.05). Specifically, the takeover rate under high-risk condition (M = 0.521, SD = 0.208) was significantly higher than that under low-risk condition (M = 0.229, SD = 0.197), as illustrated in Figure 7. Furthermore, the Friedman two-way analysis of variance by ranks was conducted to examine the effects of the three HMI modes, and the results showed a significant difference among them (p = 0.049 < 0.05). These findings suggest that both risk level and HMI display mode have a significant impact on drivers’ takeover behavior.
Figure 7: Takeover rate under different HMI modes and risk levels.
Analyses of Eye-Tracking Data
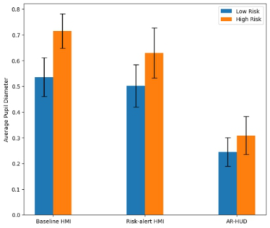
Figure 8 illustrates the average pupil diameter under different HMI modes and risk conditions after max-min normalization for each participant to eliminate individual differences. The results of the paired-sample Wilcoxon test indicated a significant difference in pupil diameter between low-risk (M = 0.427, SD = 0.310) and high-risk conditions (M = 0.551, SD = 0.361, p = 0.009), suggesting that participants experienced increased cognitive workload during high-risk situations. To further examine the effects of different HMI modes, the Friedman two-way analysis of variance by ranks was conducted, revealing a significant difference among the three HMI modes (p < 0.001). After Bonferroni correction, post-hoc pairwise comparisons showed that the pupil diameter in the Baseline mode (M = 0.625, SD = 0.295) was significantly higher than that in both the Risk-alert mode (M = 0.566, SD = 0.360, p = 0.005 < 0.05) and the AR HUD mode (M = 0.276, SD = 0.258, p = 0.001 < 0.05). This suggests that participants experienced higher cognitive workload in the Baseline mode compared to
the other two modes, with AR HUD being particularly effective in reducing cognitive load in automated driving risk scenarios (Appel et al., 2018).
Figure 8: Average pupil diameter under different HMI modes and risk levels.
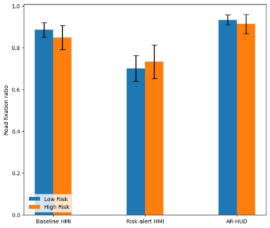
Figure 9 illustrates the proportion of participants’ fixation time on the road Area of Interest (AOI) relative to all AOIs under different HMI modes and risk conditions. The results of the paired-sample Wilcoxon test indicated no significant difference in road fixation ratio between low-risk and high-risk conditions (p = 0.840 > 0.05). To further examine the effects of different HMI modes, the Friedman two-way analysis of variance by ranks was conducted, revealing a significant difference among the three HMI modes (p < 0.001). After Bonferroni correction, post-hoc pairwise comparisons showed that the road fixation ratio in the Risk-alert HMI mode (M = 0.716, SD = 0.282) was significantly lower than that in both the Baseline mode (M = 0.865, SD = 0.187, p = 0.007 < 0.05) and the AR HUD mode (M = 0.923, SD = 0.144, p < 0.001). As observed in Figure 9, the AR HUD mode resulted in the highest road fixation ratio, whereas the Risk-alert HMI mode led to a significant reduction in road fixation.
Figure 9: Road fixation ratio under different HMI modes and risk levels.
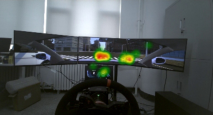
As illustrated in the eye-tracking heatmaps, the visual attention distribution of a typical participant under the three HMI modes is presented intuitively. In the Baseline HMI mode, since the dashboard only provides basic driving information, the participant’s gaze is primarily concentrated on the road scene to acquire interaction-relevant information. In contrast,
The Effect of AR HUD on Enhancing the Driver’s Trust in Automated Vehicles Operation 369
under the Risk-alert HMI mode, the dashboard displays additional risk warning information, prompting the participant to shift a substantial portion of their visual attention toward the dashboard. The heatmap reveals frequent gaze transitions between the road and the dashboard, indicating a divided attention pattern. Meanwhile, in the AR HUD mode, where risk information is directly overlaid onto the forward road scene, the heatmap shows that the participant’s gaze remains highly concentrated on the road area. This information presentation method enables the participant to obtain critical risk information while maintaining continuous attention to the driving environment.
(a) Baseline HMI (b) Risk-alert HMI (c) AR-HUD
Figure 10: A typical subject’s eye-tracking heatmap under three HMI modes.
CONCLUSION
This study examined the impact of different Human-Machine Interface (HMI) display modes on driver trust and behavior in risk scenarios under SAE Level 2 automated driving conditions. The results indicate that drivers’ situational trust of the automated driving system is significantly correlated with their perceived risk, while the type of HMI modes and risk level had relatively minor effects. AR HUD helped drivers maintain focus on the road and reduced unnecessary interventions by presenting risk information in a more intuitive manner. Among the three HMI modes, the AR HUD group exhibited the lowest cognitive load and the lowest takeover rate, suggesting that drivers were more confident in allowing the automated system to handle critical situations. In contrast, the Risk-Alert mode led to a moderate takeover rate, while the Baseline mode resulted in the highest takeover frequency, reflecting drivers’ greater hesitancy to rely on automation when no enhanced risk visualization was provided. The research results are valuable for studying the influence of HMI design on driver trust in automated vehicles and provide insights into optimizing human-machine collaboration.
ACKNOWLEDGMENT
The authors would like to acknowledge support from the National Natural Science Foundation of China under Grant 52272417, in part by the Science and Technology Development Project of Jilin Province under Grant 20230301008ZD.
REFERENCES
Alrefaie, M. T., Summerskill, S., & Jackon, T. W. (2019). In a heart beat: Using driver’s physiological changes to determine the quality of a takeover in highly automated vehicles. Accident Analysis & Prevention, 131, 180–190. Appel, T., Scharinger, C., Gerjets, P., & Kasneci, E. (2018, June). Cross-subject
workload classification using pupil-related measures. In Proceedings of the 2018 ACM Symposium on Eye Tracking Research & Applications (pp. 1–8). Avetisyan, L., Ayoub, J., & Zhou, F. (2022). Investigating explanations in conditional and highly automated driving: The effects of situation awareness and modality. Transportation research part F: Traffic psychology and behaviour, 89, 456–466. Azevedo-Sa, H., Jayaraman, S. K., Esterwood, C. T., Yang, X. J., Robert Jr, L. P., &
Tilbury, D. M. (2021). Real-time estimation of drivers’ trust in automated driving systems. International Journal of Social Robotics, 13(8), 1911–1927. Detjen, H., Salini, M., Kronenberger, J., Geisler, S., & Schneegass, S. (2021, September). Towards transparent behavior of automated vehicles: Design and evaluation of HUD concepts to support system predictability through motion intent communication. In Proceedings of the 23rd international conference on mobile human-computer interaction (pp. 1–12). Griffin, W., Haworth, N., & Twisk, D. (2020). Patterns in perceived crash risk
among male and female drivers with and without substantial cycling experience. Transportation research part F: Traffic psychology and behaviour, 69, 1–12. He, X., Stapel, J., Wang, M., & Happee, R. (2022). Modelling perceived risk and trust in driving automation reacting to merging and braking vehicles. Transportation research part F: Traffic psychology and behaviour, 86, 178–195. Hoff, K. A., & Bashir, M. (2015). Trust in automation: Integrating empirical evidence
on factors that influence trust. Human factors, 57(3), 407–434. Hu, C., Huang, S., Zhou, Y., Ge, S., Yi, B., Zhang, X., & Wu, X. (2024). Dynamic and quantitative trust modeling and real-time estimation in human-machine co-driving process. Transportation Research Part F: Traffic Psychology and Behaviour, 106, 306–327. Kettle, L., & Lee, Y. C. (2022). Augmented reality for vehicle-driver communication:
A systematic review. Safety, 8(4), 84. Kim, S., He, X., van Egmond, R., & Happee, R. (2024). Designing user interfaces for partially automated Vehicles: Effects of information and modality on trust and acceptance. Transportation research part F: Traffic psychology and behaviour, 103, 404–419. Ma, Z., & Zhang, Y. (2021). Drivers trust, acceptance, and takeover behaviors in
fully automated vehicles: Effects of automated driving styles and driver’s driving styles. Accident Analysis & Prevention, 159, 106238. Ma, Z., & Zhang, Y. (2024). Driver-automated vehicle interaction in mixed traffic: Types of interaction and drivers’ driving styles. Human factors, 66(2), 544–561. Mahmud, S. S., Ferreira, L., Hoque, M. S., & Tavassoli, A. (2017). Application
of proximal surrogate indicators for safety evaluation: A review of recent developments and research needs. IATSS research, 41(4), 153–163. Manchon, J. B., Bueno, M., & Navarro, J. (2022). How the initial level of trust in automated driving impacts drivers’ behaviour and early trust construction. Transportation research part F: Traffic psychology and behaviour, 86, 281–295. Pan, H., Xu, K., Qin, Y., & Wang, Y. (2023). How does drivers’ trust in vehicle
automation affect non-driving-related task engagement, vigilance, and initiative takeover performance after experiencing system failure? Transportation research part F: Traffic psychology and behaviour, 98, 73–90.
The Effect of AR HUD on Enhancing the Driver’s Trust in Automated Vehicles Operation 371
Qu, J., Zhou, R., Zhang, Y., & Ma, Q. (2023). Understanding trust calibration in automated driving: The effect of time, personality, and system warning design. Ergonomics, 66(12), 2165–2181. SAE International. (2021). Taxonomy and Definitions for Terms Related to On-Road
Motor Vehicle Automated Driving Systems: SAE J3016-2021. Warrendale: SAE International. Schömig, N., Wiedemann, K., Naujoks, F., Neukum, A., Leuchtenberg, B., & Vöhringer-Kuhnt, T. (2018, September). An augmented reality display for conditionally automated driving. In Adjunct proceedings of the 10th international conference on automotive user interfaces and interactive vehicular applications (pp. 137–141). Xia, T., Lin, X., Sun, Y., & Liu, T. (2023). An empirical study of the factors
influencing users’ intention to use automotive AR-HUD. Sustainability, 15(6), 5028. Xu, W. (2020). From automation to autonomy and autonomous vehicles: Challenges and opportunities for human-computer interaction. Interactions, 28(1), 48–53. You, F., Zhang, J., Zhang, J., Shen, L., Fang, W., Cui, W., & Wang, J. (2024).
A novel cooperation-guided warning of invisible danger from AR-HUD to enhance driver’s perception. International Journal of Human–Computer Interaction, 40(8), 1873–1891.
LISTED IN THE AHFE DIGITAL BOOKSTORE CATALOGUE
Explore the complete digital volume
Advances in Human Factors of Transportation
Read this individual research paper free through the original publisher, or explore the full digital proceedings book.
ISBN 978-1-964867-62-5
Explore this ISBN in the AHFE Bookstore ↗Listed in the July 2026 bookstore catalogue; search by ISBN to confirm current availability · Digital book purchase optional