Zhuocheng Han, Xuelian Zheng, Yuanyuan Ren, Xiansheng Li, Qingju Wang (2023). Personalized Adaptive Cruise Control with Deep Reinforcement Learning. In: Ergonomics In Design. AHFE Open Access, vol. 77, pp. 614–623. https://doi.org/10.54941/ahfe1003421
With the increasing of vehicle intelligence, how to integrate driving style into the autonomous driving decision-making strategies and enhance the driver's trust in the autonomous driving system has become a hot topic. In this paper, a new personalized adaptive cruise control algorithm taking the consideration of driver car-following style is designed. By filtering and reconstructing the driving data in the NGSIM database, indicators characterizing the car-following style are extracted, and K-means is used to cluster the car-following style into three categories: aggressive, general and conservative. A classification identification model is established to realize the online identification of the car-following style. The adaptive cruise controller is designed based on the Dueling Double Deep Q-Network algorithm, and driver car-following style is integrated into the reward function. Corresponding weight coefficients are set according to different working conditions, and the fuzzy rule is used to adjust the weight coefficients of the reward function in real time. The simulation platform is built based on Carsim and Matlab/Simulink to verify the performance of the proposed algorithm. The simulation results showed that the personalized adaptive cruise control algorithm can achieve accurate identification of the driver's car-following style and achieve stable control that incorporates the driver's car-following style. The research can provide reference for the subsequent implementation of more advanced personalized autonomous driving functions.
Adaptive Cruise Control (ACC) can effectively reduce the driver’s operational burden and improve driving comfort and safety (Blythe and Curtis, 2004). Considering the driver’s satisfaction and trust level of the system, i.e., the design of personalized ACC system has become the focus of current research (Xiao and Gao, 2010).
In recent years, research methods for personalized ACC mainly include parameter tuning and machine learning. Wang et al. established an online learning system for driver’s parameters using the inverse of collision time and time headway as indicators to adjust the control parameters of ACC system according to the driver’s characteristics (2013). Zhipeng Liu classified drivers
Personalized Adaptive Cruise Control With Deep Reinforcement Learning 615
into three categories using three indicators: mean longitudinal acceleration, time headway of steady-state following and maximum inverse of collision time, and determined the boundary regions for each condition switching under different driving styles respectively (2018). Reinforcement learning algorithms, which do not require the construction of a longitudinal follo- wing model and can achieve control system construction only using rewards, have also been introduced into the design of personalized ACC systems. Zhu et al. constructed a deep reinforcement learning car-following model with the difference between simulated and observed speeds as the reward function and considering a reaction delay of 1s (2018). Chen et al. used reinforcement learning methods to build an ACC model that can learn and imitate human drivers’ driving strategies online (2017).
The current ACC systems based on reinforcement learning do not combine the characteristic parameters of the car-following styles with the design of the reward function, which cannot reflect the changes of the reward function under different car-following styles, and the design of the reward function mostly relies on expert experience, which is difficult to generalize.
In response to the above problems, a new personalized adaptive cruise control algorithm is proposed in this paper. Primarily, the car-following sty- les are extracted and classified into three categories of aggressive, general and conservative by clustering method, and an online identification model is esta- blished. Next, the D3QN algorithm is used for the design of the personalized ACC’s upper controller, the characteristic parameters of the car-following styles are incorporated in the design of the reinforcement learning reward function, the weight coefficients of each objective under multi-objective con- trol are determined by work conditions, and the fuzzy logic is used to switch between different work conditions. Finally, the lower controller is designed by the inverse vehicle dynamics model and validated by simulation.
EXTRACTION AND CLASSIFICATION OF CAR-FOLLOWING STYLES Extraction of Car-Following Styles
Traffic trajectories from the Next Generation Simulation (NGSIM) I-80 data- set were selected for the study (Hranac et al. 2005). The original data were filtered and noise-reduced using wavelet threshold denoising, and the velo- city and acceleration were recalculated using the five-point stencil approach method (Mehdi et al. 2017).
In this paper, a time headway of 6 s was used as the criterion for jud- ging the car-following behavior (Yang and Zhang, 2006), and only auto data were collected as the study object. After screening, a total of 517 groups of car-following behaviors meeting the requirements were extracted from the dataset.
Classification of Car-Following Styles The duration of the extracted car-following behaviors is relatively short, and the statistical features of the variables such as velocity of the following vehicle during the car-following process can reflect the changing trend of the vehicle
motion state. The four variables of velocity and acceleration of the following vehicle, space headway and time headway between two vehicles were con- structed with 6 statistical features of maximum, minimum, mean, median, variance and standard deviation, and a total of 24 statistical features were obtained for the cluster analysis of following style. Box plots were used to identify outliers in the data, and each statistical feature was normalized to the interval of [-1, 1] after processing.
The constructed features were reorganized and downscaled using principal component analysis. The cumulative contribution rate of the first 7 principal components was 88.51%, consequently the first 7 principal components were selected for cluster analysis.
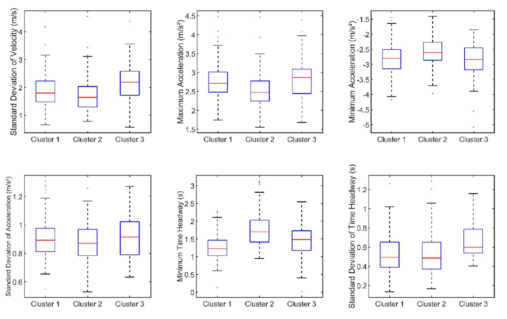
The K-means algorithm was chosen to cluster the extracted car-following behaviors into 3 classes: the first class contains 283 samples, the second class contains 189 samples, and the third class contains 45 samples. Figure 1 shows the box plots of each characteristic parameter of following behavior for different styles of drivers.
The extracted car-following styles were classified into three categories: aggressive (45 samples), general (283 samples) and conservative (189 sam- ples), based on a combination of six characteristic parameters: standard deviation of velocity, maximum acceleration and minimum acceleration, standard deviation of acceleration, minimum time headway and standard deviation of time headway.
Online Identification of Car-Following Styles The BP neural network was used to conduct off-line training on the 517 samples of car-following data, and a car-following style identification model of drivers was established.
The inputs of the model were 6 characteristic parameters: standard devia- tion of velocity, maximum acceleration and minimum acceleration, standard deviation of acceleration, minimum time headway and standard deviation of time headway, and the outputs were 3 car-following styles: aggressive, gene- ral and conservative. The number of hidden layer was 2, and the number of
Figure 1: Box plots of features of different car-following styles.
Personalized Adaptive Cruise Control With Deep Reinforcement Learning 617
neuron in each layer was 10. The activation function of the neural network was selected as sigmoid function, the optimizer was selected as Adam para- meter optimization, the loss function was set as cross entropy loss function, and the learning rate was set as 0.01.
344 samples were randomly selected from 517 samples of car-following behavior data as training group, and the remaining 173 samples were used as test group. The accuracy of the car-following style identification model in the test group is shown in Table 1.
Table 1. Identification accuracy of test samples.
Table available in the original PDF paper.
Aggressive General Conservative number of validation samples 91 68 14 number of accurate predictions 88 63 13 accuracy 96.7% 92.6% 92.9%
In the process of vehicle driving, the values of the neural network inputs are updated at each sampling point, and the identification of car-following style is always in progress. For the samples within a period of sampling time, the result with the highest number of outputs will be selected as the final result of identification to ensure the accuracy. Once the driver’s following style is identified, the driver can be matched with a personalized ACC strategy.
DESIGN OF PERSONALIZED ACC SYSTEM Multi-Objective Control of ACC
In this paper, the Dueling Double Deep Q-Network (D3QN) algorithm was used to design the upper controller (Wang et al. 2015; Van et al. 2016).
Personalized ACC achieves the driver’s desired objective of safety, follow- ing, comfort and economy through the operation of the system instead of the driver, and should also match the driver’s car-following style.
The desired safety-distance is the direct expression of different following styles. Variable safety-distance model was used to describe the desired safety- distance ddes = v0 · τ + d0 (1)
where v0 is velocity of the following vehicle, τ is the desired time headway, d0 is the minimum safety-distance after stopping, which is 2 m.
The desired time headway τwas fitted using the cubic polynomial of velo- city of the following vehicle at low and medium speed conditions, and the function of the desired time headway can be calculated using
Equations and mathematical formulas are available in the original paper PDF.
1 V3 + α(i) 2 V2 + α(i) 3 V + α(i) 4 (2) where i=1,2,3 corresponds to the three types of car-following styles: aggres- sive, general and conservative, α(i) 1 , α(i) 2 , α(i) 3 , α(i) 4 are coefficients fitted by polynomial curve related on velocity, and their specific values are shown in Table 2.
During car-following, the driver’s expectation of the safety-distance is not a precise value, but a more vague range. When the actual distance between two vehicles is within the driver’s expectation, it can be considered that the desired control effect is achieved. In this paper, we use the range of desired safety-distance instead of the desired safety-distance, and use the deviation of longitudinal displacement kd to describe the magnitude of the range of desired safety-distance. Define kd as the degree of deviation of the actual distance between two vehicles and the desired safety-distance (3)
where d is the actual distance between two vehicles, ddes is the desired safety- distance.
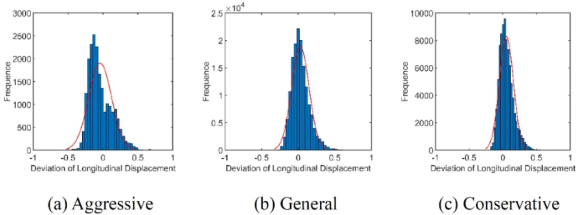
Drivers with different car-following styles also have different desired ranges of safety-distance, and the distribution of kd is shown in Figure 2.
The curve fitting shows that kd under different car-following styles approximately follows a normal distribution. The more aggressive the car- following style is, the smaller the mean value and the larger the standard deviation of kd, indicating that this type of driver is used to maintaining a distance less than the desired safety-distance, and the time headway fluctuates greatly and changes frequently during the car-following process.
(µ-σ, µ+σ) is selected as the expected interval representing the safety- distance of ACC system. When kd is within this interval, it can be considered that ACC system has achieved the safety objective. (µ-3σ, µ+3σ) is selected as the critical interval representing the safety-distance of ACC system. When kd is outside this interval, it can be considered that ACC system cannot achi- eve the safety objective. According to data analysis, the expected intervals of safety objective for aggressive, general and conservative are calculated to be
Figure 2: Statistics of the deviation of longitudinal displacement.
Personalized Adaptive Cruise Control With Deep Reinforcement Learning 619
(-0.204, 0.124), (-0.090, 0.148) and (-0.051, 0.157), and the critical intervals are (-0.532, 0.452), (-0.328, 0.386) and (-0.259, 0.365).
The variability in following objective among different car-following styles is mainly expressed in the magnitude of the range of desired velocity. In this paper, we use the deviation of longitudinal velocity kv to describe the magni- tude of the range of desired velocity. Define kv as the degree of deviation of velocity of the following vehicle and the preceding vehicle (4)
where v0 is velocity of the following vehicle, vp is velocity of the preceding vehicle.
The deviation of longitudinal velocity kv at each moment in the original data likewise approximately follows a normal distribution. Similar to the safety objective, the expected intervals of following objective for aggressive, general and conservative are calculated to be (-0.118, 0.168), (-0.085, 0.121) and (-0.085, 0.113), and the critical intervals are (-0.404, 0.454), (-0.291, 0.327) and (-0.283, 0.311). The derivative of acceleration jerk is chosen as the evaluation index of comfort objective, and the magnitude of jerk is limited by referring to the provisions of ISO 15622 (2018) standard.
Acceleration a is chosen as the evaluation index of economy objective, and the magnitude of a is limited by referring to the provisions of ISO 15622 (2018) standard.
Design of Reward Function The reward function consists of four components: safety reward, following reward, comfort reward, and economy reward, which take the following form:
where ω = [ω1, ω2, ω3, ω4]T, ω1, ω2, ω3, ω4 are the wei- ght coefficients for safety, following, comfort and economy reward, r0 =
rsafety, rfollowing, rcomfort, reconomy
T, is the matrix of reward functions formed by each reward function.
Use the deviation of longitudinal displacement kd to design safety reward:
kd −a1
Equations and mathematical formulas are available in the original paper PDF.
kd −b1
Equations and mathematical formulas are available in the original paper PDF.
where (a1, b1), (a2, b2) are the expectation intervals and the critical intervals of safety objective for each car-following style.
Use the deviation of longitudinal velocity kv to design following reward:
Equations and mathematical formulas are available in the original paper PDF.
Equations and mathematical formulas are available in the original paper PDF.
where (c1, d1), (c2, d2) are the expectation intervals and the critical intervals of following objective for each car-following style.
Use the derivative of acceleration jerk to design comfort reward:
−|jerk| jerkmax
jerk
jerk
> jerkmax
where jerkmax is the maximum value of the derivative of acceleration specified in the ISO 15622 (2018) standard.
Use acceleration a to design economy reward: −|a|
Where amax is the maximum value of acceleration specified in the ISO 15622 (2018) standard.
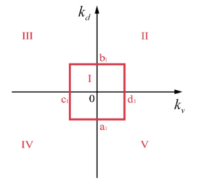
Switching of the Working Conditions and Determination of the Weight Coefficients of the Reward Function According to the deviation of longitudinal displacement kd and the devia- tion of longitudinal velocity kv, the working conditions are divided into five: steady-state following, safe approaching, safe away, dangerous away and dangerous approaching, as shown in Figure 3. In the figure, (a1, b1), (c1, d1) are the expected interval of kd and kv respectively. The control objecti- ves of ACC under different working conditions are quite different, and the weight coefficient matrix of the reward function for each working condition should be set separately.
The weight coefficients of the reward function under different working conditions in the preliminary design are shown in Table 3.
Figure 3: Division of the ACC system’s working conditions.
Personalized Adaptive Cruise Control With Deep Reinforcement Learning 621
Table 3. Empirical weight coefficients of control objectives under different working conditions.
Table available in the original PDF paper.
working condition safety following comfort economy
During car-following, the working conditions change at any time, and in order to avoid sudden changes in the weight coefficients of the reward function, fuzzy rules are used to switch the weight coefficients under each working condition. The input of the fuzzy rule is the deviation of longitu- dinal displacement kd and the deviation of longitudinal velocity kv, and the output is the four weight coefficients of the reward function. In each simu- lation step kd, kv and the 4 weight coefficients are firstly discretized and divided into 7 fuzzy subsets, which are PB, PM, PS, ZO, NS, NM and NB. The fuzzy rules are designed with reference to the empirical weight coeffi- cients in Table 3. The triangular membership function (trimf) is selected to transform the inputs into fuzzy outputs, and finally the centroid method is selected to defuzzify to obtain the specific weight coefficients.
Design of Lower Controller The inverse vehicle dynamics model and PID controller are used to track the desired acceleration decided by the upper controller. The three coefficients of the PID control are calibrated experimentally to take the value of 100, 50 and 0 respectively in the acceleration phase, and take the value of 36, 0.556, and 0.45 respectively in the acceleration phase.
TRAINING AND SIMULATION OF REINFORCEMENT LEARNING ALGORITHM The deep reinforcement learning framework is built in python environment, and multi-round iterative calculation is carried out.The size of the neural network is set to 32*64*128*64*32, and the settings of are shown in Table 4.
In the training of the upper controller, the following car and the preceding car are simplified into two particles, and the kinematic state is expressed by the uniform variable motion law. The velocity range of the vehicles is [0, 20] m/s, the acceleration range is [-3, 3] m/s, and the distance between the vehicles is [0, 150] m.
The state space of the agent in reinforcement learning is set as the distance d between the following car and the preceding car, the desired safety-distance ddes, velocity of the following car v0 and velocity of the preceding car vp, and the action space is acceleration of the following car a. Before the simulation, each of the spaces needs to be discretized with a discretization accuracy of 0.1.
After the training of the upper controller is completed, the car-following data in NGSIM are selected and the python/simulink/carsim co-simulation is
Table 4. Empirical weight coefficients of control objectives under different working conditions.
Table available in the original PDF paper.
Hyperparameter Description Value
128
lr Learning rate used by Adam 0.001 γ Q-learning discount factor gamma 0.99 ε0 Initial value of ε-greedy algorithm 0 εincrement Increment value of ε-greedy algorithm 0.000001 ε Termination value of ε-greedy algorithm 0.000001 memory_size Number of training cases in replay memory 1000000 batch_size Number of training cases used by stochastic gradient descent update
500
replace_step Updating steps of target networks and eval network
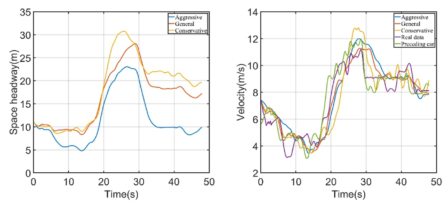
Figure 4: Examples of training results of different car-following styles.
carried out to compare the control strategies of different car-following styles and verify the effectiveness of the personalized ACC algorithm proposed in this paper. Figure 4 shows the curves of distance and velocity of different car-following styles in a certain segment of car-following data.
It can be seen that the control strategies for different car-following styles match the behavioral characteristics of each type of drivers, and have good followability for the velocity of the preceding car while ensuring the desired safety-distance.
CONCLUSION
This paper proposed a new personalized ACC algorithm based on deep reinforcement learning. The research results are mainly as follows:
Car-following behavior is extracted from traffic trajectories of NGSIM, using K-means clustering algorithm to classify car-following styles into three categories: aggressive, general and conservative, and designing an online identification model for car-following styles.
The design of personalized ACC is carried out by using D3QN algorithm, and a new evaluation index for multi-objective control of ACC is propo- sed and incorporated into the reward function of reinforcement learning, and the switching of the weight coefficients of the reward function under different working conditions is carried out by using fuzzy logic.
Personalized Adaptive Cruise Control With Deep Reinforcement Learning 623
Simulation results show that the personalized ACC algorithm designed in this paper can take into account the personalized needs of different follow- ing styles while ensuring safety and followability. The research in this paper can provide reference for the subsequent implementation of more advanced personalized autonomous driving functions.
The research of this paper still has the following deficiencies:
The data used in this paper are mostly collected at low and medium speed, the design of vehicles in high-speed scenes is relatively lacking.
This paper has only conducted simulation experiments, and the performa- nce of the proposed algorithm on real vehicles needs further verification.
In the subsequent research, data of drivers with different car-following styles in high-speed scenes will be collected, and real vehicle verification will be conducted to optimize the performance of the algorithm.
REFERENCES
Blythe PT, Curtis A M. (2004). Advanced driver assistance systems: Gimmick or reality. Nagoya: 11th World Congress on ITS. Chen X., Zhai Y., Lu C., Gong J. and Wang G. (2017). A learning model for perso-
nalized adaptive cruise control. 2017 IEEE Intelligent Vehicles Symposium (IV), pp. 379–384. Hranac R, Margiotta R, Alexiadis V (2005). Next generation simulation (NGSIM) high-level data plan. Report to Federal Highway Administration. Liu Zhipeng (2018). Research on the Personalized Adaptive Cruise Control System
with Driver Style Identification. Master thesis, Jinlin University. Mehdi Rafati Fard, Afshin Shariat Mohaymany, Matin Shahri (2017). A new methodology for vehicle trajectory reconstruction based on wavelet analysis. Transportation Research Part C: Emerging Technologies, p. 74. Meixin Zhu, Xuesong Wang, Yinhai Wang (2018). Human-like autonomous car-
following model with deep reinforcement learning. Transportation Research Part C: Emerging Technologies, Vol. 97, pp. 348–368. Van Hasselt H, Guez A, Silver D (2016). Deep reinforcement learning with double q-learning. Thirtieth AAAI conference on artificial intelligence. Wang J., Zhang L., Zhang D. and Li K. (2013). An Adaptive Longitudinal Dri-
ving Assistance System Based on Driver Characteristics. Intelligent Transportation Systems, IEEE Transactions on 14, pp. 1–12. Wang Z, Schaul T, Hessel M, et al. (2015). Dueling network architectures for deep reinforcement learning. Volume 48, pp. 1995–2003. Xiao L. and Gao F. (2010). A comprehensive review of the development of adaptive
cruise control systems. Vehicle System Dynamics 48(10), pp. 1167–92. Yang SM, Shan Z, Ding Y, et al. (2021). Survey of research on deep reinforcement learning. Computer Engineering, 47(12), pp. 19–29. Yang Xiao bao, Zhang Ning (2006). An Improved Method of Determining Car-
Following State. Journal of Transportation Systems Engineering and Information Technology, 2006(02), pp. 14–17.
LISTED IN THE AHFE DIGITAL BOOKSTORE CATALOGUE
Explore the complete digital volume
Ergonomics In Design
Read this individual research paper free through the original publisher, or explore the full digital proceedings book.
ISBN 978-1-958651-53-7
Explore this ISBN in the AHFE Bookstore ↗Listed in the July 2026 bookstore catalogue; search by ISBN to confirm current availability · Digital book purchase optional