Qichao Zhao, Jianming Yang, Qingju Wang, Ying Gao, Bing Zhang, Qian Zhou, Ping Wu, Han Li (2025). Construction of a VR Multimodal Dataset for Stress Recognition. In: Metaverse, Virtual Environments and Game Design. AHFE Open Access, vol. 178, pp. 118–129. https://doi.org/10.54941/ahfe1006351
Accurate identification of individuals' stress states is critical for optimizing intervention strategies and enhancing safety performance in intelligent human-machine interaction systems and high-risk operational environments. Virtual Reality (VR) technology offers a novel paradigm for inducing controllable and ecologically valid stress through highly immersive scenarios. The development of high-quality multimodal stress datasets represents an urgent requirement to advance emotion computing and practical applications of intelligent human-computer interaction. This study presents the creation of a VR-based multimodal stress dataset. The experimental protocol comprised four tasks: ground walking, elevated platform 1 walking, elevated platform 2 walking, and jumping platform tasks. Physiological data including electroencephalogram (EEG), photoplethysmography (PPG), electrodermal activity (EDA), and eye tracking data were collected across all tasks, along with subjective stress ratings in different scenarios. Data from 30 participants were acquired. A binary classification was performed between two representative scenarios: ground walking (low-stress state) and jumping platform (high-stress state). Following feature extraction from EEG and PPG signals, classification models (decision tree, random forest, Bagging, and AdaBoost) were implemented. The random forest classifier achieved optimal performance, yielding a cross-subject five-fold cross-validation accuracy of 0.8360 ± 0.0162 and F1 score of 0.8140 ± 0.0301 for distinguishing between low-stress and high-stress states. This dataset provides essential data support for real-time stress recognition, with potential applications in intelligent human-computer interaction and medical rehabilitation. Data-driven interventions based on this resource could significantly enhance health outcomes and work efficiency across multiple domains.
The rapid advancement of artificial intelligence and big data technologies has opened new avenues for precise identification and assessment of stress states through multimodal data fusion. In safety-critical environments such as intelligent cockpits, nuclear power plant control rooms, and elevated work
Construction of a VR Multimodal Dataset for Stress Recognition 119
platforms, operators’ stress responses directly impact operational reliability and system safety (Seinfeld et al., 2016), highlighting the urgent need to develop real-time stress recognition systems.
From a theoretical perspective, stress refers to a nonspecific systemic response triggered by internal and external environmental stimuli (McLeod, 2010). This concept traces back to Cannon’s (1925) “fight-or-flight” theory, which revealed that individuals in hazardous situations exhibit characteristic psychophysiological state alterations. Currently, accurate identification of stress states not only drives breakthroughs in fundamental psychological and neuroscientific research but also represents a critical technical challenge for enabling personalized interventions and enhancing human-machine system safety.
Traditional stress induction methods (e.g., laboratory simulations or questionnaires) often struggle to effectively capture real-world physiological and behavioral responses due to poor environmental controllability and low ecological validity. Virtual Reality (VR) technology, with its highly immersive experience and programmable scenarios, offers a new paradigm for controllable and realistic stress induction. Growing research indicates that VR scenarios can induce psychological and physiological stress responses through designed stress tasks (Seinfeld et al., 2016; Krijn et al., 2004; Brown et al., 2006; Dammen et al., 2022; Peterson et al., 2018; Huppert et al., 2013). For instance, existing studies have constructed VR scenarios to induce stress in participants and found that VR-induced stress can be quantified through neurophysiological indicators such as frontal alpha asymmetry, occipital beta/gamma band activity, occipital alpha activity (OAA), heart rate variability (HRV), and cortisol levels (Brouwer et al., 2011; Aspiotis et al., 2022). Ji et al. (2020) developed a stress ratio prediction model using VR and EEG data through constructed vertical building spaces, but relied solely on EEG data. Perez-Valero et al. (2021) created personalized stress quantification using EEG and machine learning regression algorithms, yet faced limitations of single-modality data and high computational costs for individualized models. Kim et al. (2024) classified stress states in real-time using VR interview paradigms with single-channel EEG and GSR via deep learning, but their behind-ear EEG setup limited whole-brain monitoring, and computational demands hindered wearable applications.
To address these limitations, this study proposes constructing a VR-based multimodal stress dataset. Through gradient task design, we aim to induce varying stress intensities while synchronously collecting EEG, PPG, EDA, and eye-tracking data with subjective stress ratings for multidimensional annotation. Furthermore, machine learning classifiers will be employed to identify different stress states. Specifically, four task scenarios were designed: ground walking, elevated platform walking at two heights (adjusted via elevation differences), and platform jumping. The gradient difficulty (low-risk to high-risk) simulates real-world stress escalation while controlling individual differences through within-subject design. Moreover, the ErgoLAB V3.0 platform enables millisecond-level synchronization of multimodal data collection, resolving temporal alignment issues from traditional asynchronous signal acquisition.
The study’s innovations manifest in two aspects: (1) Multimodal Data Fusion: First integration of EEG, PPG, EDA, and eye-tracking in VR stress experiments, establishing a comprehensive physiological-behavioral stress characterization system. (2) Cross-Subject Generalization: Implementing five-fold cross-validation ensures high classification accuracy (83.6%) on unseen subjects, laying data and technical foundations for smart healthcare (e.g., real-time anxiety intervention), high-risk occupational training (e.g., stress resilience assessment), and next-generation human- computer interaction systems (e.g., adaptive interfaces).
METHODS
Participants: Thirty participants (1:1 male-to-female ratio) were recruited for the experiment. All participants had no behavioral or cognitive impairments, no history of mental illness, and no motion sickness (including VR-related motion sickness). They were instructed to abstain from alcohol, caffeine, or any medications for 2 hours prior to the experiment.
Experimental Design: A single-factor within-subject design was employed. The independent variable consisted of four VR task scenarios: ground walking, Elevated Platform 1 Walking (height above ground), Elevated Platform 2 Walking (height above depressed ground), and jumping from Elevated Platform 2. The order of the two elevated platform walking tasks was counterbalanced across participants.
VR Scenarios: The experimental environment featured a VR elevated platform scenario, where the height difference between the platform and the ground could be dynamically adjusted. Two height configurations were selected: Configuration 1: The elevated platform was raised to its maximum height while the ground remained unchanged. Configuration 2: The elevated platform was raised to its maximum height, and the ground was simultaneously lowered to its minimum level. By manipulating these height differences and requiring participants to jump from the elevated platform, the experiment aimed to induce varying levels of stress states.
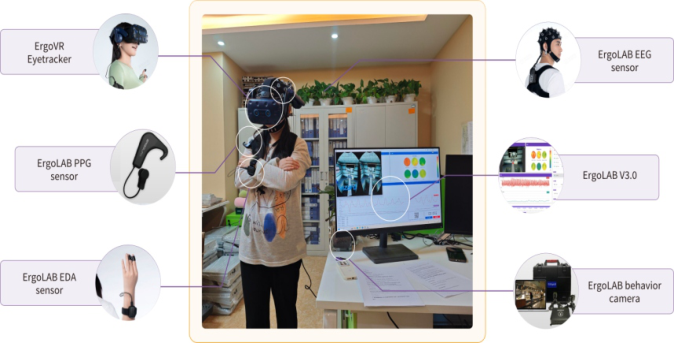
Equipment: The ErgoLAB V3.0 Human-Machine Environment Synchronization Platform (Kingfar International Inc., China) was used to synchronously record multimodal data. Specifically, an ErgoVR Eyetracker virtual reality eyetracker (120 Hz) was employed to collect eye-tracking data; an ErgoLAB EEG wearable electroencephalogram device (256 Hz) for electroencephalogram (EEG) data; an ErgoLAB EDA galvanic skin response sensor (64 Hz) for electrodermal activity (EDA) data; an ErgoLAB PPG pulse sensor (64 Hz) for heart rate variability (HRV) data; and a camera for behavioral data recording.
The demographic survey included questions on participants’ age, gender, height, weight, history of acrophobia (fear of heights), prior high-altitude experiences (e.g., bungee jumping, rock climbing, skydiving), VR usage frequency, and susceptibility to screen-induced motion sickness.
Scales: The State-Trait Anxiety Inventory (STAI, Spielberger, 1983) was used to measure participants’ trait anxiety. A 10-point Likert scale (1 = “completely not nervous”/”completely not afraid”, 10 = “extremely
Construction of a VR Multimodal Dataset for Stress Recognition 121
nervous”/”extremely afraid”) was employed to assess participants’ stress levels, where they were asked to rate their perceived nervousness or fear from the recent experience on a scale of 1 to 10.
Figure 1: Schematic of experimental equipment and setup.
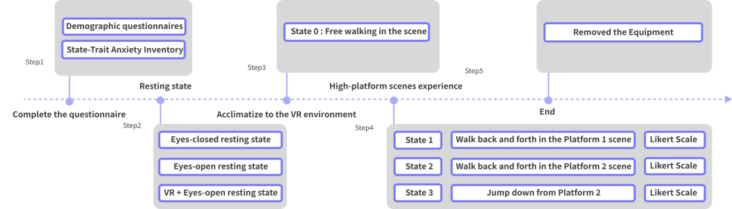
Experimental Procedure Pre-experiment: Participants signed informed consent forms and completed the demographic questionnaire and STAI.
Baseline Data Collection: The experimenter attached EDA, PPG, and EEG sensors to the participant. Participants were instructed to sit facing a wall for 6 minutes: 3 minutes with eyes closed (prompted by the experimenter), followed by 3 minutes with eyes open. The VR eye tracker was then calibrated, and participants sat quietly with eyes open for 3 minutes to collect baseline data.
State 0 (Ground Walking): Participants walked across a flat virtual platform from one end to the other and back. After reaching each endpoint, they verbally rated their stress level on the 10-point scale.
State 1 (Elevated Platform 1 Walking): Participants walked across Elevated Platform 1 (height above ground) with toes touching the heel of the front foot, arms crossed, and gaze fixed on their feet to maintain balance. Stress ratings were collected at both endpoints using the 10-point scale.
State 2 (Elevated Platform 2 Walking): Participants repeated the walking task on Elevated Platform 2 (height above depressed ground), following the same instructions as in State 1. Stress ratings were recorded at both endpoints.
State 3 (Platform Jumping): Participants were instructed to walk to the center of Elevated Platform 2 and jump down. After landing, they verbally rated their stress level on the 10-point scale.
Post-experiment: All equipment was removed, and participants were debriefed.
Figure 2: Experimental flowchart.
Dataset Description The dataset is available on the kingfar.cn website and includes raw data from EEG, EDA, PPG, eye-tracking, demographic questionnaires, State-Trait Anxiety Inventory (STAI), and Likert scale ratings. The dataset is structured as follows:
Dataset_description.json: Metadata describing dataset ownership and licensing.
readme.json: Documentation detailing the VR stress experiment design, data collection protocols, label definitions, and other contextual information.
participants.csv: A CSV file containing demographic and psychological trait data for all 30 participants, including: Participant ID, Gender and STAI scores (trait anxiety).
participants.json: A data dictionary explaining the column headers and variables in participants.csv.
Sourcedata: A directory containing raw physiological and behavioral data: info.txt: Technical specifications for EEG, EDA, PPG, and eye-tracking devices, including sampling rates, acquisition systems, and channel configurations.
Raw data folders: 30 participant-specific folders (named 001, 002,..., 030), each containing: EEG.csv: 33-column EEG raw data (timestamp + 32-channel EEG values). EDA.csv: 2-column EDA raw data (timestamp + 1-channel EDA value). PPG.csv: 2-column PPG raw data (timestamp + 1-channel PPG value). Eyetracking.csv: 4-column eye-tracking data (timestamp + 3D gaze coordinates + pupil diameter).
DATA PROCESSING AND ANALYSIS In this study, State 0 (ground walking) and State 3 (platform jumping) were operationally defined as low-stress and high-stress conditions, respectively. Classification of stress states was performed using photoplethysmography (PPG) and electroencephalography (EEG) signals to distinguish between these two extremes of stress intensity.
Construction of a VR Multimodal Dataset for Stress Recognition 123
Notably, three recordings (Participant 025, 026, and 027) were derived from a single subject, whereas all other participants contributed two consecutive recordings under controlled experimental conditions.
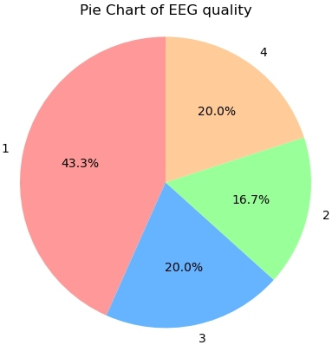
Signal Quality Assessment A rigorous quality control protocol was implemented to evaluate multimodal data integrity. Initial verification confirmed valid acquisition of all physiological signals (EEG, PPG, EDA, eye tracking). For EEG and PPG, a five-tier quality grading system was applied:
1-Excellent quality: Minimal noise or no artifacts. 2-Motion artifacts: Transient interference from participant movement. 3-Channel-specific degradation: Poor quality in some channels. 4-Moderate interference: Episodic high-amplitude noise in some epochs. 5-Severe interference: Sustained saturation or uncorrectable artifacts.
Figure 3: Analysis of signal quality for EEG and PPG data.
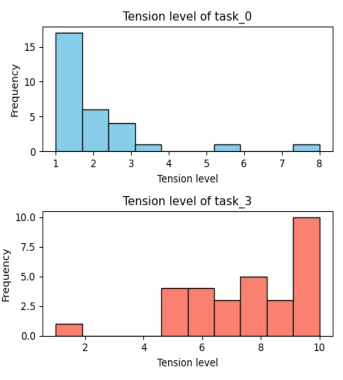
In the current study, self-reported stress levels during the experiment and electrodermal activity (EDA) data served as indicators to evaluate the effectiveness of stress induction. The distribution of self-reported stress levels for participants in State 0 (task_0) and State 3 (task_3) is illustrated in the figure below. It is evident that, compared to State 0, a greater proportion of participants in State 3 reported higher stress scores, suggesting that the experimental protocol successfully induced a stress state.
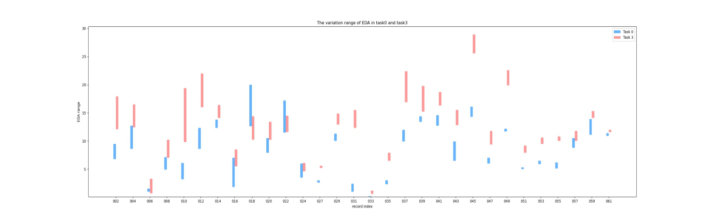
The table below presents the range of EDA data for each participant during task_0 and task_3. The results clearly demonstrate a significant increase in EDA levels during State 3 compared to State 0. This elevation can be attributed to the activation of the sympathetic nervous system under stress, which stimulates sweat gland activity. Increased perspiration elevates skin conductance, thereby raising EDA. The marked change in this metric further supports the validity of stress induction in the experiment.
Figure 4: Number of participants providing subjective questionnaire scores under state 0 (task_0) and state 3 (task_3).Figure 5: Range of EDA data under state 0 and state 3 tasks.
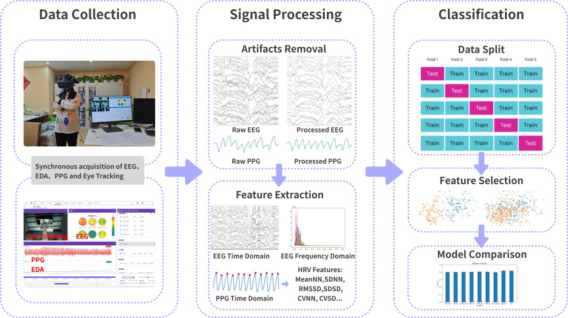
Data Processing This study investigates stress state detection using electroencephalography (EEG) and photoplethysmography (PPG) data, with tailored approaches for data processing, feature extraction, and classification. Data segmentation was performed using a 10-second sliding window with a 1-second step, resulting in 1,205 low-stress samples and 712 high-stress samples. To ensure robust cross-validation, the segmented data were divided into five subject-independent groups, each containing six participants. Additionally, 60-second segments of resting-state EEG data (recorded during virtual reality sessions with eyes open, following 3 minutes of acquisition) were extracted for further analysis.
For EEG preprocessing, the data were filtered using a 0.5–100 Hz bandpass filter, followed by 50 Hz notch filtering to eliminate powerline interference and a detrending step to remove baseline drift. Ocular artifacts were intentionally retained during preprocessing to preserve the integrity of real-time stress detection. For PPG signals, preprocessing included a 0.5–8 Hz bandpass filter to isolate physiological signals, followed by peak detection to derive NN interval sequences for heart rate variability (HRV) analysis.
Construction of a VR Multimodal Dataset for Stress Recognition 125
Figure 6: Data analysis flowchart.
Feature Extraction Prior studies have established physiological markers of stress, including increased theta band power (Smitha et al., 2017), decreased alpha band power (Dasari et al., 2023), elevated beta band power (Arsalan et al., 2019), altered frontal asymmetry (Fu et al., 2022), and reduced HRV with shifts in low-frequency (LF) and high-frequency (HF) power (Dalmeida & Masala, 2021). Aligning with these findings, the following features were extracted: EEG: Relative power of theta, alpha, beta_1 (13–20 Hz), beta_2 (20–30 Hz), and gamma (30–45 Hz) bands across all channels. A stress- sensitive relative_gamma feature, defined as the ratio of gamma power to the sum of alpha and beta power, was also computed. PPG: Time-domain (e.g., mean NN interval, SDNN) and frequency-domain (LF, HF, LF/HF ratio) HRV features derived from NN intervals. To mitigate individual variability, two baseline correction methods were tested: (1) subtracting resting-state features from task-state features and (2) dividing the subtracted values by resting-state features.
Classification Algorithm In the current classification task, the performance of the random forest model was analyzed under various experimental scenarios. This approach was chosen due to the random forest’s advantages in fast training speed, strong generalization capability, and high robustness to noise interference. Additionally, the random forest algorithm provides a convenient method for evaluating feature importance, which facilitates subsequent feature analysis. Prior studies on stress detection have also demonstrated the superior performance of random forest models (Rauf & Saeed, 2024; Devi et al., 2020; Zanetti et al., 2018). To ensure a comprehensive comparison, the results of several machine learning models—including random forest, decision tree, AdaBoost, HGBT, SVM, and BaggingClassifier—were evaluated using identical datasets and feature sets.
The specific steps were as follows: The extracted features were first classified using a random forest classifier. Feature screening was performed to identify the most relevant features. This was achieved by randomly shuffling features to assess their importance, as shown in Table 1. The thresholds of 0.02, 0.03, 0.04, and 0.05 correspond to feature counts of 25, 15, 9, and 7, respectively. The results indicate that selecting the top 15 features (5 EEG features and 10 HRV features) yields optimal classification performance. This subset of features was found to contribute most significantly to the model’s accuracy.
Table 1: Random forest classification accuracy and F1 score with different thresholdbased feature selection.
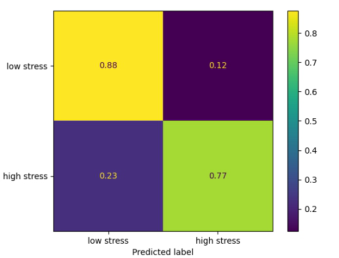
Subsequently, a comparative analysis was conducted on the classification results obtained under two different baseline removal methods, as well as under the condition without any baseline removal. The analysis revealed that the method combining subtraction and division for baseline removal yielded superior results compared to other approaches. Specifically, after selecting the top 15 features and applying the subtraction-followed-by-division baseline removal technique, the classification performance of four machine learning models—AdaBoost, HGBT, SVM, and Bagging—was evaluated and compared. The results of this comparison are presented in Table 2, which illustrates that the Bagging model achieved the highest accuracy among the models tested. Furthermore, the average confusion matrix derived from the 5-fold cross-validation across subjects for the Bagging model is depicted in Figure 7, providing a detailed overview of its classification performance.
Table 2: Classification accuracy and F1 score of different models.
Figure 7: Average confusion matrix from 5-fold cross-validation across subjects.
Construction of a VR Multimodal Dataset for Stress Recognition 127
DISCUSSION
This study successfully established a multimodal stress dataset based on virtual reality (VR) technology and validated its practicality in stress state classification. The experimental results demonstrated that different levels of stress responses could be effectively induced by adjusting VR scenario tasks. A significant increase in electrodermal activity (EDA) data, with an average increase of 47% in state 3 compared to state 0, confirmed the activation of the sympathetic nervous system and supported the effectiveness of stress induction. Furthermore, after fusing electroencephalography (EEG) and photoplethysmography (PPG) features, the random forest model achieved the highest performance (83.6% accuracy) in cross-subject classification tasks, highlighting the importance of multimodal data complementarity in enhancing classification accuracy.
The dataset provides critical support for the development of real-time stress recognition technology. The model established in this study exhibited several advantages. In terms of model performance, only 15 features from EEG and PPG were used, with a relatively small number of features and a simple model structure, significantly reducing computational resource requirements. In practical applications, this approach not only effectively reduces hardware costs but also improves system operational efficiency, enabling real-time prediction of subjects’ stress states. Additionally, the current classification model achieved high results in cross-subject evaluation, demonstrating strong generalization performance and adaptability to different subjects’ data characteristics, maintaining stable and excellent performance in diverse practical scenarios.
For instance, in the field of medical rehabilitation, a personalized stress feedback system can be constructed by combining real-time EEG and PPG monitoring for intervention training in patients with anxiety disorders or post-traumatic stress disorder (PTSD). The system can dynamically adjust VR scenario difficulty based on patients’ physiological signals, gradually exposing them to controllable stressors to enhance psychological resilience. In high-risk occupational safety (e.g., firefighters and high-altitude workers), this technology can be integrated into training systems. By real-time monitoring of operators’ stress levels, it can trigger early warnings or adjust task allocation promptly, reducing the risk of errors caused by excessive tension. Furthermore, intelligent human-machine interaction systems can optimize interaction strategies based on users’ stress states. For example, in autonomous driving, if the system detects that the driver is in a high-stress state, it can automatically switch to assisted driving mode to enhance safety.
Despite these achievements, the study has certain limitations. First, the small sample size (30 subjects) may affect the model’s generalization ability, and the subject group does not include special occupational groups (e.g., firefighters and pilots), which may limit the model’s applicability among specialized workers. Additionally, individual differences (e.g., acrophobia and previous high-altitude experiences) were not fully controlled, potentially introducing confounding factors. Future research can be improved in the following directions: expanding sample diversity to include more high-risk
occupational groups; optimizing VR task design (e.g., introducing dynamic environmental changes or social stressors) to enhance the ecological validity of stress induction; exploring the modeling capabilities of deep learning models (e.g., Transformer or graph neural networks) for multimodal time- series data; and combining real-time feedback systems to develop closed-loop intervention strategies, further enhancing the practical application value of stress recognition.
CONCLUSION
Through innovative VR task design and multimodal data fusion, this study provides high-quality data support and a technical paradigm for stress recognition research. Although sample limitations exist, the research results significantly advance the fields of affective computing and intelligent human-machine interaction. Future work should continuously optimize data diversity and model robustness to promote the transition of this technology from laboratory settings to practical applications.
REFERENCES
Aspiotis, V., Miltiadous, A., Kalafatakis, K., Tzimourta, K. D., Giannakeas, N., Tsipouras, M. G., Peschos, D., Glavas, E., & Tzallas, A. T. (2022). Assessing electroencephalography as a stress indicator: A VR high-altitude scenario monitored through EEG and ECG. Sensors, 22(11), 5792. Arsalan, A., Majid, M., Butt, A. R., & Anwar, S. M. (2019). Classification of
perceived mental stress using a commercially available EEG headband. IEEE Journal of Biomedical and Health Informatics, 23(6), 2257–2264. Brouwer, A. M., Neerincx, M. A., Kallen, V., van der Leer, L., & ten Brinke, M.
(2011). EEG alpha asymmetry, heart rate variability and cortisol in response to virtual reality induced stress. J. Cyberther. Rehabil, 4(1), 21–34. Brown, L. A., Polych, M. A., & Doan, J. B. (2006). The effect of anxiety on the regulation of upright standing among younger and older adults. Gait Posture, 24(3), 397–405. Cannon, W. B. (1925). Bodily changes in pain, hunger, fear and rage: An account of
recent researches into the function of emotional excitement. D. Appleton. Dammen, L. V., Finseth, T. T., McCurdy, B. H., et al. (2022). Evoking stress reactivity in virtual reality: A systematic review and meta-analysis. Neuroscience & Biobehavioral Reviews, 138, 104709. Dasari, S. B., Mallareddy, C. T., Annavarapu, S., & Garike, T. T. (2023). Detection
of mental stress levels using electroencephalogram signals (EEG). In 2023 2nd International Conference on Futuristic Technologies (INCOFT) (pp. 1–6). Belagavi, Karnataka, India. Dalmeida, K. M., & Masala, G. L. (2021). HRV features as viable physiological markers for stress detection using wearable devices. Sensors, 21(9), 2873. Devi, D., Sophia, S., Janani, A. A., & Karpagam, M. (2020). Brain wave based
cognitive state prediction for monitoring health care conditions. Materials Today: Proceedings. Fu, R. et al. (2022). Symmetric convolutional and adversarial neural network enables improved mental stress classification from EEG. IEEE Transactions on Neural Systems and Rehabilitation Engineering, 30, 1384–1400.
Construction of a VR Multimodal Dataset for Stress Recognition 129
Huppert, D., Grill, E., & Brandt, T. (2013). Down on heights? One in three has visual height intolerance. Journal of Neurology, 260(2), 597–604. Ji, S. Y., Kang, S. Y., & Jun, H. J. (2020). Deep-learning-based stress-ratio prediction
model using virtual reality with electroencephalography data. Sustainability, 12(17), 6716. Kim H-g, Song S, Cho BH, Jang DP (2024) Deep learning-based stress detection for daily life use using single-channel EEG and GSR in a virtual reality interview paradigm. PLoS ONE 19(7): e0305864. https://doi.org/10.1371/ journal.pone.0305864 Krijn, M., Emmelkamp, P. M. G., Olafsson, R. P., & Biemond, R. (2004). Virtual
reality exposure therapy of anxiety disorders: A review. Clinical Psychology Review, 24(3), 259–281. McLeod, S. A. (2010). What is the stress response. Simply Psychology. Retrieved from https://www.simplypsychology.org/stress-biology.html (Accessed on October 9, 2020). Perez-Valero E, Vaquero-Blasco MA, Lopez-Gordo MA and Morillas C (2021)
Quantitative Assessment of Stress Through EEG During a Virtual Reality Stress-Relax Session. Front. Comput. Neurosci. 15:684423. doi: 10.3389/ fncom.2021.684423. Peterson, S. M., Furuichi, E., & Ferris, D. P. (2018). Effects of virtual reality high heights exposure during beam-walking on physiological stress and cognitive loading. PLOS ONE, 13(7), e0200306. Rauf, U., & Saeed, S. M. U. (2024). Toward improved classification of perceived
stress using time domain features. IEEE Access, 12, 51650-51664. Seinfeld, S., Bergstrom, I., Pomes, A., Arroyo-Palacios, J., Vico, F., Slater, M., & Sanchez-Vives, M. V. (2016). Influence of Music on Anxiety Induced by Fear of Heights in Virtual Reality. Frontiers in Psychology, 6:1969. Smitha, K. G., Xin, N. Y., Lian, S. S., & Robinson, N. (2017). Classifying
subjective emotional stress response evoked by multitasking using EEG. In 2017 IEEE International Conference on Systems, Man, and Cybernetics (SMC) (pp. 3036–3041). Banff, AB, Canada. Spielberger, C. D. (1983). Manual for the State-Trait Anxiety Inventory (STAI Form Y). Consulting Psychologists Press, Inc. Zanetti, M., Faes, L., Cecco, M. D., Fornaser, A., Valente, M., Guandalini, G. M.,
& Nollo, G. (2018). Assessment of Mental Stress Through the Analysis of Physiological Signals Acquired From Wearable Devices. Italian Forum on Active and Assisted Living.
LISTED IN THE AHFE DIGITAL BOOKSTORE CATALOGUE
Explore the complete digital volume
Metaverse, Virtual Environments and Game Design
Read this individual research paper free through the original publisher, or explore the full digital proceedings book.
ISBN 978-1-964867-54-0
Explore this ISBN in the AHFE Bookstore ↗Listed in the July 2026 bookstore catalogue; search by ISBN to confirm current availability · Digital book purchase optional