Qichao Zhao, Qingju Wang, Ping Wu, Jieyun Fan, Lei Shi, Han Li, Qian Zhou, Ying Gao (2024). A method for analyzing consumer behavior and evaluating marketing effectiveness of online websites based on multimodal data synchronization. In: Usability and User Experience. AHFE Open Access, vol. 156, pp. 107–117. https://doi.org/10.54941/ahfe1005420
A good interface design is crucial for improving user experience, user stickiness and marketing effectiveness in the marketing process of shopping websites. This study is based on subjective and objective multi-modal data synchronization technology, bio-electrical signal technology, eye tracking technology, etc. The aim of the study is to explore the impact of website interface design on website marketing effectiveness. Through researching the emotional experience and behavioral response characteristics of 35 participants who completed browsing and purchasing tasks on three shopping websites (A website, B website and C website), we predicted the effectiveness of website marketing. It was found that during the browsing task, participants displayed significantly higher value of EEG frequency domain indicator α when using A website than those when using B and C websites, and the subjective evaluation score of further attractiveness was significantly higher for website A than those for the other two websites. 62.86% of participants chose website A when executing purchase tasks. In order to predict the marketing effectiveness of the website, 18 sets of modal features were extracted, including photoelectric capacitance pulse wave signal, eye movement state signal, skin electric response signal and EEG signal. The outliers of each feature set were corrected through three-sigma rule, and the corrected features were used as input parameters. The CART decision tree model was used for training. Features were selected and decision trees were constructed based on the Gini impure index. This established a marketing effectiveness model with likes and dislikes as classification objectives.
With the development of network information technology, transaction meth- ods have become more diversified, from traditional offline shopping to online shopping, and further to live streaming website shopping, consumer shopping forms have undergone significant changes. Online shopping has gradually become part of people’s daily life, and is the product of the Internet development, modern logistics industry and online payment.
How to evaluate the process of online shopping, website availability and consumer experience are important factors affecting consumer shopping behavior (Lukáš, 2018). There are various factors that affect the consumer experience of a website, such as web interface interaction design, layout design, color matching design, font design, etc. In web design, it is impor- tant to avoid pure graphic or textual content as much as possible. Relatively speaking, the higher the page layout rate, the better the consumer experience (Tan, Ma, Sun & Liang, 2016). In addition, researchers identified interface design defects through EEG signals and found that when subjects encoun- tered interface UI design defects, ErrP (error potential) would appear (Jeff, Serena, Mark & Leanne, 2013). Through EEG research on the design of graphical consumer interfaces (GUI), some researchers have also found that the emotional design elements of GUI could affect consumers’ cognitive inter- ests and emotional experiences (Ren, Zhang & Zhang, 2020). Eye movement indicators could be used to evaluate the quality of task interface interaction design (Guo, Qu, Zhang, Cao & Liu, 2014). The increase in heart rate could either represent pleasure, or indicated that consumers were browsing poorly designed web pages (Ge, Chen & Liu, 2014). Through eye movement and heart rate variability indicators, researchers found that fixation duration, fix- ation frequency, blinking frequency and HRV indices had strong explanatory power for website usability (Qu, Guo & Vincent, 2017).
Faced with the same shopping scenario, different consumers often exhibit different behavioral responses. In consumer scenarios, differences in con- sumer demand, advertising information processing, purchase preferences, merchant promotions, product discounts, online positive reviews and quan- tity, product prices, product safety, after-sales service, delivery time, brand effect and other aspects can all affect consumer behavior (Yin & Wang, 2013; Shanthi & Desti, 2015; Qian & Huang, 2020). Deng et al. constructed a structural equation model to incorporate merchant reputation, logistics service quality, website functionality and promotional activities into their research on online trust and consumption behavior. They explored online trust and its impact on online consumption behavior in the context of con- sumption upgrade. They found that the quality of logistics services, website functionality and promotional activities had a significant positive impact on online consumption behavior, and online trust played a partial mediating role in it (Deng, Tan & Yuan, 2021).
Currently, many studies on shopping websites focus on studying the impact of a certain part of their content on consumer behavior, and are conducted through one-dimensional data. Most of the research on consumer behav- ior is still based on survey questionnaires. Based on this, this study hopes to analyze and study the shopping experience and consumption behavior of consumers of Internet shopping websites and predict the impact of web- sites with multimodal data and combined method of subjective and objective evaluations.
METHODOLOGY
Participants 35 participants (19 males and 16 females) participated in the experiment, with an age range of 18–45 years old. Participants were required to have
A Method for Analyzing Consumer Behavior and Evaluating Marketing Effectiveness 109
prior experience in online shopping. Participants had no mental illness and didn’t drink alcohol, coffee or other stimulating drinks the day before the experiment. All participants gave consent before the experiment and received gifts at the end of the experiment.
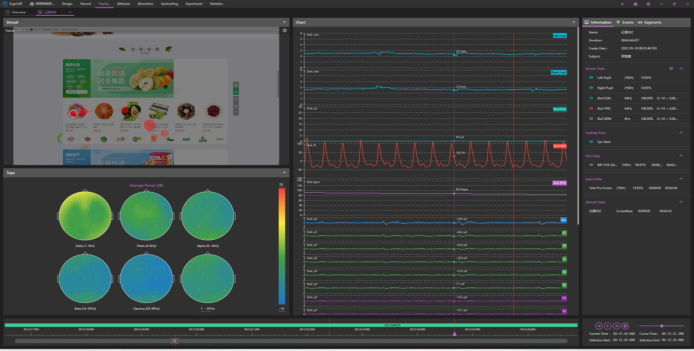
Procedure This study used three shopping websites (A website, B website and C website). All participants were required to complete browsing and shopping tasks on each website. Three browsing tasks were randomly presented, and the sub- sequent shopping tasks were based on the same website that a participant initially chose. Firstly, before the begining of browsing tasks, participants were required to close their eyes and rest for 5 minutes to collect their phys- iological baseline values in a resting state. Then participants had 3 minutes to freely browse the website. After browsing, they were asked to select a website to complete the shopping task. Finally, based on the experience of participants using various websites, a 5-point likert scale was used to collect subjective user preferences for each website, as well as to evaluate website usability (standardization, readability, learnability, ease of naviga- tion and attractiveness). Figure 1 shows the experimental record results of a participant.
Figure 1: Experimental site diagram and record result diagram synchronized.
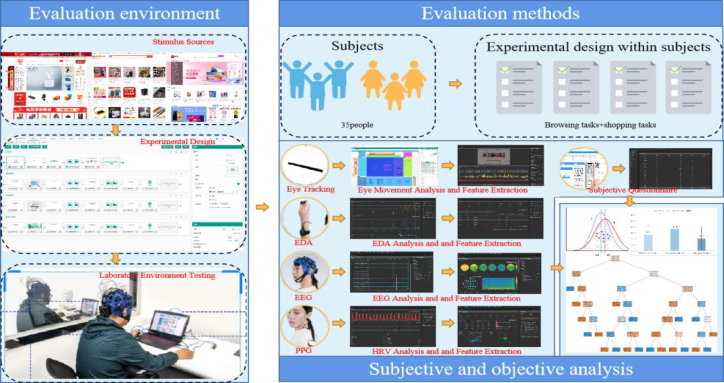
Data Recording, Processing and Analysis This experiment was conducted in the laboratory of Beijing ErgoAI Research Institute. The experimental design was edited using the ErgoLAB Human- Machine-Environment Synchronization Platform (ErgoLAB) Design module, and physiological data, eye movement data, EEG and subjective question- naire data were simultaneously collected.
The ErgoLAB EDA sensor (Kingfar, sampling rate 64 Hz, accuracy 0.01 µS) recorded the changes in skin electrical activity of participants’ left and middle fingers. The collected signals were processed and features were
extracted using ErgoLAB EDA analysis software. The ErgoLAB PPG sensor (Kingbar, sampling rate 64 Hz, accuracy 1%) recorded the heart rate and heart rate variability activity at participants’ earlobe area. The signals were processed and features were extracted using ErgoLAB HRV analysis software.
RMS) was used for eye tracking, which recorded the changes in the participants’ eye tracking signals. The eye tracking data was processed and features were extracted using ErgoLAB Eyetracking analysis software.
The EEG data was recorded using Bitbrain 16-electrode wearable EEG system (Bitbrain, sampling rate 256 Hz, resolution 24 bits, CMRR > 100 dB @ 50 Hz). The elecrode positions were Fpz, F7, F8, F3, F4, Fz, C3, C4, Cz, P7, P8, P3, P4, Pz, O1 and O2 according to the 10–20 system. The impedance of EEG sytem remained below 5 K, with the reference electrode at the earlobe position. EEG data was processed and features were extracted using ErgoLAB EEG analysis software.
Finally, in order to study how multi-modal data could accurately predict the effectiveness of marketing, we set labels based on participants’ preference ratings. We edited the questionnaire and collected data through ErgoLAB Questionnaire Module. We divided marketing effectiveness into two category labels based on the 5-level subjective evaluation results, with likes (scores 4 and 5) and dislikes (scores 1, 2 and 3). A total of 105 samples were obtained, among which 59 were likes and 46 were dislikes. Nineteen features were used as input data, including SC, HR, SDNN, RMSSD, SDSD, PNN50, PNN20, LF/HF, SD1, SD2, A++, B--, α,β, α/β, pupil diameter, total fixation duration, blink frequency and scanning amplitude. A decision tree model constructed by CART was used for classification. This decision tree was divided based on the gini coefficient calculated for each feature, and was used to calculate the binary classification (like or dislike) of website marketing effectiveness.
Figure 2: Data collection and analysis process.
A Method for Analyzing Consumer Behavior and Evaluating Marketing Effectiveness 111
RESULT
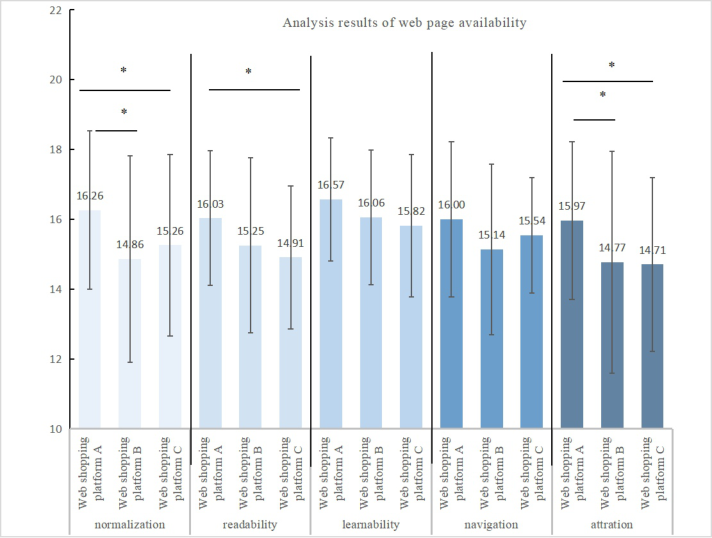
Subjective Questionnaire Result One-way repeated measures analysis of variance (ANOVA) was conducted on the five dimensions of website usability ratings for three websites, namely normativity, readability, learnability, ease of navigation and attractiveness (Figure3). It was found that there were significant differences in norma- tivity (F(2,32)=4.343, p=0.017), readability (F(2,32)=3.741, p=0.029) and attractiveness (F(2,32)=3.569, p=0.034). Multiple comparison tests showed significant differences in normativity and attractiveness between A and B websites, as well as between A and C websites.There was a significant dif- ference in readability between A and C websites.There was no significant difference between ease of learning (F(2,32)=2.794, p=0.058) and readabil- ity (F(2,32)=2.331, p=0.105). A website scored higher than B and C websites in these five dimensions, with higher scores indicating more standardized interface design, easier understanding, stronger learning and navigation, and greater attractiveness.
Figure 3: Analysis results of web page usability.
Behavioral Result Twenty-two participants chose website A for shopping experience, account- ing for 62.86% of the total. Six participants chose website B, accounting for 17.14% of the total. Seven participants chose website C, accounting for 20%
of the total. Wee divided the entire shopping experience into three stages, namely target product search stage, target determination stage and payment stage. We then divided the task completion time into three levels, with fast completion time less than 10 seconds, medium completion time between 10 to 20 seconds and slow completion time more than 20 seconds. The number of participants in each stage and task was analyzed, and chi square analysis (χ2=11.2, df = 4, p=0.024) showed significant differences.
Physiological Result Results from one-way repeated measures ANOVA showed that there was no significant difference in the electrodermal index (SC) (F(2,32)=0.62, p=0.541). But partcipants using B website showed the highest value during browsing task, while participants using A and C websites had lower values. The results are shown in Table 1.
Table 1. EDA analysis result.
Table available in the original PDF paper.
Website SC A Website 0.63(1.52) B Webstie 0.7(1.33) C Website 0.63(1.1)
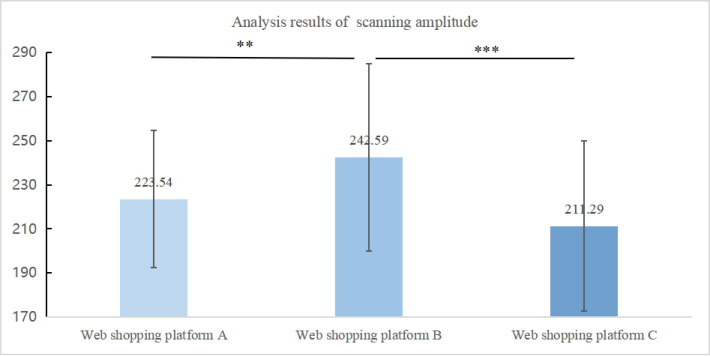
Eye Tracking Result Results from one-way repeated measures ANOVA showed that there was a significant difference in the scanning amplitude of the eye movement (F(2,32)=9.202, p=0.000) (Figure 4). Multiple comparison tests showed that the scanning amplitude of website B was higher than that of websites A and C, and the difference was significant.
Figure 4: Analysis results of scanning amplitude.
A Method for Analyzing Consumer Behavior and Evaluating Marketing Effectiveness 113
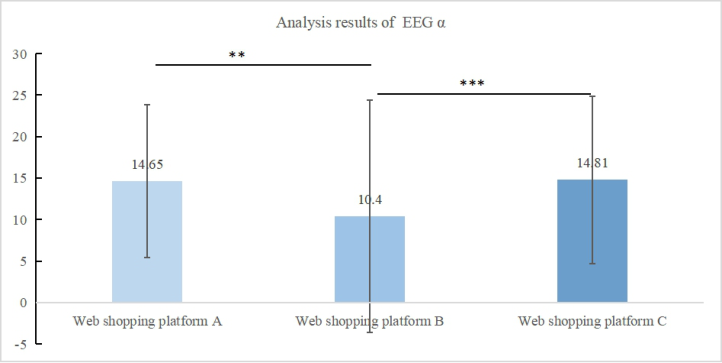
EEG Result There was a significant difference in EEG indicators α (F(2, 32)=29.638, p=0.000) (Figure 5). Multiple comparison tests showed significant differ- ences between websites B and A, as well as between websites B and C, with B having the lowest value.
Figure 5: Analysis results of EEG data α.
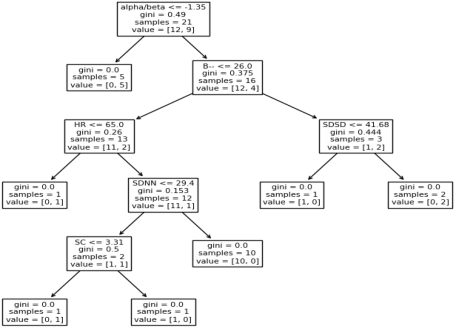
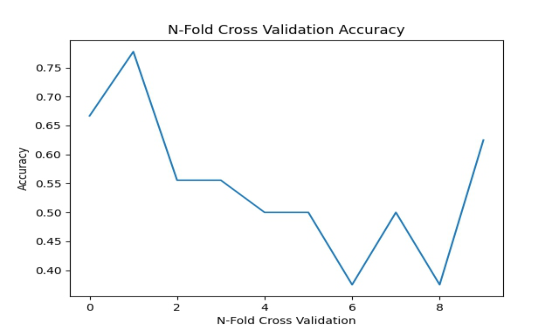
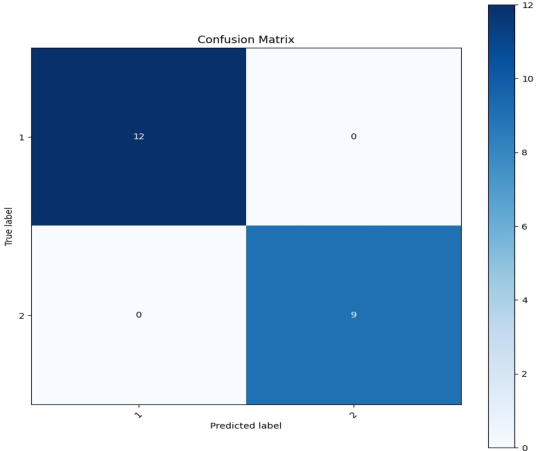
Classification Result Gini coefficient is a method for measuring dataset diversity in decision trees, especially in decision tree learning methods. It can help us better establish decision tree models, compare the accuracy of different classification vari- ables, and discover the best splitting point. The smaller the Gini coefficient, the higher the purity of the dataset and the better the feature selection. Gen- erally speaking, a Gini coefficient less than 0.2 indicates a high purity of the dataset, while a coefficient greater than 0.5 indicates a low purity of the dataset. From Figure 6, it can be concluded that for the multimodal data of this experiment, the features that have an improvement in purity for the deci- sion tree are: SDNN, HR β--, SDSD α/β, Accounting for 26.3% of the total feature quantity. A 10 fold cross validation was performed on the training set by randomly allocating the test set and training set (21 samples in the test set, 84 samples in the training set, and 24 random parameters) at a ratio of 2:8. The results are shown in Figure 7, with an average accuracy of 54.3%. The accuracy on the test set is 100%, and the corresponding prediction confusion matrix on the test set is shown in Figure 8.
Figure 6: Model structure diagram after decision tree training.Figure 7: Training set 10 fold cross validation results.Figure 8: Decision tree model predicts results on the test set.
A Method for Analyzing Consumer Behavior and Evaluating Marketing Effectiveness 115
DISCUSSION
The two main objectives of this study were (1) to analyze website consumer behavior, participants’ experience during browsing tasks and behaviors dur- ing purchasing tasks, and (2) to further predict the marketing effectiveness of shopping websites based on multi-modal data. To achieve these goals, we designed an experiment requiring participants to complete browsing and shopping tasks separately on three shopping websites, while collecting participants’ multi-modal subjective and objective data.
Subjective evaluation results showed that A website scored the highest on usability among then three websites, outperforming in standardization, readability, learnability, ease of navigation and attractiveness. B website had the lowest evaluation score in standardization and ease of navigation, and C website had the lowest evaluation score in readability, ease of learning and attractiveness. In terms of shopping website selection, the number of peo- ple who chose A website was also the highest. The ease of use and trust of consumers in online shopping websites had significant impacts on their willingness to use a certain website for online shopping (Kiew, Zuha, Nasia, 2021). At the same time, participants’ SC index of skin conductance when using website B was higher than those when using websites A and C. Related stud- ies have found that when browsing poorly-designed websites, people show higher skin conductance level than that when they browse well-designed web- sites (Ward & Marsden, 2003). However, there was no significant difference in participants’ SC when using different shopping websites, which might be related to significant individual differences among participants, which reulted in non-significant changes in physiological indicators (Cao, 2014).
Participants’ scanning amplitude when website B was higher than thosse when usingwebsites A and C, and the difference was significant. The shorter the scanning amplitude, the more direct and effective the browsing activity was (Robin, Anna & John, 2011).
Participants’ EEG α value when using website B was lower than those when using websites A and C, and the difference was significant. Brain α wave appears in a relaxed state, with higher levels indicating more relaxed states.
Another important purpose of the study is to identify website marketing effectiveness through multimodal data, and to discover physiological (SDNN, HR, SDSD) and EEG indicators( β--, α/β) can predict website marketing preferences effectively.
This study indicated that the application of multi-modal data sources for measuring consumer behavior and website marketing effectiveness was fea- sible. However, in future research, the limitations of this study should also be considered. Firstly, this study selected currently formed online shopping websites, and did not explore the reasons for differences in participant feel- ings and choices during the analysis and research process. It is unclear which factors led to the final result, and a careful analysis should be conducted in subsequent research. Secondly, this study only selected commonly used data sources such as physiology, eye movement and EEG. In future research, new measurement methods such as functional near-infrared measurement can be
considered, and more methods can be considered, such as entropy analysis and analysis of eye movement areas of interest. In addition, when predict- ing marketing effectiveness, only prediction work was carried out without model verification, and there were many features, which is not conducive to practical promotion and application.
CONCLUSION
With the continuous development of e-commerce, online shopping has become a trend, and the factors that affect consumer shopping behavior and decision-making cannot be ignored. This study evaluated three different online shopping websites using multi-modal data sources including physio- logical, eye movement, EEG and subjective evaluation data. It was found that A website had the best usability and most consumers were willing to make shopping choices on it. Meanwhile, our research findings indicated that the marketing effectiveness prediction of online shopping websites can be achieved through multi-modal physiological, eye movement and EEG data. Future research can use this research method and results to guide the inter- face design and development of online shopping websites, in order to improve website usability and marketing effectiveness, thereby increasing consumer user stickiness.
ACKNOWLEDGMENT
This study was supported by the “Scientific Research Support” project provided by Kingfar International Inc. Thanks for the research technical and ErgoLAB Man-Machine-Environment Synchronization Platform V3.0 related equipment support from Kingfar project team.
REFERENCES
Cao Yaqin (2014). Research on Emotional Design of E-commerce Websites Based on Multimodal Measurement. Northeastern University. Deng Weibin, Tan Chunli, Yuan Ye (2021). Research on Online Trust and Its Influ-
ence on Online Consumption Behavior under Consumption Upgrading. Journal of Chongqing University of Posts and Telecommunications Volume 33, No. 5, pp. 116–125. doi: 10.3979/1673-8268.20210107003. Guo Fu, Qu qingxing, Zhang Xiaying, Cao Yaqin, Liu Weilin (2014). Research on the Relationship between Eye Movements and Website Design Elements. Industrial Engineering and Management Volume 19, No. 5, pp. 129–139. Ge Yan, Chen Yanan, Liu Yanfan (2014). Electrophysiological Measures Applied in
User Experience Studies. Advances in Psychological Science Volume 22, No. 6, pp. 959–967. doi: 10.3724/SP.J.1042.2014.00959. Hong Ren, Chunyu Zhang, Ningning Zhang (2020). Research on EEG-based Graphic User Interface Kansei Design Evaluation. E3S Web of Conference, pp. 1–6. doi: 10.1051/e3sconf/202017902103. Jeff Escalante, Serena Butcher, Mark R. Costa & Leanne M. Hirshfield(2018). Using
the EEG Error Potential to Identify Interface Design Flaws. International Confer- ence on Augmented Cognition. pp. 289–298.
A Method for Analyzing Consumer Behavior and Evaluating Marketing Effectiveness 117
Kiew Chee Ching, Zuha Rosufila Abu Hasan, Nadia Abu Hasa (2021). Factors Influencing Consumers in Using SHOPEE For Online Purchase Intention in East Coast Malaysia. Universitr Malaysia Terengganu Journal of Undergraduate Research. pp. 45–56. doi: 10.46754/umtjur.v3i1.191. Lukáš Kakalejˇcík, Jozef Bucko (2018). Website Usability and User Experi- ence During Shopping Online from Abroad. Researchgzte. pp. 205–219. doi: 10.15240/tul/001/2018-3-013. Qian Qiannian, Huang Zhixi (2020). A Study on the Influence of Personal and
Commodity Factors on the Impulsive Online Consumption Behavior of Young People. Commercial Research Volume 17, pp. 6–8. Qing-Xing Qu, Fu Guo, Vincent G. Duffy (2017). Effective use of human physiological metrics to evaluate website usability: An empirical investigation from China. Aslib Journal Ofinformation Management Volume 69, No. 4, pp. 370–388. doi: 10.1108/AJIM-09-2016-0155. Robin L. Hill, Anna Dickinson, John L. Arnott. Peter Gregor (2011). Older Web Users’ Eye Movements: Experience Counts. Proceeding of the International Con- ferebce on Human Factoes in Computing Systems. doi: https://doi.org/10.1145/ 1978942.1979115. R. Shanthi, Desti Kannaiah (2015). Consumers. Perception on Online Shop-
ping. Journal of Marking and Consumer Research. pp. 14–21. Tan Zhengyu, Ma Mengyun, Sun Jiahao, Liang Chenxi (2016). User Experience Research of Web Picture Rate Based on Physiological Electric Technology. Pack- aging Engineering Volume 37, No. 22, pp. 97–101. Ward, R. D., & Marsden, P. H. (2003). Physiological responses to different Web
page designs. International Journal of Human-Computer Studies. pp. 199– 212. doi: https://doi.org/10.1016/S1071-5819(03)00019-3. Yin Feifan, Wang Yong (2013). Regulatory Focus in Consumer Behav- ior Research. Advances in Psychological Science Volume 21. No. 2, pp. 347–357. doi: 10.3724/SP. J.1042.2013.00347. Zhang Chunbing, Li Jingdong, Wu Bo, Li Yina (2017). The Relationship between Atmospheric Cues and Perceived Interactivity on the Online Shopping Web- sites. Management Review Volume 29, No. 8, pp. 91–98.
LISTED IN THE AHFE DIGITAL BOOKSTORE CATALOGUE
Explore the complete digital volume
Usability and User Experience
Read this individual research paper free through the original publisher, or explore the full digital proceedings book.
ISBN 978-1-964867-32-8
Explore this ISBN in the AHFE Bookstore ↗Listed in the July 2026 bookstore catalogue; search by ISBN to confirm current availability · Digital book purchase optional