Sodai Kondo, Hisaya Tanaka (2025). Evaluating Comfort and Performance with Composite Frequency in SSVEP-BCI. In: Human Factors in Design, Engineering, and Computing. AHFE Open Access, vol. 199, pp. 639–649. https://doi.org/10.54941/ahfe1006876
Steady-state visual evoked potential (SSVEP)-based brain-computer interface (BCI) offer high accuracy, fast response, and multiple input options. However, the flickering stimuli used to induce SSVEP can cause discomfort and visual fatigue. Improving user comfort without degrading performance is an important challenge in practical SSVEP-BCI applications. In this study, we developed an SSVEP-BCI using composite visual stimuli that combine high- and low-frequency flickers. Low-frequency flickers typically elicit stronger SSVEP responses, while high-frequency flickers are generally more comfortable. We hypothesized that combining both could improve comfort while maintaining BCI performance. Five stimulus conditions were tested by varying the high-to-low frequency ratio: 0%: 100%, 25%: 75%, 50%: 50%, 75%: 25%, and 100%: 0%. Each participant used the SSVEP-BCI with four inputs under all five conditions. Subjective comfort was evaluated using a 6-point scale. Results showed that BCI accuracy increased with a higher proportion of low-frequency content. The mean classification accuracies for high-frequency ratios of 100%, 75%, 50%, 25%, and 0% were 61.11±1.26%, 95.56±2.79%, 95.28±0.94%, 98.61±2.78%, and 98.61±1.39%, respectively. However, even with a higher proportion of high-frequency content, performance remained at a practically usable level. In contrast, subjective comfort scores increased with a higher proportion of high-frequency content, recorded as 5.67, 4.33, 3.22, 2.00, and 2.44, respectively. These findings indicate that composite flicker stimuli can enhance comfort while preserving SSVEP-BCI performance. Adjusting the frequency ratio allows for flexible optimization depending on the application context.
Brain-computer interface (BCI) that use steady-state visual evoked potential (SSVEP) have high information transfer capability.In terms of the information transfer rate (ITR), which is used as an index of BCI, SSVEP-BCI with 267 bits/min (Chen et al., 2015) and 325 bits/min have been proposed (Nakanishi et al., 2018). The challenge of SSVEP-BCI is the discomfort caused by the flickering stimuli used to induce SSVEP (Fisher et al., 2005; Yamauchi et al., 1998; Uchida and Mizuno, 2014). Typically, the flickering stimulus for SSVEP initiation comprises a signal with a single frequency. However, in this study, we aimed to maintain the performance of the SSVEP- BCI while reducing the discomfort caused by the flickering stimulus by using a composite frequency stimulus that adds three times the normal stimulus frequency. The purpose of this study was to evaluate the effects of the composite frequency stimulus and its ratio on users’ subjective feelings and BCI performance. In this study, we conducted an SSVEP-BCI operation
test. We also evaluated the feeling when gazing at the composite frequency stimulus while changing its mixture ratio and evaluated the superiority of the composite frequency stimulus compared to the traditional flickering stimulus.
BCI connects the human brain to computers (Vidal, 1973). BCI enables people to directly input will as text or commands from their brains to a computer. BCI is used in healthcare, for example, to support people with disabilities (Kondo and Tanaka, 2023; Kondo and Tanaka, 2024) and to predict dementia (Morooka et al., 2021).
One method of BCI operation is applying a specific stimulus to a human and using the response. SSVEP is a response in which the frequency components of the same frequency as the flickering stimulus increase in the primary visual cortex of the occipital lobe when the human gazes at a flickering stimulus (Lotte, 2018). In addition, harmonic components such as two or three times the stimulus frequency increase (Zhu et al., 2010). The detectable range of SSVEP is typically 6–75 Hz (Herrmann, 2001; Luck, 2014), and the amplitude is maximum at approximately 15 Hz (Ku´s et al., 2013; Pastor et al., 2003). It is important to pursue comfort in BCI, and care must be taken when designing SSVEP-BCI. The stress caused by the flickering stimuli presented to induce SSVEP has negative effects on BCI users, such as the risk of photic epilepsy (Fisher, 2005; Yamauchi et al., 1998) and discomfort (Kondo and Tanaka, 2023; Uchida and Mizuno, 2014). Studies on high-frequency stimulation SSVEP-BCI have reported a drawback: the reduction of SSVEP makes it difficult to achieve both high accuracy and a large number of inputs, leading to a lower ITR (Hsu et al., 2020; Sakurada et al., 2015).
Many previous studies on composite frequency SSVEP-BCI have focused on increasing the number of inputs; however, some have used the composite frequency to reduce visual fatigue caused by flickering stimuli (Li et al., 2023). We hypothesized that composite-frequency stimulation combining low- and high-frequency components could preserve the SSVEP response while reducing discomfort (Kondo et al., 2023). In this study, we propose an SSVEP-BCI that uses a composite frequency comprising the stimulation frequency and high-frequency stimulation three times higher than the stimulation frequency.
The purpose of this study was to clarify the effect of composite-frequency stimulation on people’s subjective perception and objective performance, such as BCI operation ability. In addition, we verified the effect of composite- frequency stimulation on SSVEP-BCI in more detail by evaluating BCI performance and comfort while changing the mixture ratio of low- and high-frequency stimulation.
THEORY Composite-Frequency Stimulation
The reason for using a high frequency three times higher than the stimulation frequency for the composite frequency stimuli is to improve the detection ability of SSVEP. In this study, the performance of the SSVEP-BCI was compared by changing the mixture ratio of the sine waves in the composite frequency stimuli. Therefore, the main subject of the analysis was the
Evaluating Comfort and Performance With Composite Frequency in SSVEP-BCI 641
low-frequency stimulus, and the three-times higher-frequency stimulus was considered an element to improve the detection ability of SSVEP while improving comfort.
Stimulus Frequency Design The blinking stimulus is presented by modulating the luminance of the composite frequency. The low-frequency stimuli were 10, 12, 14, and 16 Hz, and the high-frequency stimuli were three times higher (30, 36, 42, and 48 Hz). The blinking stimuli were presented on a liquid crystal display (LCD). When constructing a simple on/off blinking stimulus using a LCD, the stimulus frequency that can be presented is limited to a sub-multiple of the LCD refresh rate. In this study, we used a method of modulating the luminance of the stimulus frequency in a sinusoidal manner following Chen et al. (Chen et al., 2014). The sinusoidal luminance-modulated stimulus is defined by Eq. (1), where n represents the frame number, fi denotes the stimulation frequency, and rRaterRate denotes the LCD refresh rate.
n
io
1 + sin h
Equations and mathematical formulas are available in the original paper PDF.
Stim
n, fi
In this study, a composite frequency was created by adding two sinusoidal stimuli, Stimlow and Stimhigh. The formula used to create the composite frequency is expressed in Eq. (2).
2 (2)
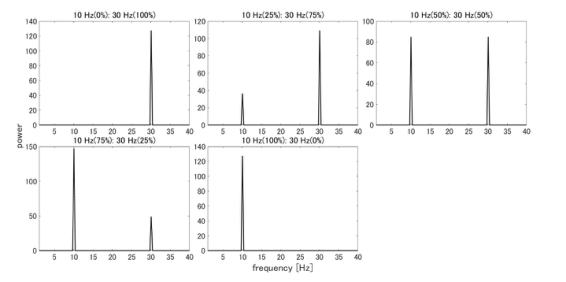
where Rlow denotes the low-frequency composite ratio, and Rhigh denotes the high-frequency composite ratio. In this study, the composite ratio of low (Rlow) and high (Rhigh) frequencies was verified in five patterns, 0:1, 0.25:0.75, 0.50:0.50, 0.75:0.25, and 1:0, or in the reverse order. Figure 1 shows the frequency components of the composite frequency used in this study. Figure 1 shows the frequency components when the composite ratios are 0%:100%, 25%:75%, 50%:50%, 75%:25%, and 100%:0%, the low frequency is 10 Hz, and the high frequency is 30 Hz.
Figure 1: Frequency ratio in composite frequency (10 and 30 Hz, 0% and 100%, 25% and 75%, 50% and 50%, 75% and 25%, 100% and 0%).
642 Kondo and Tanaka
Learning Canonical Correlation Analysis CCA is a statistical method for integrating and analyzing inputs from multiple information sources. This method determines linear transformation parameters such that the correlation coefficient of linearly transformed values of multiple data is maximized (Akaho, 2013). In this study, we used learning CCA (LCCA), an analysis method based on CCA. When detecting SSVEP using CCA, if the observed signal measured using an electroencephalograph is denoted data x and the reference signal is denoted data y, data y is defined by Eq. (3) according to Chen et al. (2014).
where i represents the frequency number, fi denotes the stimulation frequency, j/2 denotes how many times the signal is larger than the stimulation frequency, fs denotes the sampling rate of the EEG device, and T represents the number of samples. When the sample averages of x and y are set to 0, the values obtained by linearly transforming u (x) and v(y) are given by Eqs. (4) and (5).
CCA is a method to determine the linear transformation parameters a and b such that the correlation coefficient ρ(u (x) , v (y)) between u (x) and v(y) is maximized (Akaho, 2013). When constructing an SSVEP- BCI using CCA, the maximum value of the SSVEP for each stimulation frequency may differ. In our previous study, we proposed a method called LCCA, which is a CCA variant that considers the magnitude relationship of the SSVEP (Kondo and Tanaka, 2023). LCCA obtains the SSVEP for each stimulation frequency when not gazing from the training data. By defining the SSVEP when not gazing as the SSVEP when normal, we can calculate the degree to which the SSVEP when gazing has increased relative to that when it is normal. If the average SSVEP when not gazing is Cnt−mean and the average SSVEP when gazing is Ct−mean, the SSVEP ratio is given by Eq. (6).
The ratio has the same number of elements as the stimulus frequency. Therefore, ratio = ratio1, ratio2, . . . , ratiok. Here, k represents the number of input options. LCCA estimated that the subject gazed at the flashing stimulus corresponding to ratiomax, which obtained the maximum value among the ratio (Kondo and Tanaka, 2025).
Evaluating Comfort and Performance With Composite Frequency in SSVEP-BCI 643
EXPERIMENT Structure of SSVEP-BCI
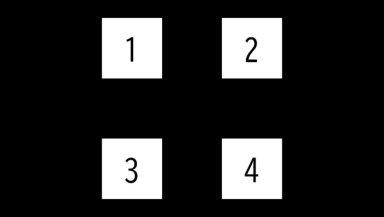
The proposed SSVEP-BCI comprises three elements: a blinking stimulus screen, an EEG device, and a data collection function. The blinking stimulus screen is shown in Figure 2. The white square objects are blinking stimuli, and the stimulus frequencies are 10, 12, 14, and 16 Hz, in the order of numbers 1–4. The size of the blinking stimulus is 300 × 300 pixels. The LCD refresh rate is 120 Hz, and the resolution is 1920 × 1080 pixels. The subjects wore a Nihon Koden EEG 1000 (1 kHz) electroencephalograph. The position was adjusted so that the distance between the LCD and the face was 50 cm. The experimental software was MATLAB R2022b. The blinking stimulus was designed and controlled using Psychtoolbox-3. The measurement data were recorded from the analog output port of the EEG 1000 to a National Instruments USB DAQ 6218 (16bits) and collected via MATLAB’s Data Acquisition Toolbox.
Figure 2: SSVEP-BCI flashing stimulation display.
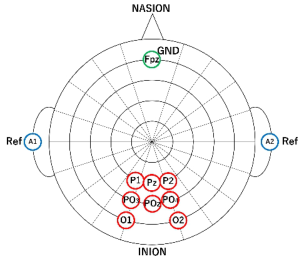
The positions of the measurement electrodes are shown in Figure 3. The electrodes on the head were placed at 11 locations based on the extended 10–20 method recommended by the International Federation of Clinical Neurophysiology (Nuwer et al., 1998). The electrode positions were Fpz (GND), A1 (Ref.), A2 (Ref.), P1, Pz, P2, Po3, Poz, Po4, O1, and O2.
Figure 3: Measurement area.
644 Kondo and Tanaka
SSVEP-BCI OPERATION TEST In this study, the usefulness of the composite-frequency stimulation was evaluated via a four-value classification-type SSVEP-BCI operation test. The stimulation frequencies were 10, 12, 14, and 16 Hz. The subjects performed 10 trials of gazing at each flashing stimulus for 40 trials in five sets. Each set was distinguished by the mixing ratio of the composite frequency. The measurement time per session was 5 s, with an interval of 1 s. The interval between sets was 30 s. The square object was lit red to indicate to the subject, which blinking stimulus to gaze at. During the experiment, the lights in the room were turned off, and blackout curtains were installed on the windows. This study was conducted on nine male students aged 21–24 years who were affiliated with Kogakuin University. The subjects were given an explanation of the experiment procedure and provided written consent before the experiment.
Comfort Evaluation of Composite-Frequency Stimulation After the experiment described in Section 3.2, the subjects evaluated the difference in comfort according to the mixing ratio of the composite frequency in the same environment. The stimulation frequency was 10 Hz, and the low-frequency ratios of the composite frequency were 0%, 25%, 50%, 75%, and 100%. The flickering stimuli were presented every 3 s, switching between the rates. The flickering stimuli were played in a loop until the subjects finished their evaluation. The evaluation was performed on a 6-point scale ranging from 1 (most uncomfortable) to 6 (comfortable) following previous studies (Li et al., 2023).
RESULT
The experimental results described below are distinguished by two factors: data length, and the mixing ratio of the composite frequency stimulus. The data length was controlled to evaluate changes in various evaluation indices over time. The mixing ratio of the composite frequency was used to examine the ratio at which SSVEP-BCI can achieve comfort while maintaining high BCI accuracy.
BCI Accuracy
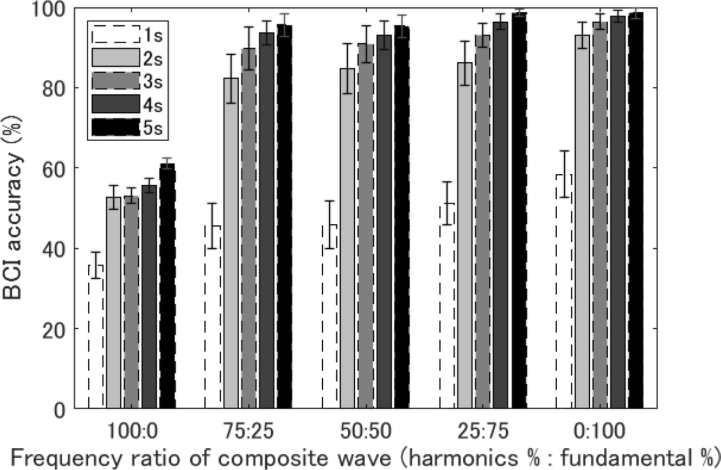
Figure 4 shows the BCI accuracy (%) of the head-EEG SSVEP-BCI. BCI accuracy is an index of how accurately SSVEP-BCI can be operated. The number of times that the stimulation frequency of the flashing stimulation that a subject gazed at matched the stimulation frequency of the analysis result is the number of correct answers. If the number of correct answers is represented by c and the number of trials is represented by k, the BCI accuracy P is given by Eq. (7).
k (7)
Evaluating Comfort and Performance With Composite Frequency in SSVEP-BCI 645
The analysis results are distinguished by the mixing ratio of the composite frequency and the data length. The horizontal axes in Figure 4 represent the mixing ratio of the composite frequency expressed as high frequency (%): low frequency (%). The difference in data length is indicated by the legend in the upper right corner of the graph. The grayscale of the bar graph is displayed in 1-s increments from 1 to 5 s in the lightest colors. When the high-frequency ratios in the composite frequency were 100%, 75%, 50%, 25%, and 0%, the BCI accuracy was 61.11 ± 1.26, 95.56 ± 2.79, 95.28 ± 0.94, 98.61 ± 2.78, and 98.61 ± 1.39%, respectively.
Figure 4: SSVEP-BCI accuracy. The mixing ratio of the composite wave is expressed as high frequency: low frequency (%). The data length is expressed as the gray scale of the bar graph.
ITR
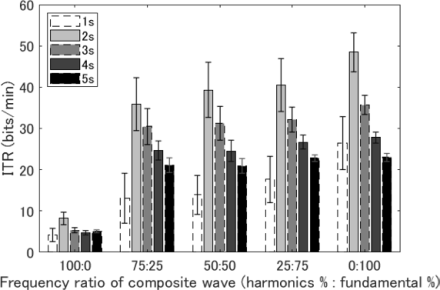
Figure 5 shows the ITR values (bits/min), respectively. The ITR is an index of the performance of BCI, and indicates how much information can be transmitted in a certain period. The ITR is expressed by Eqs. (8) and (9) depending on the input options N,input accuracy P,and input interval t (Chen et al., 2014).
1 −P
The analysis results are differentiated by the mixing ratio of the composite frequency and the data length. The horizontal axes in Figure 5 represent the
646 Kondo and Tanaka
mixing ratio of the composite frequency expressed as high frequency (%): low frequency (%). The difference in data length is indicated by the legend in the upper right corner of the graph. The grayscale of the bar graph is displayed in 1 s increments from 1 to 5 s in the lightest colors. The vertical axes in Figures 5 represent the ITR values (bits/min). When the high-frequency ratios in the composite frequency were 100%, 75%, 50%, 25%, and 0%, the ITR were 8.24 ± 1.53, 35.90 ± 6.45, 39.33 ± 6.64, 40.52 ± 6.44, and 48.46 ± 4.71 bits/min, respectively.
Figure 5: SSVEP-BCI ITR. The mixing ratio of the composite wave is expressed as high frequency: low frequency (%). The data length is expressed as the gray scale of the bar graph.
Comfort Level
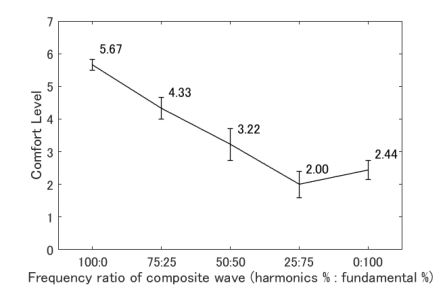
Figure 6 shows the subjective evaluation results of the subjects for a composite frequency of 10 Hz and three times its frequency (30 Hz). Comfort levels are rated on a scale of 1–6, with a higher score indicating greater comfort. The results presented in Figure 6 are differentiated by the composite-frequency mixing ratio. The horizontal axis in Figure 6 represents the composite-frequency mixing ratio, expressed as high frequency (%): low frequency (%).
Figure 6: Comfort level. The mixing ratio of composite frequency is expressed as high frequency (%): low frequency (%).
Evaluating Comfort and Performance With Composite Frequency in SSVEP-BCI 647
DISCUSSION
Differences in BCI Performance and Comfort Score Depending on Composite Frequency Mixing Ratio In this study, we proposed a low- and high-frequency mixed-stimulus SSVEP- BCI. Figures 4–6 show the SSVEP-BCI test performed while changing the ratio of the mixed-stimulus and the subjective evaluation of the subjects. As shown in Figure 6, the subjects tended to perceive the flickering stimulus more favorably when the high-frequency component was larger. This trend has been demonstrated in previous studies (Kondo and Tanaka, 2023). Conversely, the BCI accuracy and ITR tended to be higher when the low- frequency component was larger. This may be because it is easier to induce SSVEP at low frequencies (Ku´s et al., 2013; Pastor et al., 2003).
It is important to obtain practical performance as a BCI while reducing the discomfort caused by flickering, which is a problem associated with low- frequency SSVEP-BCI.In Figure 4 shows, BCI accuracy was greater than 95% except when the high-frequency ratio was 100%. As subsequently discussed, as shown in Figure 4, the data length appeared to have a greater influence on BCI accuracy than the mixed ratio of the composite frequency.
Changes in Composite Frequency Stimulus SSVEP-BCI Performance DUT to DATA Length We now discuss how changes in data length interact with the mixing ratio of the composite frequency. As shown in Figure 4, the BCI accuracy improved as the data length increased. However, as shown in the ITR in Figure 5, when the data length is too long, the ITR decreases. Based on the BCI accuracy and ITR data length changes, the mixing ratio of the composite frequency is not a decisive factor in determining its suitability for application to BCI. However, increasing the mixing ratio of the composite frequency reduces the discomfort of the flickering stimulus while decreasing BCI performance. Therefore, it is preferable to determine and use the allowable mixing ratio according to the target performance of the designed SSVEP-BCI. For example, if the accuracy of the entire user is 90% and the measurement time is set to 3 s, the allowable mixing ratio of the high-frequency component in the composite frequency is 25%. If the measurement time is extended to 4 s, a synthetic stimulus with a high-frequency ratio of 50% can also be used. In future study, we plan to propose a system that changes BCI parameters according to the user characteristics and purpose of SSVEP-BCI.
CONCLUSION
In this study, we proposed and evaluated composite-frequency stimulation SSVEP-BCI to reduce the discomfort caused by flickering stimulation. The results of the four-input classification SSVEP-BCI experiment showed that SSVEP-BCI can be operated using composite frequency stimulation, as shown in Figures 4 and 5. The subjective evaluation of the discomfort associated with composite-frequency stimulation presented in Figure 6 showed that the higher the high-frequency ratio in the composite frequency, the more
648 Kondo and Tanaka
comfortable the composite-frequency SSVEP-BCI. Based on these findings, composite-frequency stimulation can be used to construct a BCI that achieves BCI performance comparable to that of a conventional low-frequency SSVEP-BCI while causing less discomfort from flickering stimulation than a conventional low-frequency SSVEP-BCI. The degree of discomfort varies depending on the composite-frequency mixing ratio and data length. Therefore, in future work, we plan to continue to study a mechanism for adjusting the mixing ratio according to the required performance of the BCI.
ACKNOWLEDGMENT
This work was supported by JSPS KAKENHI Grant Numbers JP24KJ1973, JP22K12913.
REFERENCES
Akaho, S. (2013). Introduction to canonical correlation analysis Mutual information extraction from multimodal observations. Japanese Neural Network Society, Vol. 20, No. 2, pp. 62–72 (In Japanese). Chen, X., et al. (2014). A high-ITR SSVEP-based BCI speller. Brain-Computer
Interfaces, Vol. 1, No. 3–4, pp. 181–191. Chen, X., et al. (2015). High-speed spelling with a noninvasive brain–computer interface. PNAS, Vol. 112, No. 44, pp. E6058–E6067. Fisher, S. R, et al. (2005). Photic- and Pattern-induced Seizures: A Review for the
Epilepsy Foundation of America Working Group. Epilepsia, Vol. 46, No. 9, pp. 1426–1441. Herrmann, S. C. (2001). Human EEG responses to 1–100 Hz flicker: resonance phenomena in visual cortex and their potential correlation to cognitive phenomena. Experimental Brain Research, Vol. 137, pp. 346–353. Hsu, C. C, et al. (2020). Extraction of high-frequency SSVEP for BCI control
using iterative filtering based empirical mode decomposition. Biomedical Signal Processing and Control, Vol. 61, pp. 1–12. Kondo, S. and Tanaka, H. (2023). Effort and issues in development of highfrequency stimulus SSVEP-BCI for flicker stress reduction. Japan Society of Kansei Engineering, Vol. 22, No. 3, pp. 217–228 (In Japanese). Kondo, S. and Tanaka, H. (2023). High-frequency SSVEP–BCI with less flickering
sensation using personalization of stimulus frequency. Artificial Life and Robotics, Vol. 28, pp. 803–811. Kondo, S. and Tanaka, H. (2024). EEG Measurement Site Suitable for SSVEP-BCI Assuming Aphasia. Computers Helping People with Special Needs, pp. 232–240. Kondo, S. and Tanaka, H. (2025). Proposal of SSVEP ratio for Efficient Ear-EEG
SSVEP-BCI Development and Evaluation. Artificial Life and Robotics, Vol. 30, pp. 32–41. Ku´s, R., et al. (2013). On the Quantification of SSVEP Frequency Responses in Human EEG in Realistic BCI Conditions. PLOS ONE, Vol. 8, No. 10, e77536. Li, M., Chen, X., and Cui, H. (2023). A High-Frequency SSVEP-BCI System Based on Simultaneous Modulation of Luminance and Motion Using Intermodulation Frequencies. IEEE Transactions on Neural Systems and Rehabilitation Engineering, Vol. 31, pp. 2603–2611.
Evaluating Comfort and Performance With Composite Frequency in SSVEP-BCI 649
Lotte, F., et al. (2018). A review of classification algorithms for EEG-based braincomputer interfaces: a 10 year update. Journal of Neural Engineering, Vol. 15, 031005. Luck, J. S. (2014). An Introduction to the Event-Related Potential Technique, second
edition. MIT Press. Morooka, R., et al. (2020). Early diagnosis method of dementia using BCI and frontal lobe function test. Human Interface, Vol. 22, No. 2, pp. 211–218 (In Japanese). Nakanishi M., et al. (2018). Enhancing Detection of SSVEPs for a High-Speed
Brain Speller Using Task-Related Component Analysis. IEEE Transactions on Biomedical Engineering, Vol. 65, No. 1, pp. 104–112. Nuwer, R. M, et al. (1998). IFCN standards for digital recording of clinical EEG. Electroencephalography and Clinical Neurophysiology, Vol. 106, No. 3, pp. 259–261. Pastor, A. M., et al. (2003). Human Cerebral Activation during Steady-State Visual-
Evoked Responses. Journal of Neuroscience, Vol. 23, No. 37, pp. 11621–11627. Sakurada, T., et al. (2015). Use of high-frequency visual stimuli above the critical flicker frequency in a SSVEP-based BMI. Clinical Neurophysiology, Vol. 126, No. 10, pp. 1972–1978. Uchida, M., and Mizuno, T. (2014). An attempt on quantification evaluation
of visual discomfort to the flickering stimuli by using nasal skin temperature. IEEJ Transactions on Electronics, Information and Systems, Vol. 134, No. 2, pp. 286–292. Vidal, J. J. (1973). Toward Direct Brain-Computer Communication. Annual Review of Biophysics, Vol. 2, pp. 157–180. Yamauchi, T. (1998). Clinical research on photosensitive seizures, Ministry of Health,
Labour and Welfare, 2024/10/07 viewed (In Japanese). Zhu, D., et a. (2010). A Survey of Stimulation Methods Used in SSVEP-Based BCIs.
Computational Intelligence and Neuroscience, 1, 702357.
LISTED IN THE AHFE DIGITAL BOOKSTORE CATALOGUE
Explore the complete digital volume
Human Factors in Design, Engineering, and Computing
Read this individual research paper free through the original publisher, or explore the full digital proceedings book.
ISBN 978-1-964867-75-5
Explore this ISBN in the AHFE Bookstore ↗Listed in the July 2026 bookstore catalogue; search by ISBN to confirm current availability · Digital book purchase optional