Pengli Zhu, Linlin Wang, ChengQi Xue (2025). Dynamic Alarm Information Presentation Strategy under the Influence of Dynamic Elements in Smart Factory. In: Intelligent Human Systems Integration (IHSI 2025): Integrating People and Intelligent Systems. AHFE Open Access, vol. 160, pp. 67–75. https://doi.org/10.54941/ahfe1005811
This study aims to propose a dynamic design strategy to assist operators in swiftly identifying alarm-indicating controls within dynamic background environments. Through comparative data analysis of alarm signals in behavioral experiments, the research identifies the most suitable combination of alarm information for the current smart factory interface, thereby laying the groundwork for improving alarm presentation methods on monitoring interfaces. With the advent of the Industry 4.0 era, the digitalization process is driving contemporary industrial manufacturing towards unmanned and intelligent development. smart factory is an advanced factory that integrates factory automation with complex information technology. hmi acts as a connection between the user and the controlled process by providing important information, alarms, and other features.The application of visual alarm formats in visual display interfaces exhibits diverse characteristics, offering advantages such as rapid capture of user attention, intuitive discernibility, and the proactive provision of situational urgency. However, operators typically engage in sustained attention towards system interfaces, necessitating prolonged focus to identify specific target signals. This process imposes high demands on the operator's perceptual attention levels, and extended periods of attention may lead to visual fatigue and increased cognitive load.In many smart factory human-machine interfaces (HMIs), the incorporation of dynamic elements can partially capture operators' attention, such as dynamic arrows or color blocks indicating the status of flowing pipelines. While these dynamic elements can significantly reduce users' search time for pipeline directions and signal the normal operation of the pipelines, an excess of dynamic information may lead to a decrease in users' visual search efficiency. When an alarm is triggered by a control on a line, it typically indicates an abnormality in the flow rate or valve of the pipeline. Some scholars argue that static alarms are difficult for operators to detect within dynamic backgrounds, which may compromise system safety. Crisp (1988) noted that when multiple moving items are present on a display, the search tends to be limited to the moving set, while static items are often overlooked.{Citation} Conversely, other researchers assert that static objects are generally more conspicuous in dynamic environments. McLeod et al. (1988) demonstrated that operators can identify a stationary target among moving items, and this ability is independent of the number of moving distractors, although the search efficiency remains slightly lower compared to identifying moving targets among stationary distractors. According to the previous theory, the experiment was designed with three independent variables, the background screen color (dark background R17, G31, B54 and light background R242, G242, B242), the dynamic/static alarm signals (differentiated by whether or not they are blinking, and the blinking frequency of 2Hz), and the transparency (10%, 30%, and 50%); as well as two dependent variables: the accuracy rate and the response time.The experimental interface simulates the screen when an alarm signal appears in the monitoring interface of a smart factory, as shown in Fig. 1.The experimental phase consisted of 10 × (2 × 2 × 3 + 5) × 2 groups of trials (10 subjects × (2 background screen colors × 2 blinking signals × 3 transparency levels + 5 no-alarm controls) × two repetitions), for a total of 340 TRAIL trials. The experimental interface was simulated using E-prime 2.0 and the material was edited in AE software.Each trial subjects need to watch a video of the analog monitoring interface, once the alarm signal appears, subjects need to press the “K” key; if no alarm signal appears, choose to press the “D” key. The correct rate and reaction time of the subjects on different visual alarm forms are recorded, and the average correct rate and average reaction time of each group can be statistically obtained after the data output. Conclusions(1) The effect of the transparency of the warning signs on task correctness is significant.(2) The presence of dynamic blinking effect does not have a significant effect on task correctness.(3) Light-colored backgrounds are more likely to be recognized as warning signals relative to dark-colored backgrounds.(4) There was no interaction between the three variables of transparency, flashing frequency, and background color.Application:By analyzing the experimental data, a design strategy suitable for the dynamic interaction background of this smart factory is derived. The research results can be applied to the study of dynamic alarm message presentation in human-machine interfaces containing dynamic elements as background.
With the advent of the era of Industry 4.0, the digitalization process is promoting the continuous development of contemporary industrial manufacturing towards unmanned and intelligent directions. As an advanced factory form that highly integrates factory automation and complex information technology, the smart factory is one. The human-machine interface (HMI) acts as a connection between the user and the controlled process and plays a key role by providing important information, alarms, and other functions (Lavin, 2014). Among the information presented on the digital interface, alarm information is particularly important (Niu, 2018). If alarm information cannot be processed correctly and efficiently, relatively serious consequences may occur. An efficient alarm system must: (i) detect abnormalities and warn operators in a timely manner, and (ii) not mislead, overload, or distract the operator’s attention (Hu et al., 2018).
Visual alarm forms are applied in visual display interfaces, with diverse characterization forms. They have the advantages of quickly capturing users’ attention, being intuitive and easy to distinguish, and actively presenting the emergency state of the situation. People’s attention to the system interface is usually manifested as continuous attention, which requires the operator
to maintain attention for a long time without rest in order to detect specific target signals. This process places extremely high demands on the operator’s perceptual attention level. Moreover, people are prone to visual fatigue and have a relatively high cognitive load when in a state of long-term attention.
In many human-machine interfaces (HMIs) of smart factories, some dynamic elements are often displayed. These dynamic elements can attract the attention of operators to a certain extent, such as using dynamic arrows or color blocks to represent the state of flowing pipelines. Although this can significantly reduce the time for users to search for pipeline flow directions, it also indicates that the pipeline is currently in normal operation. However, excessive dynamic information can easily lead to a decrease in users’ visual search efficiency.
When a certain control on the line gives an alarm, it means that the flow rate of the pipeline is abnormal or the valve is abnormal. Some scholars point out that static alarms in a dynamic background are not easily detected by operators, which will endanger the safety of the system. McLeod et al. (1988) showed that when there are multiple moving items on the display screen, the search is limited to the moving set, and the static set is actually ignored. At the same time, some scholars believe that static objects are relatively obvious in a dynamic environment. Gibson et al. (1988) proved that a non-moving item can be found in moving items, and this is independent of the number of moving distractors. Although the search efficiency is still slightly lower than that of finding a moving target in static distractors.
In summary, current research shows that the visual form of alarm signals has a significant impact on the decision-making of operators. However, many previous experimental task designs are mostly based on performing visual search tasks in a static environment and do not fully consider the impact of dynamic backgrounds on users’ attention. Xu et al. (2022) had a similar view. In view of this, it is necessary to deeply study the impact of different visual representations of warning icons in an environment with existing dynamic elements on the visual performance of operators.
RELATED WORK
In a dynamic environment, visual search performance has been proven to be potentially affected by the movement of targets and distractors. Visual search is a behavior of finding a target from distractors through a series of eye movements. In the field of visual search research for human-machine interfaces, many studies mainly involve stimulus transparency and color (Gong et al., 2023; Vidyapu et al., 2020). These studies mostly focus on the impact of static stimuli. However, in practical applications, the objects on the HMI are moving or dynamic.
Color is an important component of the human-machine interface (HMI) (Deodhar et al., 2014). Deodhar et al. (2014) argued that HMI graphics should always have a dim background, preferably gray. However, many current configuration softwares use blue or dark colors as the background of the picture. Therefore, this study uses light gray (R242, G242, B242) and dark blue (R17, G31, B54) as the background colors of the experimental picture.
Dynamic Alarm Information Presentation Strategy Under the Influence 69
Motion and stillness are among the important factors that can affect attention. Continuous blinking without changing direction or position should minimize the apparent motion in the display to the greatest extent, thus allowing for a more rigorous test of the hypothesis that static targets can attract attention among dynamic items. Chen et al. (2023) suggested that different flicker frequencies as well as different background transparency have an effect on the performance of a visual search task. In combination with NB/T 20027 - 2010 and the existing settings in the nuclear power industry, a blinking frequency of 2Hz is used in this study to distinguish between static and dynamic alarm signals.
In Lu et al. (2012) experiments, he used two experimental scenarios, a still image and a moving video, to vary the transparency of visual cues to explore visual task performance in augmented reality environments and how this can reduce cognitive load on humans. In conjunction with Li et al. (2023), three transparency levels of 10%, 30%, and 50% were selected as experimental variables for the transparency of the signal markers in the experiment.
METHOD
In this study, a dynamic design strategy is proposed to help the operator to recognise the control that emits an alarm message as soon as possible in a dynamic context environment. The alarm signals of the controls are analysed by data comparison through behavioural experiments to obtain the most suitable combination of alarm messages for the current smart factory interface in a dynamic context.
Twenty college students (aged 22–26) from Southeast University participated in this study. None of the experimenters felt physically or visually tired; and all of them had visual acuity within the normal range (including corrected vision). Prior to conducting the experiment, they were advised to avoid consuming liquids that stimulate or numb perception, such as tea, coffee, and alcohol.
The experimental equipment used a 15.6-inch monitor to simulate the simulated experimental interface using E-prime 2.0 software. Before starting the experiment, dynamic video clips need to be created using AE software.T The experiment was conducted in a room with good lighting conditions. Combining the experimental approach of Matthew et al. (2016), we pasted two labels representing no alarm signal and alarm signal on the keyboards D and K attached to the monitor to facilitate the subjects to press the corresponding keys during the experiment.
Based on the pre-theory, the experiment was designed with three independent variables, background screen colour (RGB and RGB), dynamic/static alarm signals (differentiated by whether or not they flicker, dynamic alarm signals flicker at a frequency of 2Hz, static alarm signals do not flicker), and transparency (10%, 30%, and 50%); as well as two independent variables: accuracy rate and response time.
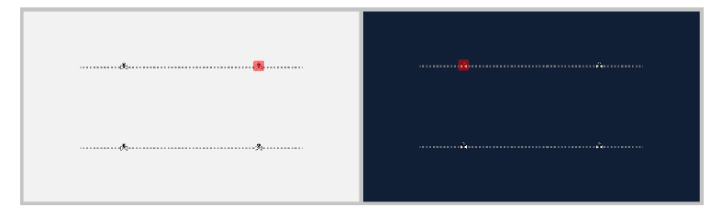
The experimental interface simulates the screen when an alarm signal appears in the monitoring interface of a smart factory, and the pipeline of the control shows a flow effect as a dynamic background, as shown in Figure 1.
Figure 1: Experimental footage with dark and light backgrounds.
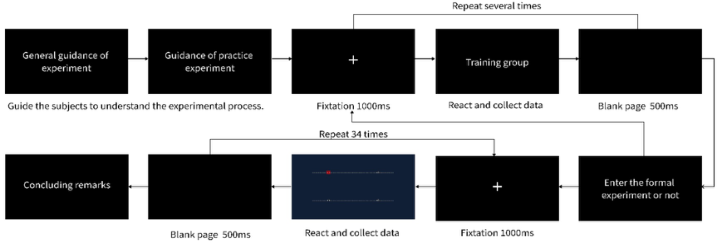
This experiment is divided into a practice experiment and a formal experiment. The practice experiment is designed to allow subjects to quickly familiarise themselves with the experimental interface in the hope that they will make quick and correct decisions in the formal experiment. At this stage, the subjects’ experimental data will not be recorded, and the experiment guide will be displayed to guide the subjects to try the exercise. Subjects need to make sure that they can distinguish whether the interface contains alarm messages or not in this stage, and when they are proficient in the experimental environment, they can start the formal experiment. The procedures for both phases were constructed by E-prime 2.0 software. The formal experimental phase consisted of 10 × (2 × 2 × 3 + 5) × 2 groups of trials (10 subjects × (2 background screen colours × 2 flashing signals × 3 transparency levels + 5 no-alarm controls) × two repetitions), for a total of 340 trials. When the experiment started, a black cross first appeared in the middle of the background plain white screen as a realisation calibration point for 1000 ms to direct the subject’s attention. Possible alarms on the experimental interface were located away from the crosses and evenly distributed around to avoid the guiding effect of the crosses. Press any key to enter the experiment. For each trial, subjects were required to watch a video of the simulated monitoring interface and press the ‘K’ key once an alarm signal appeared; if no alarm signal appeared, they were required to press the ‘D’ key. There is no time limit for subjects to respond to keystrokes, but they are required to provide feedback as quickly and accurately as possible. A blank screen was presented at the end of each trial for 500 ms. The E-prime software automatically recorded the subjects’ recognition correctness and response time for each experimental trial, and the data were processed after the experiment to calculate the average correctness and average response time for different combinations of alarm forms. The experimental flow of each stage is shown in Figure 2.
Dynamic Alarm Information Presentation Strategy Under the Influence 71
Figure 2: Experimental flow chart.
In this paper, the collected data were analysed using the repetition method, and some outliers were excluded in consideration of the degree of dispersion of the data. Table 1 shows the average accuracy, average response time, and standard deviation and standard error of accuracy for each different alarm combination in this experiment.
Table 1. Accuracy rate, reaction time, SD and SE values.
Table available in the original PDF paper.
Background picture Flicker Trans-parency ACC RT (ms) SD SE 1 Dark Color Static 0.1 0.947 974.39 0.22 0.23 2 Dark Color Static 0.3 0.842 726.5 0.36 0.37 3 Dark Color Static 0.5 1 633.65 0.00 0.00 4 Dark Color Dynamic 0.1 0.526 1167.56 0.49 0.51 5 Dark Color Dynamic 0.3 1 701.63 0.00 0.00 6 Dark Color Dynamic 0.5 1 621.44 0.00 0.00 7 Light colour Static 0.1 1 770.19 0.00 0.00 8 Light colour Static 0.3 1 639.41 0.00 0.00 9 Light colour Static 0.5 1 623.52 0.00 0.00 10 Light colour Dynamic 0.1 0.737 756.1 0.44 0.45 11 Light colour Dynamic 0.3 1 735.12 0.00 0.00 12 Light colour Dynamic 0.5 1 707.55 0.00 0.00 a (no alarm) Dark Color / / 1 1202.5 0.00 0.00 b (no alarm) Light colour / / 0.947 999.3182 0.22 0.23
RESULT AND DISCUSSION
We performed a binary logistic regression analysis on the accuracy data and the results are shown in Table 2. The results showed that the effect of transparency of warning signs on task accuracy was highly significant, B = 10.011123, Wald = 11.9109, p< 0.001. blinking showed a correlation with the effect of task accuracy, Wald = 7.1282, p = 0.006. background colour had a non-significant effect on task accuracy, B = −0.941844, Wald = 2.9342, p > 0.05. there was no interaction between transparency, blinking and background colour, Wald > 4, p > 0.05. However, there was an interaction between background colour and the presence or absence of blinking, p < 0.05. There was also no interaction between the 3 variables, B = 2.238534, Wald = 7.4121, p > 0.05.
Referring to Shen et al. (2018) previous work on analysing reaction times, all outliers were excluded from this experiment. A linear mixed- effects regression model was used to analyse the time-of-response data. The results of the analyses are presented in Table 3. Specifically, subjects’ reaction time was significantly affected when the background colour, blinking status and transparency in which the warning message was located were changed, 1AIC = −3.36, p < 0.001; 1AIC = −6.53, p < 0.001; and 1AIC = −6.52, p < 0.001.Any two of the transparency, blinking status and background colour There was an interaction effect between the variables, 1AIC = −6.53, p < 0.05; 1AIC = −6.75, p < 0.05; 1AIC = −6.53, p < 0.05.
Table 3. Results of linear mixed effects regression analysis.
In terms of task accuracy, except for Experimental Scenario 2, the experimental scenarios with 10% transparency were lower than the experimental scenarios with 30% and 50% transparency, with the lowest accuracy rate of 52.6%. The 100% correct rate was only found in the experimental scenario with light background and static information, indicating that the visual search task with low transparency is more demanding on visual conditions. The lower the transparency of the warning
Dynamic Alarm Information Presentation Strategy Under the Influence 73
information, the worse the visual search accuracy. The 1st, 2nd, 4th, and 10th experimental scenarios all had varying degrees of less than 100% correctness, indicating that the accuracy of the task with light backgrounds was higher than that of the task with dark backgrounds, which is consistent with the findings of Deodhar et al. (2014). The average accuracy of the experimental scenes with dynamic flickering was 87.7% and the average accuracy of the experimental scenes without flickering was 96.5%. This is consistent with the results of a previous study by Gibson et al. (1988).
For task response time, the experimental results showed that search reaction time performance for warning messages was best in the dark background, dynamic alarm, and 50% transparency conditions, i.e., subjects were able to process the information the fastest in this combination. However, search reaction time performance for warning messages was worst in the dark background, dynamic alarm, and 10% transparency conditions. We speculate that the reason for this discrepancy may have to do with the order in which the experimental scenes appeared and the simplicity of the task setup, and the exact reason needs to be further investigated. Taking all the scenes together, the mean response time of the dynamic flashing scene was higher than that of the non-flashing scene (727.94 ms); the mean response time of the dark background condition was 868.46 ms, and the mean response time of the light background condition was 754.77 ms. Meanwhile, the higher the transparency, the better the response time performance, which suggests that there is a positive correlation between visual search performance and the transparency of the warning message. information is positively correlated with the transparency of the warning message.
This study investigates how different background colors, the dynamic blinking of alarm messages, and varying transparencies affect an operator’s performance in handling visual tasks during unexpected events, considering that the HMI of a smart factory already contains dynamic elements. The main findings are as follows: (1) Transparency and blinking of the alert messages have a significant effect on the change of operators’ reaction time to visual search while processing hazardous information. (2) Visual search performance was positively correlated with the transparency of warning messages. (3) There was an interaction between the effects of the three visual features of background colour, dynamic state and transparency on the subjects’ reaction times. (4) Static elements have better reaction times in dynamic backgrounds relative to dynamic elements. (5) Smart factory HMI background design in light grey has better visual performance. The results of this study can provide a reference for alerting strategies for HMIs with dynamic backgrounds. A combination of a light-coloured background, a static alarm method and 50 % transparency is recommended for the design of warning signs in interfaces containing dynamic disturbing factors. In addition, the interaction between background colour, blinking frequency and transparency needs to be considered when designing the visual characteristics of warning signs. Choosing the right background colour, static realisation form and sign transparency can effectively reduce the psychological load on the user and increase the efficiency and accuracy of the operator in dealing with hazardous situations. The experimental method in the study
can provide some reference value for future interface design of dynamic smart factories, which can be used to measure the interactive performance of different operational tasks. The results of this experiment are subject to change as the monitoring interface of the real environment will be more complex and the dynamic elements and changing effects of the interface will increase accordingly.
However, the experimental task content of this study is relatively simple and lacks research on the effects of visual features on subjects in higher task load situations. In addition, there are more risks and varied display environments in real-world situations, so the operator’s mental load must be considered in the design of warning messages, such as whether attention tunnelling occurs. Future studies should simulate real main control room environments and contingencies as much as possible, so that the subjects’ mental load states are similar to those of real operators.
ACKNOWLEDGMENT
This paper is supported by National Natural Science Foundation of China (NSFC) under grant No. 72271053.
REFERENCES
Chen, C. H. and Zhai, W., 2023. The effects of dynamic prompt and background transparency of hover feedback design on the user interface of shopping websites. Asia Pacific Journal of Marketing and Logistics, 35(4), pp. 809–827. Deodhar, S., Agrawal, P. and Helekar, A., 2014. Effective use of colors in HMI
design. International Journal of Engineering Research and Applications, 4(2), pp. 384–387. Gibson, B. S. and Kelsey, E. M., 1998. Stimulus-driven attentional capture is contingent on attentional set for displaywide visual features. Journal of Experimental Psychology: Human perception and performance, 24(3), p. 699. Gong, Y., Zhang, M., Hou, G. and Zhang, S., 2023. Effect of Color Grouping on
Icon Visual Search Efficiency. Journal of Computer-Aided Design & Computer Graphics, 35(4), pp. 599–608. Hu, W., Al-Dabbagh, A. W., Chen, T. and Shah, S. L., 2018. Design of visualization plots of industrial alarm and event data for enhanced alarm management. Control Engineering Practice, 79, pp. 50–64. Lavin, E., 2014. Design of a process overview display in a Human-Machine-Interface.
CODEN: LUTEDX/TEIE-. Li, W., Qiu, T., Zhang, J. and Xue, C., 2023, October. A Visual Study of Automotive Augmented Reality Head Up Display Warning Signals. In 2023 4th International Conference on Intelligent Design (ICID) (pp. 156–161). IEEE. Lu, W., Duh, B. L. H. and Feiner, S., 2012, November. Subtle cueing for visual
search in augmented reality. In 2012 IEEE International Symposium on Mixed and Augmented Reality (ISMAR) (pp. 161–166). IEEE. McLeod, P., Driver, J. and Crisp, J., 1988. Visual search for a conjunction of movement and form is parallel. Nature, 332(6160), pp. 154–155. Niu, Y. F., Li, B., Zhang, X. Y., Qiu, L. C., Shi, B. Z., Xue, C. Q., Xiao, W. Y.,
Zhang, Y. T. and Li, Z. Q., 2018, November. Performance Evaluation of Alarm Forms under Different Visual Coding on the Digital Interface. In IOP Conference Series: Materials Science and Engineering (Vol. 439, No. 3, p. 032003). IOP Publishing.
Dynamic Alarm Information Presentation Strategy Under the Influence 75
Shen, Z., Popov, V., Delahay, A. B. and Reder, L. M., 2018. Item strength affects working memory capacity. Memory & Cognition, 46, pp. 204–215. Vidyapu, S., Vedula, V. S. and Bhattacharya, S., 2020. Investigating and modeling
the web elements’ visual feature influence on free-viewing attention. ACM Transactions on the Web (TWEB), 15(1), pp. 1–27. Xu, B., Li, Z., Wu, Z. and Ai, X., 2022, October. A Visual Study of In-vehicle Humanmachine Interaction Interface. In 2022 3rd International Conference on Intelligent Design (ICID) (pp. 65–70). IEEE.
LISTED IN THE AHFE DIGITAL BOOKSTORE CATALOGUE
Explore the complete digital volume
Intelligent Human Systems Integration (IHSI 2025): Integrating People and Intelligent Systems
Read this individual research paper free through the original publisher, or explore the full digital proceedings book.
ISBN 978-1-964867-36-6
Explore this ISBN in the AHFE Bookstore ↗Listed in the July 2026 bookstore catalogue; search by ISBN to confirm current availability · Digital book purchase optional