Simin Peng, Yuxuan Yang, Chengqi Xue (2025). User Preferences for Information Feedback Design of a Multi-Person Collaborative System Interface for Emergency Rescue Tasks. In: Usability and User Experience. AHFE Open Access, vol. 194, pp. 276–283. https://doi.org/10.54941/ahfe1006690
In recent years, societal factors and technological advancements have significantly accelerated the development of multi-user collaborative applications, reducing geographical constraints and enabling cross-functional cooperation. For instance, large-scale natural disasters often require systematic, multi-party collaborative command systems to support disaster response operations. In the context of earthquake emergency rescue, effective collaboration involves the coordination of various stakeholders, including surveyors, medical personnel, communication staff, rescuers, command officers, and logistics coordinators. These efforts often rely on large-screen interfaces that display vast amounts of data from multiple users. However, the simultaneous presentation of information from diverse sources can impose significant cognitive and response burdens on users. Optimizing the design and presentation of information feedback is therefore critical to ensure that users can efficiently access and accurately perceive collaborative information. Only when feedback effectively captures user attention and facilitates comprehension can it enhance operational efficiency and user experience.Despite its importance, limited research has been conducted on the design of information feedback in multi-user collaborative interfaces, particularly studies focusing on user preferences or the impact of randomness in information appearance. This study aims to address this gap by investigating user preferences for various feedback presentation methods in the context of earthquake emergency command halls, specifically within complex information systems. The research also considers the influence of random information occurrence. Ultimately, the study identifies user preferences for representative feedback methods, collects subjective evaluations from participants, and confirms consistency between subjective assessments and observed preference distributions.Method:The study consisted of two phases involving 16 participants. Tobii eye-tracking technology was employed to collect eye movement data as a measure of user performance and preferences. Following a preliminary investigation, three representative information feedback methods were designed: corner marker, pop-up, and flashing landmark feedback. The corner marker design adopted a commonly used industry-standard notification icon style.In the first phase, user preferences for the three feedback methods were assessed under conditions of single and random multiple presentations. A visual search task was employed to record eye-tracking metrics, such as fixation data, and user responses. The second phase involved a five-point Likert scale questionnaire to gather subjective evaluations of the user experience with each feedback method after completing the tests.Results:The results indicated that, in complex large-screen collaborative interfaces, participants allocated more attention to pop-up and flashing feedback compared to corner marker feedback. However, among the three methods, corner marker feedback elicited quicker and more focused visual attention from users. Subjective user experience ratings collected via the Likert scale were consistent with eye-tracking data, further validating the advantages of corner marker feedback.Conclusion:This study underscores the effectiveness of corner marker feedback in enhancing user efficiency and experience within earthquake emergency command scenarios. By combining objective eye-tracking data with subjective evaluations, the findings provide a comprehensive understanding of user preferences for information feedback methods. These insights offer valuable guidance for optimizing the design of information feedback systems in complex, high-pressure collaborative environments, particularly those used in emergency response operations.
In recent years, with the acceleration of urbanization and the increase in disaster complexity, emergency response tasks have gradually shown the need for multi-subject and multi-scenario collaboration (Mendonça et al., 2020; Yu et al., 2023). Whether it is a fire in an urban tunnel, a marine accident, or an emergency in subway operation, efficient multi-department collaboration and information integration capabilities have become the core of improving emergency response efficiency (Wu et al., 2014; Jiang et al., 2020). Studies have shown that multi-person collaborative tasks involve a large amount of dynamic information (such as real-time location, resource status, environmental risks, etc.), and technical means are needed to achieve efficient integration and visualization of information (Li et al., 2014; Wong et al., 2022). However, existing research focuses on the development and function implementation of technical tools, and pays less attention to user interface design and information feedback preferences. Taking earthquake emergency rescue as an example, its task complexity is high and the information density is high, involving multi-link collaboration such as disaster assessment, path planning, and resource scheduling. Rescuers need to quickly obtain key
User Preferences for Information Feedback Design of a Multi-Person Collaborative System 277
information (such as the safety status of building structures, the location of trapped people, aftershock risks, etc.) under high-pressure environments, but existing systems often lack adaptation to users’ cognitive load and operating habits (Zhou et al., 2022). For example, although the fire emergency navigation system can simplify operations through voice interaction (Wong et al., 2022), whether the presentation of interface information (such as map levels and alarm prompt forms) meets user needs has not been fully verified; similarly, although the marine accident simulation system supports multi- person collaborative decision-making (Wu et al., 2014), it does not deeply explore the differences in information priorities between different roles (such as commanders and on-site personnel).
This problem is particularly prominent in earthquake emergency rescue. Earthquake scenes are characterized by strong suddenness and wide range of damage. Rescuers need to quickly integrate multi-source information (such as remote sensing images, sensor data, and on-site reports) in an environment with limited communication and fragmented data. However, existing systems are mostly based on static plan design, lack dynamic adjustment capabilities, and interface information overload or key information missing are common (Zhang et al., 2021). Studies have shown that the efficiency of rescuers’ perception of interface information directly affects the quality of decision- making (Nunavath & Prinz, 2016). For example, excessive symbol density in map visualization may lead to path misjudgment, and inappropriate frequency of voice prompts may interfere with on-site operations (Wong et al., 2022). Although some studies have attempted to optimize interaction design (such as gesture control and multimodal feedback) through user testing, their conclusions are mostly limited to specific scenarios (such as tunnels or indoor fires) and are difficult to directly transfer to more complex emergency scenarios such as earthquakes (Jiang et al., 2020; Yu et al., 2023).
In summary, current research has made significant progress in information integration technology for multi-person collaborative emergency tasks, but there is still a gap in empirical analysis of user interface information feedback preferences. Earthquake emergency rescue, as a typical high-complexity collaborative task, urgently needs to combine user behavior data with cognitive psychology theory to explore information presentation strategies that adapt to the needs of different roles, so as to optimize the user experience in such tasks.
MATERIAL AND METHODS In the design of multi-person collaborative interfaces, eye movement experiments can accurately capture the user’s attention distribution and interaction intention (such as gaze speed, duration of stay in the focus area), reveal information processing priority and cognitive load (such as the impact of function button layout on efficiency) (David et al., 2021; Cybulski et al., 2020). Eye movement data can quantitatively analyze visual focus conflicts, differences in operating habits, and information overload pain points in multi-user collaborative scenarios, and provide empirical evidence for designing collaborative interfaces that conform to group cognitive logic,
278 Peng and Yang
thereby reducing interaction friction and improving collaborative efficiency (such as preloading instructions through gaze prediction, or customizing information density by role). Therefore, this study used the Tobii X30 eye tracker as an experimental instrument and invited 16 subjects, including 8 males and 8 females, aged between 22 and 30 years old, all of whom were graduate students. All subjects had normal vision or normal vision after correction, and no color blindness or color weakness. Before the experiment, the subjects were informed of relevant matters and signed a consent form. After approval by the review committee, all subjects voluntarily participated in the experiment.
Experimental Procedure This experiment is an eye tracking experiment. Before the formal experiment begins, the subjects need to calibrate the equipment, provide the subjects with corresponding experimental operation exercises, and reserve time for the subjects to familiarize themselves with the operation and experimental environment, while ensuring that they effectively accept the experimental requirements. During the experiment, feedback information appears randomly. The subjects should observe carefully and do their best to complete the task. In the interval between the completion of each set of tasks and the start of the next set of tasks, the subjects are allowed to fully rest freely to avoid experimental errors caused by fatigue. At the same time, the subjects can also convey their operating experience to the main experimenter at any time. At the beginning of each task, the eye tracking device begins to record the subject’s observation data. After each round of experiments, the subjects need to fill in the subjective evaluation scale for this type of presentation method.
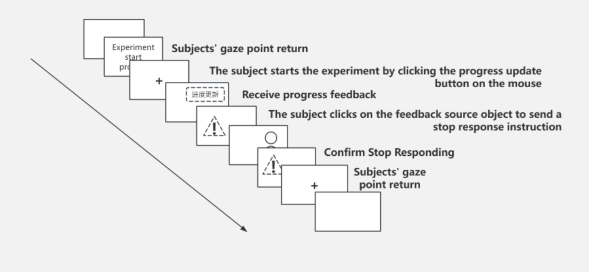
Task 1: Single Feedback Response In this task, the subjects only need to process single and multiple feedbacks, that is, the second feedback message will appear only after one feedback is completely processed. The subjects need to observe and process all feedback information. The task flow chart is shown in Figure 1:
Figure 1: Single feedback response flowchart.
User Preferences for Information Feedback Design of a Multi-Person Collaborative System 279
After this round of testing, the subjects took a full rest and filled in the subjective evaluation scale.
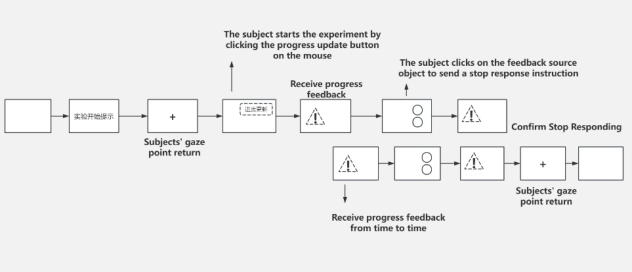
Task 2: Multiple Feedback Response In this task, the subjects need to deal with multiple and multiple feedbacks, that is, feedback information will appear from time to time during the experiment, and there will be overlapping feedback. The subjects need to observe and process all feedback information. The task flow chart is shown in Figure 2:
Figure 2: Multiple feedback response flowchart.
In this experiment, the feedback presentation form of the control group is set as text feedback in the text box, and the feedback presentation forms of the three experimental groups are as follows: Feedback form 1: text + icon flashing, when information from a certain user appears, the icon representing the corresponding user on the map in the interface will flash;
Feedback form 2: text + corner mark, when information from a certain user appears, a message corner mark will appear on the corresponding user’s avatar in the interface; Feedback form 3: text + pop-up window, when information from a certain user appears, a message reminder pop-up window will appear in front of the corresponding user in the interface.
The subjects need to observe the complete information feedback process in the interface and complete the target task, and fill in the user experience questionnaire for the interactive experience under the three different feedback presentation forms, conduct a comprehensive review of the three types of interface solutions, and score them respectively.
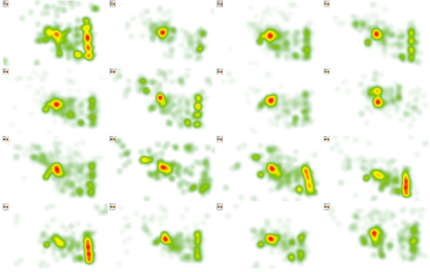
DATA COLLECTION AND RESULTS DISCUSSION The experiment uses the user’s gaze duration as a research indicator, and obtains a total of 16 sets of valid data. The eye heat map formed during the user task stage is shown in Figure 3.
280 Peng and Yang
Figure 3: Sample eye heat map.
First, we analyzed the task efficiency under the three types of feedback interfaces. Since the total number of data samples was less than 2000, we used SPSS software to conduct a Shapiro-Wilk (S-W) normal distribution test on the gaze duration of all subjects completing the three tasks. Group 1, Group 2, and Group 3 corresponded to feedback form 1, feedback form 2, and feedback form 3, respectively. The results are shown in Table 1. The p values of all groups were > 0.05 (Group 1: 0.073, Group 2: 0.114, Group 3: 0.139), indicating that the data in each group conformed to the normal distribution.
Therefore, we further analyzed and used gaze duration as a negative indicator of operation efficiency, that is, the shorter the gaze duration, the higher the operation efficiency. An independent sample t test was performed on the three groups of experimental data to explore the significance of the differences between the groups. The results are shown in Tables 2 and 3.
Descriptive statistics show that the average gaze duration of Group 2 (1.4453 ± 1.06443) is significantly lower than that of Group 1 (1.8500 ± 1.34232), indicating that Group 2 has higher operation efficiency, and Group 3 has the highest average gaze duration (2.1324 ± 1.27538), indicating that its operation efficiency is the lowest. The independent sample t test further verified that there was no significant difference between Group 1 and Group 2 (t = 0.974, p = 0.337), but the numerical characteristics of Group 2 were better; the difference between Group 2 and Group 3 was close to the significant edge (t=–1.705, p = 0.098). Combined with descriptive statistics, it can be inferred that the efficiency of Group 2 is significantly better than that of Group 3. Under the assumption that gaze duration is a negative indicator of efficiency, Group 2 performs best because it has
User Preferences for Information Feedback Design of a Multi-Person Collaborative System 281
the lowest gaze duration and high data stability; while Group 3 has the worst efficiency due to its long gaze duration and high volatility. Future research needs to further verify the causal relationship between gaze duration and efficiency in combination with task complexity.
Table 2: Statistics.
Table available in the original PDF paper.
Group Mean Standard
Mean Standard Error
Value Deviation
1 1.8500 1.34232 0.32556 2 1.4453 1.06443 0.25816
Table 3: Variance equality test of vegetable.
Table available in the original PDF paper.
Group Mean Standard
Mean Standard Error
Value Deviation
2 1.4453 1.06443 0.25816 3 2.1324 1.27538 0.30933
After completing each task using a feedback scheme interface, the subjects were required to fill in a questionnaire based on their subjective experience during the task. In the end, all 16 scales were filled in and collected. The internal consistency of the questionnaire was evaluated using the Cronbach α coefficient to measure the reliability of the questionnaire. From the results in Table 4, the standardized Cronbach α coefficient of the questionnaire was 0.833, indicating that the overall reliability was high, exceeding the good reliability standard of 0.8, and had strong internal consistency. From the perspective of the corrected total correlation (CITC), the CITC values of all items were higher than 0.3, indicating that each measurement item had a good correlation with the total scale.
This study conducted subjective user ratings on three different feedback forms to evaluate their user acceptance in terms of information presentation, information acquisition, emotional experience, operational convenience, and interface recognition. By comparing the average ratings of different feedback forms in each dimension, the impact of different feedback designs on user experience can be analyzed.
From the rating data, feedback form 2 (text + superscript) received the highest ratings in all dimensions (M = 4.19 ∼3.88), indicating that it is the most recognized in terms of visual performance, information transmission, and user interaction experience. Among them, “like this type of feedback presentation” received the highest rating (M = 4.19), indicating that users have a high degree of acceptance of its visual design. Feedback form 1 (text + icon flashing) received the lowest ratings in all dimensions (M = 3.06 ∼2.94), especially in “interface recognition” (M = 2.94), reflecting that this feedback may have significant deficiencies in information clarity and readability. In addition, its visual preference rating (M = 3.06) was significantly lower than that of the other two feedbacks, indicating that
282 Peng and Yang
this feedback form may not meet users’ aesthetic expectations. The user ratings of feedback form 3 (text + pop-up window) are generally in the middle (M = 3.81 ∼3.48), and the performance in “degree of satisfaction of information acquisition needs” and “convenience of operation” is relatively good (both M = 3.81 and M = 3.75), but the score in “interface recognition” is still lower than 3.5 (M = 3.48), indicating that there is still room for improvement in its information presentation.
Feedback Form 2 demonstrates concentrated ratings with low standard deviation, reflecting high consistency and stability in user experience. Feedback Form 1 shows significant variability, particularly in “interface recognition,” suggesting individual differences influenced by preferences or task contexts. Feedback Form 3 has moderate fluctuations, slightly lower mean than Form 2, but good consistency in key dimensions. Based on subjective experience, Form 2 is most recommended.
Table 4: Cronbach’s reliability analysis.
Table available in the original PDF paper.
Name CITC Cronbach’s Cronbach’s Alpha Alpha if Item Deleted
I can understand the information status conveyed by this type of feedback 0.529 0.810 0.825 I can understand my operation (response feedback) 0.359 0.828 I feel that the difficulty of using this system is not high 0.479 0.814 I can understand the current status of other users 0.485 0.813 I believe I can interact smoothly with the interface 0.579 0.801 This feedback method can prevent information processing confusion 0.754 0.781 Information is clear at a glance, and I can quickly obtain the necessary information 0.511 0.811 I can efficiently complete information response operations 0.784 0.775 Note: Standardized Cronbach’s Alpha = 0.833.
CONCLUSION
The user experience questionnaire data from this study are highly consistent with the eye-tracking experimental data, indicating that the corner design is more popular among users in multi-person emergency collaboration tasks. The results not only support the influence of feedback design on user experience and operational efficiency, but also further demonstrate the effectiveness of eye-tracking as a user experience assessment method. It reveals the intrinsic association between cognitive load and interface guidance mechanism during human-computer interaction, and provides an evidence-based optimization path for emergency interface design.
Future research can deepen the exploration from three dimensions: first, expanding the diversity of emergency response contexts, carrying out contextualized validation for different disaster types (e.g., fires, medical emergencies, and cybersecurity events), task complexity (multilevel task nesting, dynamic prioritization adjustments), and team sizes (cross- professional collaboration, and distributed command), and examining the universality of the cornerstone design under different decision- making pressures and information densities; second. Constructing a multimodal assessment system, integrating physiological signal monitoring
User Preferences for Information Feedback Design of a Multi-Person Collaborative System 283
(e.g., galvanic response, heart rate variability) and collaborative process analysis (communication efficiency, role transition mode) on the basis of the existing eye movement indicators, and establishing a quantitative impact model of the feedback design on the team’s cognitive synchronization; Thirdly, reinforcing the study of eco-efficacy by simulating the real emergency response environment through virtual reality, which is characterized by multiple sources of interference (noise, illumination variations, and equipment limitations) and time pressure, and exploring the complexity of the situation. Thirdly, we strengthen the ecological validity research, through virtual reality simulation of real emergency environment with multi- source interference (noise, lighting changes, equipment limitations) and time pressure, to explore the adaptive law of the user attention resource allocation mechanism and interface guidance strategy in the complex situation, so as to promote the transformation of theoretical research to actual combat application.
REFERENCES
Cybulski, P., & Horbin’ski, T. (2020). User experience in using graphical user interfaces of web maps. ISPRS International Journal of Geo-Information, 9(7), 412. David-John, B., Peacock, C. E., Zhang, T., Murdison, T. S., Benko, H., & Jonker, T.
R. (2021). Towards gaze-based prediction of the intent to interact in virtual reality. In ETRA ‘21: 2021 Symposium on Eye Tracking Research and Applications (pp. 1–7). ACM. Jiang, T., Qiu, Y., & Li, F. (2020). A multi-person collaborative simulation system for subway emergency based on virtual reality. IOP Conference Series: Materials Science and Engineering, 750(1), 012227. Li, N., Yang, Z., Ghahramani, A., Becerik-Gerber, B., & Soibelman, L. (2014). Situational awareness for supporting building fire emergency response: Information needs, information sources, and implementation requirements. Fire Safety Journal, 63, 17–28. Mendonça, D., Cutler, B., Wallace, W. A., & Brooks, J. D. (2020). Collaborative
training tools for emergency restoration of critical infrastructure systems. Procedia Engineering, 572, 1–11. Nunavath, V., & Prinz, A. (2016). Taking the advantage of smartphone apps for understanding information needs of emergency response teams’ for situational awareness: Evidence from an indoor fire game. International Conference on Human-Computer Interaction, 563–571. Wong, M. O., Zhou, H., Ying, H., & Lee, S. (2022). A voice-driven IMU-enabled BIM-based multi-user system for indoor navigation in fire emergencies. Automation in Construction, 136, 104137. Wu, B., Yan, X., Wang, Y., & Wei, X. (2014). Maritime emergency simulation system
(MESS): A virtual decision support platform for emergency response of maritime accidents. Proceedings of the 4th International Conference on Simulation and Modeling Methodologies, Technologies and Applications, 155–162. Yu, G., Shi, L., Wang, Y., Xiong, J., & Jin, Y. (2023). A collaborative emergency drill system for urban tunnels using BIM and an agent-based model. Sustainability, 15(18), 13533. Zhou, H., Wong, M. O., Ying, H., & Lee, S. (2022). A framework of a multi-user
voice-driven BIM-based navigation system for fire emergency response. CEUR Workshop Proceedings, 2394, 1–10.
LISTED IN THE AHFE DIGITAL BOOKSTORE CATALOGUE
Explore the complete digital volume
Usability and User Experience
Read this individual research paper free through the original publisher, or explore the full digital proceedings book.
ISBN 978-1-964867-70-0
Explore this ISBN in the AHFE Bookstore ↗Listed in the July 2026 bookstore catalogue; search by ISBN to confirm current availability · Digital book purchase optional