Caini Liu, ChengQi Xue (2023). Aesthetic Computational Model and Experimental Research Based on Seeking the Particle of Image Elements. In: Intelligent Human Systems Integration (IHSI 2023): Integrating People and Intelligent Systems. AHFE Open Access, vol. 69, pp. 583–590. https://doi.org/10.54941/ahfe1002880
As an important part of interface design, interface layout has attracted more attention. Previous researchers used mathematical methods to explore the relationship between interface layout and user aesthetics in order to quantify users' subjective feelings. However, the current computational aesthetic quantification algorithms generalize the interface elements into rectangular boxes for unified treatment by default. In the interface layout, graphic elements with different shapes will bring users different levels of aesthetic attraction. Therefore, simply "dividing" the interface elements into a series of rectangular blocks for attraction evaluation will affect the objectivity of the results. This paper proposes a computational model based on seeking the particle of image pixels and makes a multivariate linear analysis between the subjective score and the calculated values under the two computational models to explore whether the improved evaluation method is more in line with people's perceptual aesthetics. The calculation method of balance (BM) is taken as an example to verify. In the experiment, six test images are selected, and the number of image pixels and the centroid of pixels are counted with the help of Matlab and other software, which verifies the accuracy and objectivity of the new calculation method to measure the aesthetic layout of interface elements. The results show that the fitting effect between the data obtained by the beauty calculation model based on pixel particles and subjective ratings is better, which is more in line with the user's subjective preferences. Aesthetic calculation is the design trend in the future.
Visual aesthetics is becoming more and more important in interface design and product design. Interface design will affect users’ sensory experience and work performance. Although the exact mechanism of how design aesthetics affects system usability is not completely clear, the importance of aesthetics in human-computer interface design has been clearly proved and has attracted more and more attention.
In the review of aesthetic standards, different computational models are proposed to quantify the aesthetic appeal of interface design elements. Ngo et al. (2002) proposed 13 aesthetic image indicators to objectively measure the relationship between interface design elements and users’ visual perce- ption. At the same time, they verified the effectiveness of these indicators
in measuring interface aesthetics. However, there are too many indicators, which is inconvenient to calculate. Then, the evaluation theory of interface aesthetics was constructed on the basis of 14 aesthetics indicators (Ngo et al., 2003). The experimental results show that the evaluation formula is effective in the aesthetic evaluation of digital screen design. At the same time, the paper pointed out that the research needs to be further improved. For exam- ple, large elements will be more visually heavier than small elements. Tsai et al. (2013) proposed a calculation model to calculate the perceived aesthe- tic attraction of text covered images. The research shows that it is valuable in modeling subjective attraction based on the area ratio between text bounding box and image background area. Ren and Xue (2018) refined six beauty indi- cators on the basis of predecessors: balance, symmetry, integrity, simplicity, density and cohesion to evaluate the layout of interface elements, quantified the weight of different indicators by analytic hierarchy process, and finally obtained the comprehensive beauty calculation formula of interface element layout. However, when dividing the interface elements in the current calcula- tion model, the design elements are unified into rectangular boxes by default (see Figure 1). In the interface layout, graphic elements with different sha- pes will bring users different levels of aesthetic attraction. Therefore, simply planning the elements of the interface into a series of rectangular blocks for beauty calculation will affect the objectivity and accuracy of the calculation results.
The visual element type discussed in this paper is irregular graphics. Many photos or images are usually composed of irregular image elements. Irregular images refer to those figures whose boundary lines are messy and cannot be defined and named. Different from the layout of traditional software inter- face and product interface, the centroid of irregular image is usually not located in the center of its bounding box. Therefore, it is unreasonable to use the existing calculation model to calculate the beauty of the image con- taining irregular graphic elements. If the calculation model can automatically extract the irregular visual elements in the image and count their pixel points and centroid coordinates, the improvement of aesthetic evaluation is of cer- tain value, which can assist the computer system to better simulate the user’s perceptual evaluation and layout.
In the following chapters, firstly, we briefly introduce the original compu- tational model of counting design elements into rectangular blocks and the improved model based on seeking the particle of the irregular graphic. Then
Aesthetic Computational Model and Experimental Research 585
the subjective evaluation method is used to obtain the user’s perceptual score of the experimental materials. Then the balance degree in aesthetic indicators is used to further verify the constructed calculation method. In order to avoid the influence of color, hue, and other factors, the types of visual elements in the images used are unified, and the experimental images are transformed on a reference image. The research results and discussion will be given at the end.
COMPUTATIONAL MODEL Photography and architecture often pay attention to the beauty of balance. The degree of balance (BM) has a significant impact on the page layout (Lai, 2010). The balanced page layout gives people the beauty of solemnity, atmosphere and harmony. Therefore, this experiment focuses on the beauty optimization calculation and test of BM to assist the balanced composition of the picture.
Computational Model of Balance Degree Balance (BM) refers to the visual stability of the distribution of elements in a picture. It is generally believed that area and color are important factors affecting visual weight. The balance in interface design is to provide almost weight interface elements on both sides of the vertical axis or horizontal axis.
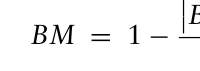
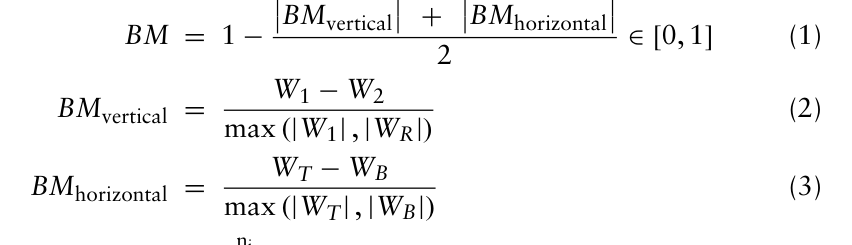
BMvertical
+
BMhorizontal
Equation reproduced from the original PDF.Equation reproduced from the original PDF.
i
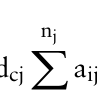
BMvertical is the degree of symmetry of the image on the vertical axis of symmetry, BMhorizontal is the symmetrical value of the image on the horizontal axis. L, R are the left and right area of the interface bounded by the vertical axis. T, B are the upper and lower region bounded by the horizontal axis. aij is the area of object i on side j. dij is the distance between the center line of the object and the axis frame. nij is the total number of design elements on side j.
Computational Model Based on Seeking the Particle of Image Elements Since the object of this study is irregular visual elements, in the original for- mula, aij (rectangular block area) and dij (distance between rectangular frame and symmetry axis) should be modified. The meaning of aij is changed to the sum of all pixel areas, and dij is the distance between the centroid of j-side
586 Liu and Xue
Figure 2: Reference image.
Figure available in the original PDF paper.
elements and axis frame. Define the centroid coordinates of the elements on side j as (xc,yc), and the page size is (W, H), where W is the page width and H is the page height.
Equation reproduced from the original PDF.
dcj = W/2 −xc j = L, R, T, B (6) After the improvement, the image can be retrieved directly based on pixels with Matlab, and there is no need to process the image with Photoshop. After the background is removed, the number of pixels is directly counted based on the four quadrants, and the pixel area is equivalent to the number of pixels. The pixels in the area covered with design elements are assigned values, and then the centroid position is judged to obtain the number of rows and columns where the centroid pixels are located, to obtain the centroid coordinates. In the next section, experimental verification will be carried out to test whether the improved computing model is more in line with users’ perceptual cognition.
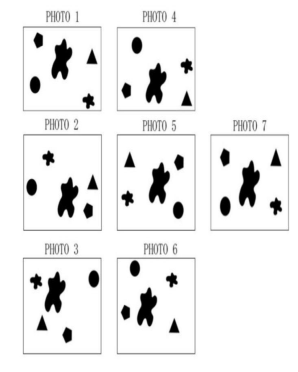
EXPERIMENTAL DESIGN In this section, we select six test images (see Figure 3) and one reference image (see Figure 2) and show them to the participants. Each photo is made by Pho- toshop, and the visual symmetry of the reference image is good (the BM value calculated by the previous computational model is 0.8848). The other six test images are generated by changing the position of image elements based on the reference image, excluding the influence of color and other image details on the test. Using the subjective evaluation method, the participants of the experiment were invited to score each picture based on the picture symmetry, so as to obtain a group of subjective scores on the six test pictures.
Then use Matlab to obtain the total area and centroid coordinates of visual elements, and then obtain a new set of BM values (see Table 1) through the calculation formulas (5) and (6). The obtained subjective score data are basi- cally fitted with the two groups of BM values respectively. Here, the basic fitting tool in Matlab is used to determine whether the improved evaluation model has better fitting effect and is more suitable for practice.
Experimental Subjects Fifteen subjects, aged from 18 to 26, were randomly selected, including 12 females and 8 males. Among the 20 subjects, 10 were from design educa- tion background and 5 had no design education background, so as to ensure
Aesthetic Computational Model and Experimental Research 587
Figure 3: Experimental test image.Table 1. Comparision of BM values under two calculation.
Table available in the original PDF paper.
the objectivity of the subjects’ evaluation of picture balance. All participants had normal vision or corrected to normal, and normal color vision.
Experimental Stimulate In this experiment, six test images are selected, each of which contains an element with strong visual attraction. They are generated by transforming the element position of a reference image containing five elements, as shown in Fig. 3. Although the page elements are the same, the change of element position can be perceived. In order to facilitate the experimental verification, the basic graphic elements are selected to replace the real image.
Experimental Procedure The experiment was conducted in an environment with sufficient light and no noise interference. Use image playback software to display customized benchmark images and other test charts. First, the subjects were invited to be familiar with the reference image without time limitation; Then, score the balance of other images according to the reference image (1 to 7 points), and record the score. The display parameters used in the experiment are 15.6-inch
588 Liu and Xue
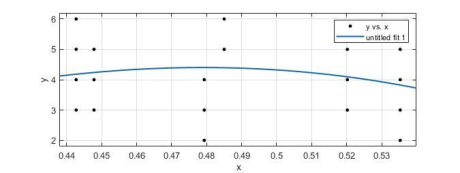
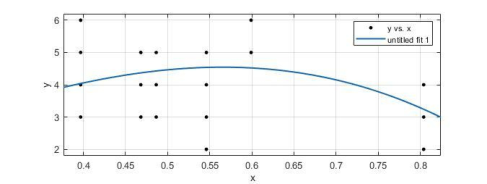
Figure 4: Regression curve of aesthetic evaluation based on original calculation model.Figure 5: Regression curve of aesthetic evaluation based on the calculation model of seeking element particle.
LCD with a resolution of 1920x1080 pixels. During the test, all test images and reference images are displayed horizontally in separate screens. The tester is required to make a quick judgment based on the balanced layout of the test chart, so as to avoid other details of the image affecting the subject’s judgment.
The score of the reference image is defined as 7 points. The subjects are required to evaluate the aesthetic attraction of the randomly played test image according to the given reference image. After scoring a test chart, the subjects need to browse the reference chart again to avoid the front and back inter- ference between the test images. The higher the score of the test image, the better the visual aesthetic attraction of the image.
Comparision of Experimental Results of Computational Models We conduct multiple linear analysis between the subjective score and the results of the two evaluation models to explore whether the improved calcu- lation method is more in line with people’s perceptual aesthetics. The focus of this research is to compare the two aesthetic evaluation methods with the user’s subjective preference, so the number of multiple linear regression equation has no effect on the experimental results. For the convenience of calculation, the quadratic regression equation is selected this time. Figure 4 and 5 show the subjective evaluation values under the two computational models. In the figure, the y-axis represents the score of subjective score, and the x-axis represents the aesthetic attraction calculated by the two models. Firstly, the original model is fitted with polynomial data to obtain the equation y = 165x−172.6x2−35.02, and the value of R2 is 0.03599. Then, the improved computational model is analyzed and the equation is
Aesthetic Computational Model and Experimental Research 589 obtained, y = 21.77x−19.74x2−1.481, and the value of R2 is 0.217. Com- paring the value of R2, the model with larger R2 value has better fitting effect, which means that the evaluation model is more effective. Although the R2 values of the two computational models are lower, we can observe that the R2 value of the calculation model based on seeking the particle of image elements is significantly higher than that of the original model, which indicates that the improved calculation method has better fitting effect and can better reflect the user’s aesthetic perception of interface element layout.
DISCUSSION
Because the balance (BM) occupies a considerable proportion in the subje- ctive aesthetic evaluation of images, the BM value is mainly selected in this experiment to test the calculation model methods, and the differences betw- een aesthetic calculation methods are shown through BM. In the process of testing the test results, the advantage of the improved model is more in line with people’s aesthetic preferences than the original model, but the two fit- ting results are not very good, the value of R2 is lower than 0.4, there are many reasons for this situation. For example, other page evaluation indica- tors, such as simplicity, integrity, and complexity, are not considered in this experiment, and the number of samples is very limited.
In the future research, we should introduce real images in reality for further experimental verification to explore whether this research method has a significant impact on complex real images. To explore whether there is a difference between the complex real images and the simple abstract graphics.
CONCLUSION
On the basis of previous research work, this study partially modifies and supplements the aesthetic evaluation formula, and constructs a computa- tional method based on seeking the particle of image elements; Then the subjective scores of the subjects were obtained through multiple test ima- ges and subjective evaluation; Finally, taking BM as an example, the data of the two groups of evaluation models and the user’s subjective evaluation scores are fitted by multiple linear fitting. The experimental results show that the new aesthetic calculation concept is more in line with the user’s preference to a certain extent, which is helpful to improve the potential of the original aesthetic computational model. In the future, the method of aesthetic calculation may be combined with computer technology, color recognition, and other technologies to better assist the layout of page ele- ments and scientifically guide the improvement of page layout. However, there are still many deficiencies in this study. For example, in more com- plex scenes, whether the aesthetic evaluation method based on seeking the particle of image elements is still effective needs further research in the future.
590 Liu and Xue
REFERENCES
Lai, CY, Chen, PH, Shih, SW & Liu, YL, Hong, JS 2010, ‘Computational models and experimental investigations of effects of balance and symmetry on the aesthetics of text-overlaid images’, International Journal of Human-Computer Studies, vol. 68, no. 1-2, pp. 41–56. Ngo, DCL, Teo, LS & Byrne, JG 2002, ‘Evaluating Interface Esthetics’, Knowledge
& Information Systems, vol. 4, no. 1, pp. 46–79. Ngo, DCL, Teo LS & Byrne, JG 2003, ‘Modelling interface aesthetics’, Information Sciences, vol. 152, pp. 25–46. Ren, XF & Xue, CQ 2018, ‘Evaluation of camera connect app interface element
layout based on Aesthetic calculation’, Design, vol. 4, pp. 142–143. Tsai, MT, Wang, KA, Liu, YL & Hong, JS 2013, ‘Perceived Visual Aesthetics of Text- Overlaid Images: Computational Models and Experimental Research for White- Space Fraction’, International Journal of Human-Computer Interaction, vol. 30, no. 1, pp. 1–23.
LISTED IN THE AHFE DIGITAL BOOKSTORE CATALOGUE
Explore the complete digital volume
Intelligent Human Systems Integration (IHSI 2023): Integrating People and Intelligent Systems
Read this individual research paper free through the original publisher, or explore the full digital proceedings book.
ISBN 978-1-958651-45-2
Explore this ISBN in the AHFE Bookstore ↗Listed in the July 2026 bookstore catalogue; search by ISBN to confirm current availability · Digital book purchase optional