Vitor Pais, Álvaro M. Sampaio, Nelson Costa, António J. Pontes (2024). The Impact of Resolution and Material Selection on a Prototype Assessment. In: Human Factors in Design, Engineering, and Computing. AHFE Open Access, vol. 159, pp. 897–905. https://doi.org/10.54941/ahfe1005656
Prototypes are a well-established artefacts that are used to express and validate ideas and concepts in the product design and development process, enabling team members, stakeholders, or final users to provide feedback (Gero, 1990). Despite the usefulness of prototypes in facilitating the development process, challenges associated with their usage have emerged over time. Prototypes can be developed in a variety of ways, ranging from low-fidelity paper prototypes, commonly used in software development, to high-fidelity pre- production prototypes that closely resemble the final product (Pei et al., 2010, 2011). Nevertheless, a consensus regarding the classification of these artifacts remains uncertain due to divergent perspectives presented by various authors, e.g. Coughlan et al. (2007), Jensen et al. (2016) and Pei et al. (2011). Regardless, there are an agreement that the differences in complexity among those are referred to as fidelity or resolution, and the major issue is to determinate timing, methodology and context to apply them in the design process. The resolution of prototypes pertains to the level of information conveyed by each artifact and its clarity in communicating its intended function. Scholars such as Jensen et al. (2016) and Lim et al. (2008) emphasize the importance of aligning prototype resolution with its intended purpose. Conversely, Pei et al. (2011) offer a detailed taxonomy categorizing prototypes based on predefined characteristics. Several researchers, including Catani & Biers (1998), Sauer et al. (2008), and Wiklund et al. (1992), have compared prototypes of varying fidelity and concluded that lower fidelity prototypes can yield comparable results to high-fidelity ones. However, recent studies by Deininger et al. (2017) and Jensen et al. (2018) have focused on how resolution influences user satisfaction, finding a preference for higher-fidelity prototypes that are easier to understand. Nevertheless, none of these studies have directly examined the relationship between prototype resolution and user performance. This study aims to investigate the impact of prototype resolution on performance assessment using six prototypes. Thirty-three participants were involved, divided into six groups, with ages ranging from 18 to 58 years (mean = 23.7 years; SD = 7.4). The prototypes, denoted as V1 to V6, were developed to simulate design iterations of a Citroen Xsara steering wheel, with two prototypes classified as low fidelity, two as medium fidelity, and two as high fidelity, each iteration increasing in resolution, information density, and detail. All prototypes were tested on a driving simulator utilizing a SuperDrive SV250® kit with steering wheel and pedals, connected to the Assetto Corsa® video game software. The findings indicate that while higher resolutions tend to exhibit gradual improvement in performance, with better results corresponding to increased resolution, lower resolutions do not demonstrate this linear behaviour. Notably, V1 performed similarly to V3, while V2 exhibited the poorest performance. This phenomenon may be attributed to the design of the prototypes, particularly V2 and V3, which feature a blended interface, leading participants to interact directly with labels, the most contrasting details on the prototypes. In contrast, V1, despite having a complete 2D layout, offers a more coherent design, facilitating interpretation for participants.
Prototypes serve as crucial tools for expressing and validating ideas, engaging with team members, stakeholders, and end-users throughout the product development process (Gero, 1990). However, challenges have emerged regarding their usage over time, stemming from the diverse ways in which prototypes can be developed, ranging from low-fidelity paper prototypes to high-fidelity pre-production models (Pei et al., 2010, 2011). This variation in complexity, termed fidelity or resolution, poses a significant quandary: determining when, how, and where to employ different fidelity levels in the design process. Various studies have delved into this issue, concluding that prototype fidelity is intricately linked to the specific validation objectives pursued by the team, whether functional, assessing mechanical or performance aspects, or centered on usability and user perception (Canuto da Silva & Kaminski, 2015; Coughlan et al., 2007; Lim & Stolterman, 2018; Pei et al., 2011; Sampaio et al., 2020). Despite efforts to categorize prototypes, challenges persist due to industry-specific perspectives, hindering effective communication and production. Pei et al.
(2011) offer a structured framework to organize prototypes based on function and appearance, providing a foundational approach to address this issue. Additionally, the dilemma extends to the visual aspect of prototypes, with different fidelity levels presenting unique production challenges. While low-fidelity prototypes are cost-effective but limited in assessing product variables, high-fidelity counterparts closely resemble final products yet are expensive to produce. Studies by Catani & Biers (1998), Sauer et al. (2008), Wiklund et al. (1992) explore the usability implications of these different resolutions, while others like Deininger et al. (2017) and Jensen et al. (2018) focus on how fidelity influences user perception, contributing to a comprehensive understanding of prototype fidelity’s role in the design process.
The reviewed studies aim to distinguish between low-fidelity and high- fidelity prototypes through user testing, predominantly focusing on software products, where paper prototypes are commonly used to expedite concept validation. Some instances involve prototyping physical products via digital interfaces to address usability concerns. While findings consistently reveal no significant disparities in usability performance between low and high- fidelity prototypes, intriguing insights into user perceptions emerge. For example, Sauer & Sonderegger (2009) note that prototype appearance influences pre-use perceptions more than post-use evaluations, possibly due to users idealized mental images of the product. Moreover, participants tend to prefer digital prototypes over physical ones, potentially stemming from discrepancies between mental idealizations and actual products. In comparisons of physical product prototypes, existing literature echoes similar conclusions to software assessments, finding no significant differences in usability performance. However, Sauer et al. (2008) suggest that current analyses may overlook efficiency aspects, emphasizing the importance of considering additional factors like test scenarios and environmental variables. Conversely, Deininger et al. (2017) and Jensen et al. (2018) present contrasting views, arguing that prototype fidelity significantly influences user satisfaction. Lower fidelity prototypes may lack clarity in function, leading to poorer performance, while higher fidelity prototypes, with detailed information, enhance satisfaction and reduce user frustration.
METHODOLOGY
In this research participants were recruited through a socio demographic questionnaire that included questions about age, nationality, gender, and occupation. Participants were asked about their health problems (e.g., epilepsy).
For this study, 33 participants were randomly recruited, 27 on the academic community, 82%–55% students and 27% researchers, and 4 outside this community, 12%. The participants ranged from 18 to 58 years old with a mean of 23.7 years (SD = 7.4), being 73% from 18 to 23 and 27% from 24 to 58, and 61% were male and 39% were female. Regarding their driving experience, 52% of the participants were on their first 3 years, which means that, according to Portuguese legislation, they are on their probation
The Impact of Resolution and Material Selection on a Prototype Assessment 899
period (MAI, 2020), as 48% of participants were on their regular periods. Additional, 94% of the participants reported not having health problems such as epilepsy and 6% were not aware.
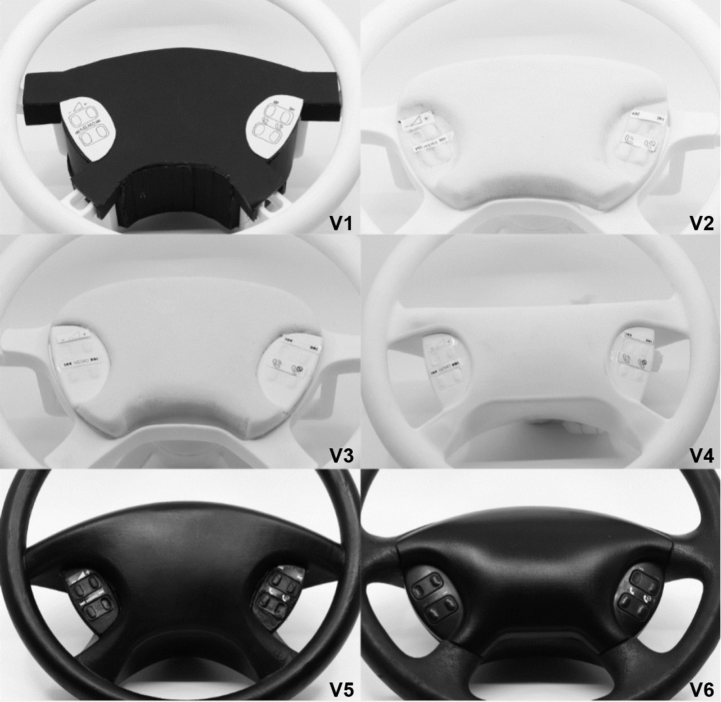
Six prototypes were designed for this study (Figure 1), with two prototypes for each level of fidelity: low, medium, and high. The low-fidelity prototypes were produced in cardboard foam and polyurethane, focusing on overall dimensions and shape. The medium-fidelity prototypes considered the type of information displayed and some degree of functionality, while the high- fidelity prototypes resembled the real product in terms of aesthetic, feel, and function. The highest fidelity prototype was the real product, as a post- product prototype. The product in consideration is a steering wheel, due to its high degree of functionality, which force the participants to drive and perform secondary tasks at the same time.
Figure 1: Prototypes designed for the study, from the lower fidelity (V1 top-left) to the higher fidelity (V6 bottom-right).
This study evaluates how prototype fidelity affects user experience efficiency, specifically comparing participant performance across six
prototype resolutions for a steering wheel. The independent variable is prototype resolution. Participants, randomly assigned to one of six groups, complete tasks while driving along a set route. Metrics include task completion time and button accuracy, assessed through binary evaluations. To prevent learnability bias, the study employs a Between-subjects design, ensuring each participant interacts with only one user interface.
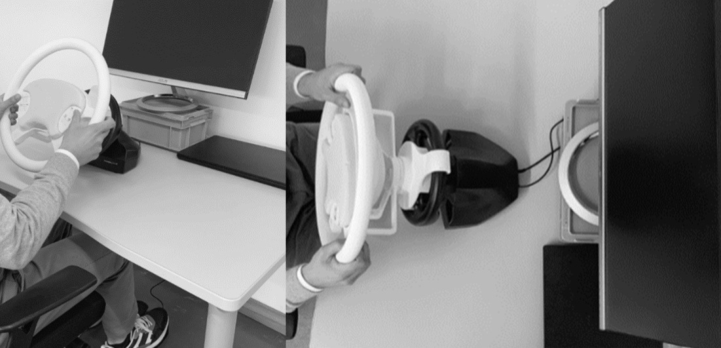
Participants must provide informed consent before joining the study, ensuring confidentiality and data protection. Testing occurred individually in a driving simulator, using a gaming setup (Figure 2) with as steering wheel and pedals kit (Superdrive SV250®), and the video-game Asseto Corsa®. After an initial lap for acclimation, participants complete two laps, adjusting volume and handling calls at designated points. Tasks were performed on straight sections and curves, and monitored by two cameras for eye diversion and button accuracy. A task was considered a “failure” if participants took the eyes of the road for more than 1.5 seconds or if buttons weren’t pressed. Simons-Morton (2014) found that crash risk increased with the duration of single longest glance during all secondary tasks, if the glance took more than 2 seconds. All participants complete identical tasks, grouped by prototype fidelity: low-fidelity 1, low-fidelity 2, medium-fidelity 1, medium-fidelity 2, high-fidelity, and final product. Speed limits (70km/h) and hand positioning near buttons are enforced; violations resulted in task failure.
Figure 2: Simulation setup and interaction with the participant.
Prototypes were tested by their increasing in fidelity order, allowing for the first group to test the V1 prototype, the second the V2, and the rest accordingly. This way the steering wheels could be changed only when they were not needed. The first three groups were constituted by 6 participants each and the last three by 5 participants each. After all the tests were finished the data was analysed on a video editing software so the record could be paused at specific frames and the reaction times could be counted at a milliseconds scale.
The Impact of Resolution and Material Selection on a Prototype Assessment 901
RESULTS
Control Prototype – V6 The highest fidelity prototype (the real product) served as a control, offering the most authentic user experience. As shown in Table 1, this prototype performed excellently in button pressing and task success, with participants consistently keeping their eyes on the road within the 1.5-second limit (mean = 0.95s; SD = 0.13). Participants also adhered to simulation conditions, including the speed limit, resulting in an average test duration of 4 minutes and 50 seconds. Overall, the data suggests a positive user experience with the prototype interface, as evidenced by high task success rates and efficient reaction times. The interface design facilitated smooth and seamless interaction, with participants easily completing tasks and showing a need for more focus during certain moments.
Table 1. Performance data for control prototype – V6.
Low-Fidelity Prototype – V1 The first resolution, designed in paper foam with flat buttons, exhibits a low task success rate, averaging 66.7% (SD = 0.18), as depicted on Table 2. While button accuracy is relatively high, reaction times are prolonged, especially during tasks M1.1, M2, and M6, ranging from 0.8s to 1.68s (mean = 1.09s; SD = 0.31). One participant exceeded the speed limit, resulting in failure at Milestone 1. Average test duration was 4 minutes and 41 seconds. Compared to the Control - V6 (Table 1), Milestones 2 and 6 performed similarly in both prototypes, while Milestone 5 showed lower consistency in V1, resulting in a 33% decrease in task success and an increase of 0.14 seconds in reaction time. Despite some milestones appearing to outperform the control prototype in reaction time, overall performance indicates increased difficulty with this prototype.
Low-Fidelity Prototype – V2 The second prototype, fully sculpted in foam, also shown a low Task Success rate, Table 3. Contrarily to the V1, this prototype had a less reaction times beyond 1.5s, ranging from 0.7s to 1.4s (mean = 1.01; SD = 0.23), however,
the precision on button clicking was significantly lower, ranging from 17% to 50% (mean = 36%, SD = 0.12). 38% of the missing buttons on this test were caused by the participants mistaken the labels with the actual buttons, pressing on the labels instead. Apart from this mistake, no other issues were relevant on this test. Similar to V1, this prototype also shows a worst reaction time on M1.1, M2 and M6.1.s. The Time per Test was, on average, 3min:91seconds. When the V2 is compared to the V6, it is possible to see, table x, a decrease in performance of 64% on task success. Reaction time performed better than the previous steering wheel, only increasing 0.06 seconds.
Low-Fidelity Prototype – V3 The third prototype, a combination of foam sculpture and SLS buttons, yielded improved results with an overall task success rate exceeding 50%, ranging from 50% to 83% (mean = 63.8%; SD = 0.16), as shown in Table 4. However, similar to previous prototypes, errors primarily stemmed from confusion between buttons and labels, accounting for 46% of mistakes. Despite this consistent issue, reaction times showed improved consistency, ranging from 0.8s to 1.3s (mean = 0.96; SD = 0.18). Average test duration was 3 minutes and 75 seconds. Compared to the control, there was a 36.2% decrease in performance, yet reaction times closely mirrored those of the real steering wheel, differing by only 0.01 seconds overall.
Low-Fidelity Prototype – V4 The V4 steering wheel, the first fully 3D-printed prototype, showed satisfactory performance, Table 5. While some reaction times led to failure, precision improved, with most milestones exceeding 80% success (M3, M4, and M5), ranging from 40% to 100% (mean = 73.3%; SD = 0.24). Overall, issues were minimal, except for one participant exceeding speed limits without affecting any milestones. Reaction times were problematic on specific milestones but improved on others, ranging from 0.56s to 1.36s (mean = 0.98s; SD = 0.33). The average test duration was 3 minutes and 8
The Impact of Resolution and Material Selection on a Prototype Assessment 903
seconds. Compared to the control, performance decreased by 26.7%, with reaction times differing by only 0.03 seconds on average.
Low-Fidelity Prototype – V5 Lastly, the high-fidelity prototype, crafted to closely resemble the Control prototype, exhibited outstanding performance, Table 6. Despite initially lower performance on the first milestone, it recovered notably, achieving perfect scores on 4 out of 6 milestones, ranging from 60% to 100% (mean = 90%; SD = 0.17). In terms of reaction time, it closely mirrored the control prototype, ranging from 0.58s to 1.32s (mean = 0.9s; SD = 0.24). The sole issue observed in this test group was a participant failing to respond to the task due to distraction while driving. The average test duration was 4 minutes and 45 seconds. Compared to V6, this prototype only exhibited a 10% decrease in task success. Although reaction times improved overall, the difference was not statistically significant.
When comparing the results of this experiment, a notable observation emerges. Analyzing reaction times alone reveals a trend of improved performance as prototype fidelity increases, with V1 exhibiting the highest average reaction time performance. This suggests a potential correlation between higher fidelity and better performance. However, relying solely on this metric does not provide insights into overall success. Task Success emerges as the most significant metric for this study, considering both reaction time and button-clicking accuracy. Contrary to expectations based on existing literature, the medium and high-fidelity prototypes (V4 and V5) demonstrate a significant enhancement in performance. These prototypes incorporate sensory feedback mechanisms, such as button movement in V4 and audible clicking sounds in V5, potentially contributing to their improved outcomes. Interestingly, lower resolution prototypes also yield noteworthy results, with the lowest resolution prototype showing superior performance. This phenomenon may be attributed to the coherence in
button and label display in the two-dimensional layout of V1, facilitating better understanding. However, in higher resolution prototypes (V2 and V3), participants occasionally misinterpret labels as buttons due to a lack of cohesion between them and the prototype’s body. This highlights the importance of information design in influencing user interaction and performance outcomes across different fidelity levels. While higher fidelity prototypes generally offer superior results, the complexity of tasks significantly impacts outcomes. Milestones with lower workloads exhibit higher performance outcomes, suggesting that design teams can assess metrics with higher confidence levels when tasks are simpler. Overall, these observations underscore the nuanced relationship between prototype fidelity, task complexity, and performance metrics evaluation.
CONCLUSION
In conclusion, this study aimed to answer the research question: “Will different fidelities perform the same regarding the three aspects of usability: Efficacy, Efficiency, and Satisfaction?” The findings indicate that while different fidelity levels do not consistently exhibit uniform performance across all aspects of usability, they may do so in specific contexts. From the literature review, it is evident that efficacy and satisfaction were the primary fields of usability investigated, prompting this study to explore efficiency. The results suggest that low-fidelity prototypes can effectively validate efficacy, offering a cost-effective solution for design teams. Regarding efficiency, higher fidelity prototypes tend to perform better, although medium-fidelity prototypes may suffice, particularly for tasks with lower cognitive workloads. Conversely, high-fidelity prototypes are recommended for assessing satisfaction, as participants demonstrate greater awareness of functionality and clarity.
ACKNOWLEDGMENT
This work has been supported by the European Union under the Next Generation EU, through a grant of the Portuguese Republic’s Recovery and Resilience Plan (PRR) Partnership Agreement, within the scope of the project GreenAuto: Green Innovation for the Automotive Industry (Project ref. nr. 54 - C6448637037-00000013). We also acknowledge the Portuguese Foundation for the Science and Technology (FCT) for the support given to this work through the projects UIDB/05256/2020 and UIDP/05256/2020.
REFERENCES
Canuto da Silva, G., & Kaminski, P. C. (2015). Selection of virtual and physical prototypes in the product development process. The International Journal of Advanced Manufacturing Technology. https://doi.org/10.1007/s00170-015- 7762-2 Catani, M. B., & Biers, D. W. (1998). Usability Evaluation and Prototype Fidelity:
Users and Usability Professionals. Proceedings of the Human Factors and Ergonomics Society Annual Meeting, 42(19), 1331–1335. https://doi.org/10. 1177/154193129804201901
The Impact of Resolution and Material Selection on a Prototype Assessment 905
Coughlan, P., Suri, J. F., & Canales, K. (2007). Prototypes as (Design) Tools for Behavioral and Organizational Change: A Design-Based Approach to Help Organizations Change Work Behaviors. The Journal of Applied Behavioral Science, 43(1), 122–134. https://doi.org/10.1177/0021886306297722 Deininger, M., Daly, S., Sienko, K., Lee, J., Obed, S., & Effah Kaufmann, E. (2017).
Does prototype format influence stakeholder design input? DS 87–4 Proceedings of the 21st International Conference on Engineering Design (ICED 17) Vol. 4: Design Methods and Tools, Vancouver, Canada, 21–25.08. 2017, 553–562. Gero, J. (1990). Design Prototypes: A Knowledge Representation Schema for Design.
AI Magazine. 1990, vol. 11: pp. 26–36, 11. Jensen, L. S., Nissen, L., Bilde, N., & Özkil, A. G. (2018). Prototyping in mechatronic product development: How prototype fidelity levels affect user design input. DS 92: Proceedings of the DESIGN 2018 15th International Design Conference, 1173–1184. Lim, Y.-K., & Stolterman, E. (2018). The Anatomy of Prototypes: Prototypes as
Filters, Prototypes as Manifestations of Design Ideas. MAI (2020). Código da Estrada – CE - Artigo 122.
. “Decreto-Lei n.
102-B/2020”.
Diário da República n
238/2020, Série I (2020-12-09). https://diariodarepublic a.pt/dr/detalhe/decreto-lei/102-b-2020-150757538 Pei, E., Campbell, I., & Evans, M. (2011). A Taxonomic Classification of Visual Design Representations Used by Industrial Designers and Engineering Designers. The Design Journal, 14(1), 64–91. https://doi.org/10.2752/175630610X 12877385838803 Pei, E., Campbell, I. R., & Evans, M. A. (2010). Development of a tool for building
shared representations among industrial designers and engineering designers. CoDesign, 6(3), 139–166. https://doi.org/10.1080/15710882.2010.510197 Sampaio, A. M., Gonçalves, R., Simões, P., & Pontes, A. J. (2020). Human-Centered Design – The Importance of Usability Tests in the Development of Technological Objects. In: Rebelo, F., Soares, M. (eds) Advances in Ergonomics in Design. AHFE2020. Advances in Intelligent Systems and Computing, vol 1203. Springer, Cham. https://doi.org/10.1007/978-3-030-51038-1_46 Sauer, J., Franke, H., & Ruettinger, B. (2008). Designing interactive consumer products: Utility of paper prototypes and effectiveness of enhanced control labelling. Applied Ergonomics, 39(1), 71–85. https://doi.org/10.1016/j. apergo.2007.03.001 Sauer, J., & Sonderegger, A. (2009). The influence of prototype fidelity and aesthetics
of design in usability tests: Effects on user behaviour, subjective evaluation and emotion. Applied Ergonomics, 40(4), 670–677. https://doi.org/10.1016/j. apergo.2008.06.006 Simons-Morton, B. G., Guo, F., Klauer, S. G., Ehsani, J. P., Pradhan, A. K. (2014).
Keep Your Eyes on the Road: Young Driver Crash Risk Increases According to Duration of Distraction, Journal of Adolescent Health, 54 (5), S61–S67, https://doi.org/10.1016/j.jadohealth.2013.11.021 Wiklund, M. E., Thurrott, C., & Dumas, J. S. (1992). Does the Fidelity of Software Prototypes Affect the Perception of Usability? Proceedings of the Human Factors Society Annual Meeting, 36(4), 399–403. https://doi.org/10. 1177/154193129203600429
LISTED IN THE AHFE DIGITAL BOOKSTORE CATALOGUE
Explore the complete digital volume
Human Factors in Design, Engineering, and Computing
Read this individual research paper free through the original publisher, or explore the full digital proceedings book.
ISBN 978-1-964867-35-9
Explore this ISBN in the AHFE Bookstore ↗Listed in the July 2026 bookstore catalogue; search by ISBN to confirm current availability · Digital book purchase optional