Stefano Filippi (2024). Optimizing AI Involvement in Engineering University Courses Based on Students' Personality. In: Human Factors in Design, Engineering, and Computing. AHFE Open Access, vol. 159, pp. 102–109. https://doi.org/10.54941/ahfe1005572
Artificial Intelligence (AI) enhances educational experiences in engineering but varies in effectiveness based on student personality traits. This study investigates the impact of personality traits on engineering students' perceptions of Artificial Intelligence (AI) to optimize AI integration in university courses. Data was collected from students enrolled in two engineering courses during the Academic Year 2023-24. The analysis focused on the Big Five personality traits and various AI perception dimensions. Considering different levels of multivariate regression analysis, we identified key personality traits influencing students' attitudes towards AI. The findings suggest that tailoring AI integration to students' personality profiles can enhance engagement and learning outcomes. Future research should explore additional factors, such as age and attitudes towards technical roles, to further refine educational strategies.
Artificial Intelligence (AI) has become a cornerstone in modern engineering education, offering innovative tools that significantly enhance the learning experience. However, the effectiveness of integrating AI into university courses varies among students (Erbas and Maksuti, 2024; Bal Ram Pratima Verma, 2023; Filippi, 2023; Chen et al., 2020; Roll and Wylie, 2016; Zawacki-Richter et al., 2019). Variations in individual student characteristics, particularly personality traits, can influence how students perceive and interact with AI-based educational tools. Previous studies have demonstrated that personality traits can significantly impact academic performance and attitudes towards technology (Poropat, 2009; Woolf et al., 2013). Understanding these differences is crucial for optimizing AI’s role in educational settings to maximize engagement and learning outcomes.
This study aims to optimize the involvement of AI in engineering courses by tailoring its integration based on the personality traits of enrolled students. By examining how different personality traits influence engineering students’ perceptions of AI, this research seeks to develop personalized educational strategies. The primary objective is to identify key personality traits that significantly affect students’ attitudes towards AI and use
Optimizing AI Involvement in Engineering University Courses 103
these insights to enhance the design and implementation of AI tools in engineering education. The Big Five personality traits model, which includes Extraversion, Agreeableness, Conscientiousness, Neuroticism, and Openness to experience/culture, provides a comprehensive framework for this analysis (Goldberg, 1990; Barrick and Mount, 1991; Johnson and Ostendorf, 1993).
This paper begins with an overview of the research context and goals, followed by a detailed description of the methodology, including data collection and analysis techniques. The results and discussion sections present the findings and their implications, leading to practical recommendations for educators. The paper concludes with a summary of key insights and suggestions for future research directions.
MATERIAL AND METHODS Available Data
We collected data from engineering students across two university courses at the University of Udine, Italy, during the Academic Year 2023–24. We administered questionnaires as Google Forms during the lessons of the course “Drawing and geometric modelling in engineering” (“Disegno e modellazione geometrica delle machine”) - degree courses in mechanical engineering - and during the lessons of the course “Product interaction and innovation” (“Interazione ed innovazione di prodotto”) - master’s degree courses in mechanical and management engineering. Both the courses deal with product representation and engineering design. Clearly, concepts are developed at different levels due to the different age of the students and to the lesson placement inside their course of study. Nevertheless, in both the cases AI and AI tools have been introduced in a two-hour lesson and during some workshops. Regarding the age of the students, those who attended the first course were mainly aged 19 to 21; there were 22 to 25-year-old enrolled in the second course. The collected dataset included age, course level, five personality traits (PTs) based on the Big Five model (BFI) — Extraversion or surgency, Agreeableness, Conscientiousness, Neuroticism, and Openness to experience/culture — and perception of five AI aspects: Attitude to AI, Trust in AI, Social Influence towards AI, Fairness & Ethics of AI, and Usefulness & Performance Expectancy of AI.
Analytical Approach We performed multivariate regression analysis to determine the impact of age, course level and PTs on AI perceptions. Therefore, the first three were considered as independent variables and the fourth the dependent one. We focused on two aspects of the multivariate regression analysis, the Principal Component Analysis - PCA - and the R-squared. PCA role in a multivariate regression analysis is to pre-process data. Having a dataset with a large number of correlated predictors, PCA helps reduce the dimensionality by transforming the original correlated variables into a smaller set of uncorrelated principal components. These principal components can then be used as predictors in a regression model. Regarding the benefit of PCA, using
104 Stefano
principal components can mitigate multicollinearity issues, improve model interpretability, and sometimes enhance predictive performance (Jolliffe, 2002). Regarding the R-squared purpose in a multivariate regression analysis, it is a measure to evaluate the fit of a regression model, indicating the proportion of the variance in the dependent variable that is explained by the set of independent variables. A higher R-squared value indicates a better fit, meaning the model explains a large proportion of the variance in the dependent variable. As per these descriptions, PCA helps in preparing the data, while R-squared helps in evaluating the model’s performance (Wooldridge, 2013). The decision to consider both these aspects was because their different roles and functioning could give suggestions to improve the education activities from different points of view.
ACTIVITIES Data Collection
A Google form was developed to administer the questionnaire, and a Microsoft Excel workbook was used to collect and manage data for the analysis. The questionnaire contained 92 questions. University ID, age, and course enrolled (selected among the two considered in the research) had one question each; 44 questions were to get the PTs of the participants and 44 questions to focus on their perception of the AI aspects. Regarding the PTs, the 44 questions replicated in toto the Big Five Inventory (BFI) questionnaire (John and Srivastava, 1999). Participants were well informed before participating in the study, ensuring that they were aware of the study’s purpose and their rights. Formulas in the workbook took care of translating the answers into values for the five PTs expressed in the range [0..100]. Similarly, mean formulas in the workbook converted the answers referring to AI into values for the five AI expressed in the range [1..5], since the classic Likert scale was used.
As of July 19th, 2024, we got 56 complete answers; 36 were from students enrolled in the earlier course and 20 from the later course.
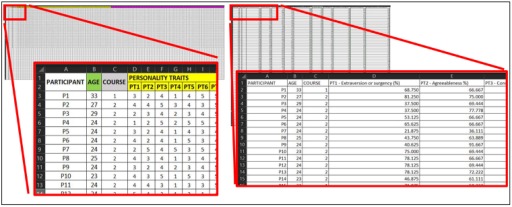
Left of Figure 1 shows a highlight of the answers to the questionnaire while a highlight of the data, once, processed, appears to the right of the same figure.
Figure 1: Highlights on the answers to the questionnaire (left) and on the processed data ready for the analysis (right).
Optimizing AI Involvement in Engineering University Courses 105
Data Analysis PCA and R-squared analyses were performed separately. They occurred as described hereafter.
The PCA section of the multivariate regression analysis was based on an Excel workbook containing several sheets. The DATA sheet includes the original dataset with participant identifiers, age, course, PTs (PT1 to PT5), and AI perceptions (AI1 to AI5). The Descriptive Statistics sheet provides summary statistics (count, mean, standard deviation, min, 25th percentile, median, 75th percentile, and max) for each variable. The Standardized Data sheet shows the standardized values of the independent variables (AGE, COURSE, PT1 to PT5). The Principal Components sheet presents the results of the Principal Component Analysis (PCA), including the first two principal components that capture the most variance. The PCA and AI Analysis sheet combines the principal components with AI-related scores, enabling deeper analysis of how these components relate to AI perceptions. This workbook helps identify key patterns in the data and understand the relationships between PTs and AI-related attitudes, providing a comprehensive overview of the dataset and its characteristics.
The R-squared section of the multivariate regression analysis was based on an Excel workbook containing several sheets as well. The DATA sheet and the Descriptive Statistics sheet are the same as before. The AI Aspect Coefficients Sheets (Standardized) contain separate sheets for each AI aspect with regression coefficients, p-values, and confidence intervals using standardized PTs. The AI Aspect Summary Stats Sheets (Standardized) include separate sheets for each AI aspect with summary statistics (R-squared, Adjusted R-squared, F-statistic, etc.) using standardized PTs. This workbook helps identify which specific traits and factors significantly influence each aspect of AI perceptions, providing quantitative measures of the impact and a clear understanding of how well the independent variables explain the variance in AI-related attitudes.
RESULTS AND DISCUSSION
The PCA analysis performed on the dataset reveals the principal components that capture the most variance among the PTs and AI perceptions. For example, the first principal component (PC1) might show high loadings on Extraversion (0.75) and Openness to experience/culture (0.68), indicating that these traits together account for significant variability in students’ attitudes towards AI. The second principal component (PC2) might highlight combinations such as Conscientiousness (0.58) and Neuroticism (0.62). This suggests that students who score high on these traits might have distinct attitudes towards AI, which can be leveraged to tailor AI integration in educational settings. These components are derived from standardized PTs (PT1 to PT5), showing the underlying patterns and relationships within the data. For instance, if PC1 is strongly associated with higher scores in AI1 (Attitude to AI) and AI5 (Usefulness & performance expectancy of AI), it suggests that students with high Extraversion and Openness to experience/culture tend to have more positive attitudes and expectations
106 Stefano
towards AI. The explained variance ratios for these components indicate how much of the total variance in the dataset is captured by each principal component, providing a broad overview of the primary factors driving differences in AI perceptions among students.
The R-squared analysis identifies specific predictors that significantly influence various aspects of AI perceptions among students. For example, the regression analysis for AI1 (Attitude to AI) might show that the COURSE variable (earlier course vs. later course) and PT2 (Agreeableness) are significant predictors, with high R-squared values indicating that these variables together explain a substantial portion of the variance in AI1 scores. Similarly, the regression analysis for AI2 (Trust in AI) might reveal that PT4 (Neuroticism) negatively impacts trust in AI, while PT5 (Openness to experience/culture) has a positive effect. The coefficients and p-values from the regression models quantify the impact of each predictor, showing which PTs and demographic factors (such as AGE and COURSE) are most influential. For instance, if the model for AI3 (Social influence towards AI) has an R-squared value of 0.45, it indicates that 45% of the variance in AI3 scores can be explained by the independent variables in the model. This analysis provides precise, actionable insights into the key factors affecting students’ AI perceptions, guiding targeted interventions and curriculum adjustments.
Using both PCA and R-squared analysis offers a holistic approach to improving AI education. PCA helps identify broad patterns and combinations of traits influencing AI perceptions, while regression analysis provides specific, actionable insights into significant predictors. Combining these insights allows for the design of a flexible and adaptive curriculum that caters to the diverse needs and characteristics of students. For example, a student with high Extraversion and Openness to experience/culture but low trust in AI might benefit from interactive group projects (PCA insight) and clear ethical guidelines (R-squared insight). In summary, integrating the findings from both PCA and R-squared analysis provides a comprehensive strategy to enhance AI education, ensuring that it is both engaging and effective in addressing the diverse traits and perceptions of university students. This dual approach not only improves the overall learning experience but also fosters a deeper understanding and adoption of AI among students. The list of the practical, ready-to-use suggestions to improve education activities inside our university courses is shown in Table 1. The table reports the origin (the rationale) for each suggestion, specifically spotting on the results of the data analysis.
This table provides a coherent and comprehensive strategy to enhance AI education based on insights from both PCA and R-squared analyses.
Optimizing AI Involvement in Engineering University Courses 107
Table 1. Suggestions to improve university education activities.
Table available in the original PDF paper.
Suggestion Rationale (PCA vs. R-squared) Incorporate Interactive and Hands-On Learning Activities PCA: High loadings on Extraversion (0.75) and Openness to experience/culture (0.68) in PC1 suggest these traits benefit from interactive and exploratory activities. Implement Collaborative Group Projects
PCA: PC2 shows significant variance explained by a combination of traits, indicating effective group dynamics influenced by mixed traits. Use Broad Applications of AI in Various Fields
PCA: PCA reveals that broader AI applications can appeal to combinations of traits such as PC1’s high loadings on Extraversion and Openness to experience/culture. Create Customized Learning Experiences for Different Traits
PCA: PC2 highlights key patterns in Conscientiousness (0.58) and Neuroticism (0.62), suggesting tailored tasks based on these traits. Focus on Ethical AI Practices PCA: PCA indicates Neuroticism (0.62 in PC2) is linked to ethical concerns, requiring focus on transparent and ethical AI discussions. Design a Flexible Curriculum Based on Key Insights
PCA: PC1 and PC2 explain 40% of the variance in AI perceptions, guiding the adaptation of curriculum based on these insights. Engage Students through Real-World AI Projects
PCA: Practical engagement activities are highlighted by PCA as important for understanding AI, as seen in PC1’s high variance explanation. Develop a Supportive Learning Environment
PCA: PCA suggests high Neuroticism (0.62 in PC2) requires a supportive environment to improve comfort and engagement with AI topics. Incorporate Regular Feedback Loops from Students
PCA: Continuous feedback adaptation is essential, as PCA highlights evolving student needs influencing AI perceptions. Emphasize the Positive Impact of AI through Success Stories
PCA: Positive impact framing aligns with traits like Agreeableness (0.55) and Extraversion (0.75) in PC1. Provide Targeted Support to Build Trust in AI
R-squared: Regression analysis shows Neuroticism negatively impacts trust in AI (AI2, coefficient -0.34), while Openness to experience/culture positively impacts trust (coefficient 0.22). Make Course-Specific Adjustments for Early and Later Courses
R-squared: Regression analysis indicates COURSE significantly predicts attitudes towards AI (AI1, coefficient 1.10), suggesting tailored content for different course stages. Enhance Attitudes Towards AI with Cooperative Learning Activities
R-squared: Regression analysis reveals Agreeableness significantly impacts positive AI attitudes (AI1, coefficient 0.19), promoting cooperative learning environments. Identify and Address Specific Traits in Students
R-squared: Identify traits like Neuroticism (negative coefficient for AI trust) and Extraversion (positive coefficient for AI attitude) to provide targeted support.
CONCLUSION
This study highlights the significance of considering personality traits when integrating AI into engineering courses. Using PCA and R-squared in multivariate regression, we identified key traits that influence students’ perceptions of AI. Tailoring AI integration based on these traits can enhance engagement and learning outcomes. Our findings suggest that, e.g., students with high Extraversion and Openness to experience/culture benefit from interactive AI activities, while those high in Conscientiousness and Neuroticism need more structured environments. Practical recommendations include using hands-on learning, collaborative projects, emphasizing ethical AI practices, etc.
Future research should explore additional personality dimensions and factors like cultural background and prior AI exposure. Continued
108 Stefano
adaptation and longitudinal studies are essential to optimize AI’s role in education and ensure its effectiveness. By integrating personality traits into AI education, we can create more engaging and effective learning experiences, fostering a deeper understanding and adoption of AI technologies.
ACKNOWLEDGMENT
The author would like to acknowledge the support and contributions of the students enrolled in the two university courses “Drawing and geometric modelling in engineering” (“Disegno e modellazione geometrica delle machine”) - degree courses in mechanical engineering - and “Product interaction and innovation” (“Interazione ed innovazione di prodotto”) master’s degree courses in mechanical and management engineering in the Academic Year 2023–24.
REFERENCES
Bal Ram, Pratima Verma, 2023. Artificial intelligence AI-based Chatbot study of ChatGPT, Google AI Bard and Baidu AI. World J. Adv. Eng. Technol. Sci. 8, 258–261. https://doi.org/10.30574/wjaets.2023.8.1.0045 Barrick, M. R., Mount, M. K., 1991. The Big Five Personality Dimensions and Job
Performance: A Meta-Analysis. Personnel Psychology 44, 1–26. https://doi.org/ 10.1111/j.1744-6570.1991.tb00688.x Chen, L., Chen, P., Lin, Z., 2020. Artificial Intelligence in Education: A Review. IEEE Access 8, 75264–75278. https://doi.org/10.1109/ACCESS.2020.2988510 Erbas, I., Maksuti, E., 2024. The Impact of Artificial Intelligence on Education. Ijirme
03. https://doi.org/10.58806/ijirme.2024.v3i4n01 Filippi, S., 2023. Measuring the Impact of ChatGPT on Fostering Concept Generation in Innovative Product Design. Electronics 12, 3535. https://doi.org/ 10.3390/electronics12163535 Goldberg, L. R., 1990. An alternative “description of personality”: The Big-Five
factor structure. Journal of Personality and Social Psychology 59, 1216–1229. https://doi.org/10.1037/0022-3514.59.6.1216 John, O. P., Srivastava, S. (1999). The Big Five trait taxonomy: History, measurement, and theoretical perspectives. In L. A. Pervin & O. P. John (Eds.), Handbook of Personality: Theory and Research (Vol. 2, pp. 102–138). Guilford Press. Johnson, J. A., Ostendorf, F., 1993. Clarification of the five-factor model with the
Abridged Big Five Dimensional Circumplex. Journal of Personality and Social Psychology 65, 563–576. https://doi.org/10.1037/0022-3514.65.3.563 Jolliffe, I. T., 2002. Principal Component Analysis, Springer Series in Statistics.
Springer-Verlag, New York. https://doi.org/10.1007/b98835 Poropat, A. E., 2009. A meta-analysis of the five-factor model of personality and academic performance. Psychological Bulletin 135, 322–338. https://doi.org/10. 1037/a0014996 Roll, I., Wylie, R., 2016. Evolution and Revolution in Artificial Intelligence in
Education. Int J Artif Intell Educ 26, 582–599. https://doi.org/10.1007/s40593- 016-0110-3 Wooldridge, J. M., 2013. Introductory econometrics: a modern approach, 5th ed. ed.
South-Western Cengage Learning, Mason, OH.
Optimizing AI Involvement in Engineering University Courses 109
Woolf, B. P., Lane, H. C., Chaudhri, V. K., Kolodner, J. L., 2013. AI Grand Challenges for Education. AI Magazine 34, 66–84. https://doi.org/10.1609/aima g.v34i4.2490 Zawacki-Richter, O., Marín, V. I., Bond, M., Gouverneur, F., 2019. Systematic review
of research on artificial intelligence applications in higher education – where are the educators? Int J Educ Technol High Educ 16, 39. https://doi.org/10.1186/ s41239-019-0171-0
LISTED IN THE AHFE DIGITAL BOOKSTORE CATALOGUE
Explore the complete digital volume
Human Factors in Design, Engineering, and Computing
Read this individual research paper free through the original publisher, or explore the full digital proceedings book.
ISBN 978-1-964867-35-9
Explore this ISBN in the AHFE Bookstore ↗Listed in the July 2026 bookstore catalogue; search by ISBN to confirm current availability · Digital book purchase optional