Christy Manning, Duha Ali, Shivani Nagrecha (2024). The Influence of Gender/Sex on Work-Related Musculoskeletal Disorders: A Systematic Review and Meta-Analysis. In: Human Factors in Design, Engineering, and Computing. AHFE Open Access, vol. 159, pp. 1491–1501. https://doi.org/10.54941/ahfe1005717
This systematic review and meta-analysis examines the influence of gender/sex on the risk of developing work-related musculoskeletal disorders (WMSDs). Previous research has indicated a link between female gender/sex and increased WMSD risk, but findings have been inconsistent due to varying study designs and high null result rates. This study synthesized adjusted odds ratios (AORs) from 93 high-quality cross-sectional studies that examine WMSD risk while controlling for various confounding factors such as job exposure and environmental variables. The overall synthesized AOR for female gender/sex on WMSD risk was 1.50, and gender was a statistically significant predictor of risk for most but not all body parts and industries. High heterogeneity was present in the overall synthesis but recued when stratifying results by industry and body part. The results suggest a significant but low to moderate link between gender and WMSD incidence, with some variation by industry and body part.
Work related musculoskeletal disorders (WMSDs) refer to injuries and illnesses developed because of exposures to musculoskeletal risk factors, such as awkward postures, vibration, repetitive motions, etc., in the workplace. Some of the most common WMSDs include carpal tunnel, tendonitis, and back injuries (CCOHS, 2014). WMSDs burden not only the victims and their family but also the workplace. In 2019, there were 266,530 cases of non-fatal WMSDs that led to days away from work reported to the Bureau of Labor Statistics by private industry workers in the United States. Adding workplace injuries from overexertion in lifting or lowering, the figure increases to 353,270 cases (BLS, 2020). It has long been speculated that gender/sex influences risk for WMSDs, with evidence to support that in general, females are more prone than males (e.g., Overstreet et al., 2023). However, there are several null findings on the subject (e.g., Roquelaure et al., 2009) and even instances where
female gender/sex is shown to be protective against some WMSDs especially of the back (e.g., de Freitas Cardodo et al., 2022). Literature reviews corroborate that the risk difference between males and females may be more nuanced. One 2010 literature review of longitudinal risk factors for upper extremity WMSDs and found that female gender/sex was a risk factor with “reasonable evidence” for the spine and wrist/hand, “insufficient evidence” for the low back, elbow/forearm, and “no” effect for the lower limbs, hip, knee, shoulder, and upper limbs (da Costa & Vieira, 2009). A review of five population studies (Kilbom & Messing, 1998) depicted no significant gender/sex differences in back symptoms but positive association for carpal tunnel syndrome and upper extremity disorders. A 2004 literature review consistently reported positive effect sizes for gender, but 16 out of 56 studies summarized reported at least one null finding (Punnett & Wegman, 2004). Authors stated that there were no consistent patterns among the articles that reported null findings, and they observed that much of the prior evidence for gender/sex and WMSDs was anecdotal. A review of evidence for gender/sex and WMSDs prior to the year 2000 descriptively presented prevalence or odds ratios for gender/sex when adjusted for occupational factors in a variety of studies across industries and body parts (Punnett & Herbert 2000). The study found overall no pattern when examining whole body, back, and lower limb disorders, and note that some studies of the upper body regions found either no gender/sex difference or a very large difference, concluding that after adjusting for occupational exposure there was no discernible pattern.
The goal of this meta-analysis is to explore the relationship between gender/sex and WMSDs risk. No other meta-analysis on the subject has been found. The meta-analysis systematically incorporates the null and contradictory findings, a task that can only be conducted properly via a meticulous review of all evidence. It accounts for the variety of occupational, health, psychological, and other factors that influence WMSDs development, isolating the impact of gender/sex. Finally, by presenting the first quantifiable estimate of the association across many industries and body parts, it contributes a unique and rigorous addition to the discussion in the literature.
METHODS
Study Selection Articles were retrieved from five databases: Scopus, PubMed, Web of Science, Ergonomics Abstracts, and Embase. Initial inclusion criteria were English language, peer-reviewed articles, and publication between the years 2000–2022. The search keywords were: WMSD or work-related musculoskeletal disorder or work-related musculoskeletal disease, AND gender or sex, AND work or worker or employee or employment or job or job analysis or workload or occupation or occupational. All articles were screened for relevance by two reviewers, who were initially blind to the other’s decision. For articles with conflicting inclusion decisions, a third reviewer examined such articles to help resolve the disagreement.
After thorough examination of the available evidence, it was observed that most studies were cross-sectional in design. Among effect size measures
The Influence of Gender/Sex on Work-Related Musculoskeletal Disorders 1493
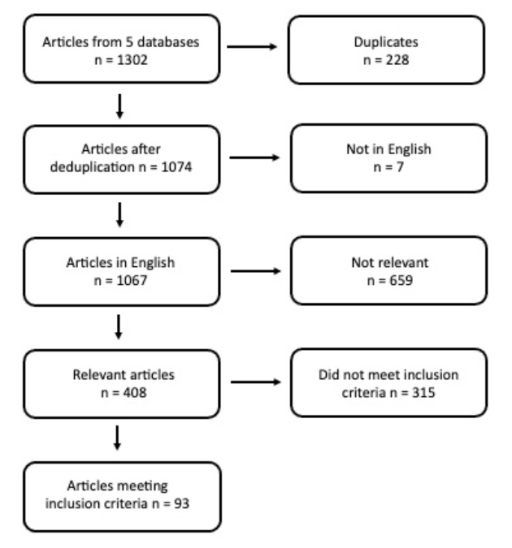
reported, the most rigorous statistic was the adjusted odds ratio (AOR) because it isolated the effect of gender/sex on WMSD outcome only, controlling for confounding variables. Therefore, the AOR with confidence interval was extracted as the outcome variable of interest, and only cross- sectional studies that reported an AOR were included in the final analysis. Most studies (89%) used a body part discomfort map such as the Nordic questionnaire or other self-report symptoms as diagnosis the metric for WMSD incidence. The others used either a physician confirmation or company injury logs. The PRISMA diagram in Figure 1 presents the screening process and the number of articles screened, eliminated, and included at each stage.
Figure 1: PRISMA diagram (PRISMA 2020).
A risk-of-bias checklist was developed based on common sources of bias thought to be present in the studies, including healthy worker, reporting, non-response, confounding, selection, observer, and recall (Bär et al., 2021). Almost all studies had a risk of healthy worker bias, and many that asked workers about issues in the last year could have exhibited recall bias. The JBI quality checklist for cross-sectional studies (JBI 2017) was used for overall quality assessment. Exceptionally poor-quality articles could be eliminated, but none were eliminated for quality that met the inclusion criteria. This is likely due to self-selection, since only the more rigorous articles made the extra effort to adjust their analysis and thus merit final inclusion.
Statistical Analysis It was not possible to use traditional methods of synthesizing odds ratios such as the Mantel-Haenszel (Mantel & Haenszel, 1959) or Peto (Yusuf et al., 1985) methods because the raw confusion matrix data containing information on case and control outcomes cannot apply to an adjusted analysis. Therefore, the odds ratios were logarithmic transformed for use in a standard inverse variance approach (Lee et al., 2016) and pooled using the restricted maximum likelihood method (REML) (Viechtbauer, 2005). Information on variance, however, was not readily available for most studies since 95% confidence intervals are typically reported instead. To account for variance, standard errors (SE) were extracted from the upper confidence intervals using Equation (1)
Odds Ratio
−LN(Upper 95% Estimate)
SE = LN
1.96 (1)
Many of the studies with null findings did not report an odds ratio or confidence interval. Instead, to signal null findings, such articles either simply pointed out in the text that no relationship was found or excluded gender/sex from the table presenting their multivariate model’s final included predictors. Such studies comprised 34% of all included studies. For these studies, the AOR was assumed to be 1.0. Standard errors still needed to be imputed as well since excluding the null findings was not an option given the study goals. The prognostic method (Ma et al., 2008) was selected because it applied to variance, the required inputs were available from the data, it applied to cross- sectional studies, and it was implementable in standard spreadsheet software. It estimates the variance based on the variance of the other studies included and the sample size of the study with missing data. Equation (2) was used
Pk
Equation reproduced from the original PDF.
SEj =
√ni k√nj
Where k is the number of studies with complete data, i is the number of studies with complete data, and j is the study with incomplete data.
Results were reported by back-transforming the pooled effect size into an odds ratio via exponentiation. The pooled 95% confidence intervals for the odds ratios were obtained by Equation (3) 95% CI = x ± 1.96 ∗τ (3)
Where x is the pooled effect size and τ is the standard deviation of effect size. This result was also back-transformed into ORs by exponentiation. Between-study heterogeneity was assessed using Cochran’s Q (Cochran, 1954). The authors have chosen to reference both gender and sex simultaneously, with the labels “female” and “male”. The reason is that the underlying datasets of the 93 articles in this analysis employed a variety of interpretations of this concept, with some utilizing “sex”, some “gender”, and some referring
The Influence of Gender/Sex on Work-Related Musculoskeletal Disorders 1495
to “female gender” or labelling “woman” in conjunction with “sex”. Non- binary classification was not elaborated on in this study because of 1) the majority of synthesized evidence employed a binary classification (male, female); 2) the very small sample size available of non-binary individuals; 3) while definitely meriting further investigation, non-binary gender/sex was simply outside the scope of the study.
RESULTS
Confounders were categorized as health factors, personal/demographic factors other than gender/ sex, psychological factors, and job exposure factors. 90 out of 93 studies included more than 3 covariates. All studies included age as a covariate. 43 included another demographic covariate such as ethnicity or marital status. All except three studies controlled for the type of work performed, either through assessing ergonomic exposures, assessing the individual’s particular job description, or working style, or both. The three studies that did not explicitly control for differences in on-the-job exposure were analysis of a single workplace, so the possibility of exposure differences could have been small. The most commonly adjusted health metrics was body mass index (BMI) but others included existing morbidity, smoking, exercise, substance use, or general self-reported good health. 61 studies controlled for years on the job. 48 studies accounted for psychological metrics such as social support, job stress, general stress, control/decision latitude, life satisfaction, or other psychological metrics. 16 studies controlled for environmental factors such as temperature or noise. 47 studies controlled for number of hours or pace worked.
Overall Results The 93 included studies together comprised a sample size of 150,087 individuals. Of this sample, 67,114 or 44.7% were female and 82,973 or 55.3% were males. Studies originated from 39 different countries. Table I presents the overall results. The total number of AORs is larger than the number of included studies because many studies reported data for multiple body parts. Across all 93 included studies there were 233 separate effect sizes for multiple body parts. The overall AOR was 1.50 with a 95% confidence interval of (0.76, 2.93),
Body Parts
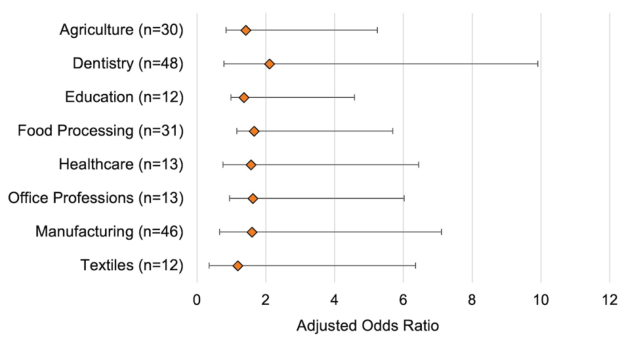
Table 1 breaks down the results by body part where the body part was reported by at least six studies. The hand/wrist category includes studies that reported either the hand or wrist, or both the hand and wrist together. The “any body part” category includes studies that reported the general incidence of any WMSDs, without specifying which body part. The AOR for female WMSD with male as a reference was statistically significant for the lower back, neck, hand/wrist shoulder, and any body part. Figure 2 presents a forest plot of the synthesized AORs by body part. Table 1 further presents results from two composite body part categories created by the authors: low body and upper body. The feet, ankle, leg, knee, hip, and thigh did not contain
enough reported effect sizes to synthesize individually, but when combined into a “low body” category contained enough reported AORs to synthesize. Since many studies reported the “upper body” or “upper extremity” without specifying which upper body part, these designations were combined with all other upper body parts such as elbow, arm, and hand/wrist, and reported in Table 1.
Industry The industry of each study was classified according to the North American Industry Classification System, and meta-analysis was performed for industries with at least five effect sizes from at least three different studies. The manufacturing industry contained a high number of studies and AORs for two sub-categories: textiles and food processing. The healthcare industry further included a high number of studies and AORs for the sub-category dentistry. All industries displayed a statistically significant AOR for gender/sex except textiles. The office and information services category presented in this analysis represents a combination of NAICS industry categories pertaining to such type of work. These categories are information, finance and insurance, real estate and leasing, professional, scientific, and technical services, management of companies and enterprises, and administrative support and waste management services (codes 51-56). Table 1 presents results by industry including the number of studies represented by each NAICS classification and Figure 2 presents the forest plot.
The Influence of Gender/Sex on Work-Related Musculoskeletal Disorders 1497
Figure 2: Forest plots: Results by industry (upper) and body part (lower) (NAICS 2019).
Body parts represented in each industry classification were examined, and industries that contained at least four reported effect sizes for a given body part were further analyzed. Results stratified for both body part and industry are presented in Table 2.
DISCUSSION
The overall synthesized AOR for female gender on WMSD incidence was 1.5, suggesting a relatively weak association or a small effect. The only synthesized AOR that approached a medium association or moderate effect, typically considered starting around 2.5 (Rosenthal, 1995), was the neck in office and information services. There were no synthesized AORs that would be considered to have a strong association or large effect, meaning a magnitude of greater than 4.
Almost all confidence intervals for all AORs, including the overall AOR, included the value 1.00. Yet, most of these same AORs tested as statistically significant. Often if a confidence interval for an odds ratio includes 1.00,
which represents no effect, is reported as not statistically significant. It is important to note however that the confidence interval indicates the precision of the result, not the p-value (Szumillas, 2010). It is possible for the results to be statistically significant yet have a confidence interval that spans 1.00 if the spread in the data is high. All synthesized AORs in this analysis registered as having only a small or weak association, putting them close to 1.00. Given the high heterogeneity evidenced by Cochran’s Q, the precision is expected to be lower than not, so a less precise AOR estimate that is close to 1.00 might easily yield a confidence interval whose low-end dips below 1.00. Therefore, the AORs with p-values below 0.05 are considered statistically significant in this study even if the 95% confidence interval includes 1.00.
The overall AOR included a Cochran’s Q that was not just statistically significant but also very high (1,039). This is not unexpected since the studies were combined from 39 different countries, 10 major industry categories comprising 38 smaller industries, plus studies that examined the entire general working population, and 15 body parts or combinations of body parts. When broken down further, nine out of ten body parts and six out of eight industries examined had statistically significant Cochran’s Q. The most granular analysis, however, that examined AORs by both body part and industry at the same time, substantially decreased heterogeneity. Only eight out of 26 synthesized AORs retained a statistically significant Cochrane’s Q, and even for those magnitude was still substantially lower than the previous analyses. The substantial drop in heterogeneity when filtering by both body part and industry suggests that this type of result yields the highest fidelity. The granular analysis overall yielded very similar AORs to the overall analysis and the analysis by body part and industry separately. However more of the p-values dropped out of significance.
Table 2. Results stratified by body part and industry.
The Influence of Gender/Sex on Work-Related Musculoskeletal Disorders 1499
Table 2. Continued Number of Effect Sizes
Table available in the original PDF paper.
Adjusted Odds Ratio
95% Confidence Interval
p-value Cochran’s Q (p-value) Information and Office Services Hand/Wrist 6 1.28 0.77, 2.13 0.276 4.19 (0.241) Neck 6 2.41 1.71, 3.38 0.005 8.67 (0.123) Low Body 4 1.00 1.00, 1.00 1.000 0.00 (1.000) Any Body Part 5 1.66 0.93, 2.95 0.068 8.15 (0.086) Back 5 1.05 1.05, 1.05 0.234 0.17 (0.997) Healthcare Neck 10 1.35 0.87, 2.08 0.028 10.37 (0.321) Shoulders 11 1.53 0.72, 3.29 0.040 23.7 (0.008) Hand/Wrist 5 1.22 0.83, 1.78 0.166 4.67 (0.322) Low Back 8 1.53 0.92, 2.53 0.029 9.87 (0.196) Low Body 11 1.67 1.18, 2.35 0.003 11.85 (0.296) Any Body Part 9 1.97 0.68, 5.71 0.024 21.72 (0.006) Dentistry Shoulders 6 1.82 0.98, 3.39 0.058 8.91 (0.113) Neck 4 1.42 1.34, 1.50 0.076 1.60 (0.659) Any Body Part 4 1.72 1.20, 2.46 0.271 9.28 (0.026) Education Back 6 1.36 0.81, 2.29 0.079 13.12 (0.002) Upper Body 5 1.42 1.41, 1.42 0.018 2.62 (0.458)
A primary strength of this study is that it overcomes publication bias, whereby statistically significant results are more likely to be reported in the literature. Out of 233 effect sizes, 80, or 34%, were not only not significant but their value and confidence intervals were not even directly reported in the study. The data extractors had to either read in the text that gender/sex became an insignificant predictor in the final multivariate model, or infer as such by examining the results tables and noting any body parts that did not include gender/sex in the final multivariate model. Only a deliberate, systematic review and meta-analysis can account for this, providing a more comprehensive and balanced picture of the true association between gender/sex and WMSDs.
A limitation of this study is the high level of heterogeneity in all but the most granular analysis. To overcome this, more cross-sectional studies should be conducted for all industries and body parts so that the granular analysis can be applied to more industries and body parts. Another limitation is the use of cross-sectional data. Even though most data was in this form, it is not possible to assign causality with this study type. Future work should gather evidence using longitudinal studies so that there are enough longitudinal studies to merit a meta-analysis on that study type. Finally, many studies used a symptomatic questionnaire as their WMSD diagnosis metric. Self- report methods have limitations such as subjectivity, and may entail some uncertainty of work-relatedness of the disorder as well as the severity of the discomfort. Future work could use more objective diagnosis metrices such as company reports or physician visits, even though there are limitations with these metrics as well.
CONCLUSION
This was the first systematic review and meta-analysis examining the influence of gender/sex on developing a WMSD. It synthesized 233 effect sizes from 93 different studies across 39 countries and 150,087 individual subjects. It examined the overall adjusted odds ratio, and adjusted odds ratios sorted by industry, body part, and both industry and body part together. Because the AOR was used, the results of this study isolate the impact of gender/sex while controlling for occupational exposures, personal characteristics, health factors, and more. The overall AOR of being female for developing a WMSD was 1.50. The lower back, hand/wrist, neck, shoulder, and any body part had statistically significant AORs, as did all industries examined except textiles. Stratifying AORs by both industry and body part simultaneously substantially reduced heterogeneity. While most effect sizes were statistically significant, their AORs were in the range associated with small effects, suggesting that the clinical significance may be low. Further studies on the subject are merited to allow for more granular analysis in the future.
REFERENCES
Bär, M., Steinhilber, B., Rieger, M. A., Luger, T. (2021) The influence of using exoskeletons during occupational tasks on acute physical stress and strain compared to no exoskeleton - A systematic review and meta-analysis. Applied Ergonomics, 94:103385. Canadian Centre for Occupational Health and Safety (CCOHS). (2014) Work-
related Musculoskeletal Disorders (WMSDs). Ccohs.ca. https://www.ccohs.ca/o shanswers/diseases/rmirsi.html Cochran, W. G. (1954) Some Methods for Strengthening the Common χ 2 Tests.
Biometrics, Volume 10, No. 4, p. 417. da Costa, B. R., Vieira, E. R. (2009) Risk factors for work-related musculoskeletal disorders: a systematic review of recent longitudinal studies. American Journal of Industrial Medicine, Volume 53, No. 3. de Freitas Cardoso, V., Stefane, C. A., de Barros, F. C., Gonçalves, J. S.,
Figueiredo, L. C., de & Oliveira Sato, T. (2022) Influence of gender and age on musculoskeletal symptoms in white-collar and blue-collar workers: a cross- sectional study. International Journal of Occupational Saferty and Ergonomics, Volume 28, No. 4, pp. 2482–2491. Joanna Briggs Institute (JBI). (2017). Critical Appraisal Checklist for Analytical Cross Sectional Studies. https://jbi.global/sites/default/files/2019-05/JBI_Critical _Appraisal-Checklist_for_Analytical_Cross_Sectional_Studies2017_0.pdf Kilbom, A., & Messing, K. (1998) Work-related musculoskeletal disorders. Women’s
Health at Work, 203. Lee, C. H., Cook, S., Lee, J. S., & Han, B. (2016). Comparison of Two Meta-Analysis Methods: Inverse-Variance-Weighted Average and Weighted Sum of Z-Scores. Genomics Informatics, Volume 14, No. 4, pp. 173–180. Ma, J., Liu, W., Hunter, A., & Zhang, W. (2008) Performing meta-analysis
with incomplete statistical information in clinical trials. BMC Medical Research Methodology, Volume 8, No. 56.
The Influence of Gender/Sex on Work-Related Musculoskeletal Disorders 1501
Mantel, N., & Haenszel, W. (1959) Statistical aspects of the analysis of data from retrospective studies of disease. Journal of the National Cancer Institute, Volume 22, No. 4, pp. 719–748. Overstreet, D. S., Strath, L. J., Jordan, M., Jordan, I. A., Hobson, J. M., Owens, M.
A., Williams, A. C., Edwards, R. R., & Meints, S. M. (2023) A Brief Overview: Sex Differences in Prevalent Chronic Musculoskeletal Conditions. International Journal of Environmental Research and Public Health, Volume 20, No. 5, p. 4521. Punnett, L. & Herbert, R. (2000). Work-Related Musculoskeletal Disorders: Is There a Gender Differential, and if So, What Does It Mean? Elsevier eBooks pp. 474–492. Punnet, L., & Wegman, D. H. (2004). Work-related musculoskeletal disorders:
The epidemiological evidence and the debate. Journal of Electromyography and Kinesiology, Volume 14, No. 1, pp. 13–23. Roquelaure, Y., Ha, C., Rouillon, C., Fouquet, N., Leclerc, A., Descatha, A., Touranchet, A., Goldberg, M., … Imbernon, E. (2009). Risk factors for upper- extremity musculoskeletal disorders in the working population. Arthritis and Rheumatology, Volume 61, No. 10, pp. 1425–1434. Rosenthal, R. (1995). Writing meta-analytic reviews. Psychological Bulletin, Volume 118, No. 2, p. 183. Szumil as, M. (2010). Explaining odds ratios. Journal of the Canadian Academy of
Child and Adolescent Psychiatry, Volume 19, No. 3, p. 227. United States Bureau of Labor Statistics (US BLS). (2020) Fact Sheets: Occupational injuries and illnesses resulting in musculoskeletal disorders (MSDs). https://www. bls.gov/iif/factsheets/msds.htm. Viechtbauer, W. (2005). Bias and Efficiency of Meta-Analytic Variance Estimators
in the Random-Effects Model. Journal of Educational and Behavioral Statistics, Volume 30, No. 3, pp. 261–293. Yusuf, S., Peto, R., Lewis, J., Collins, R., & Sleight, P. (1985). Beta blockade during and after myocardial infarction: an overview of the randomized trials. Progress in Cardiovascular Diseases, Volume 27, No. 5, pp. 335–371.
LISTED IN THE AHFE DIGITAL BOOKSTORE CATALOGUE
Explore the complete digital volume
Human Factors in Design, Engineering, and Computing
Read this individual research paper free through the original publisher, or explore the full digital proceedings book.
ISBN 978-1-964867-35-9
Explore this ISBN in the AHFE Bookstore ↗Listed in the July 2026 bookstore catalogue; search by ISBN to confirm current availability · Digital book purchase optional