Tazim Ahmed, Jose Lopez, Soptorshi Rai, Yiran Yang, Mahmudur Rahman (2024). Simulator Sickness and Performance in AR vs VR: A Comparative Analysis Applied to Additive Manufacturing. In: Human Factors in Design, Engineering, and Computing. AHFE Open Access, vol. 159, pp. 1048–1057. https://doi.org/10.54941/ahfe1005671
Augmented Reality (AR) and Virtual Reality (VR) technologies are increasingly becoming integral to educational and training contexts, yet comparative analyses of their effects on simulator sickness and user experience remain limited. Recent advancements in AR/VR headsets, such as the Meta Quest 3, now allow virtual and augmented reality experiences to be delivered through a single device. However, previous research comparing user experiences between virtual and augmented reality did not account for the use of a unified headset in their investigation. This study aims to investigate the differential effects of AR and VR on users’ simulator sickness, engagement, mental workload, and performance, and usability of the training environment. A training module was developed in Unity 3D for both AR and VR focusing on 3D printing using a powder bed fusion (PBF) printer. A within-subject assignment of factors explored the comparison of ten participants’ experiences regarding simulation sickness and printing experiences and performances. Each participant went through the same tasks under simulated environments to explore the implications of AR and VR on user experience. The study found that there was no statistically significant difference in motivation and user experiences between AR and VR using Meta Quest 3. Moreover, the users experienced comparatively higher simulator sickness in VR than in AR. These findings will not only help to fill the gaps in comparative studies of AR and VR but will also help to inform future technological deployments in educational and professional training scenarios.
Augmented Reality (AR) and Virtual Reality (VR) are recent transformative technologies that connect the real and virtual worlds to provide users with full or partial immersive experiences while interacting with their surroundings. VR creates an entirely immersive simulated environment that
Simulator Sickness and Performance in AR vs VR: A Comparative Analysis Applied 1049
completely engages the user in a virtual setting (Marougkas et al., 2021). On the other hand, AR overlays digital information over the actual world to enhance a user’s perspective of their surroundings, which is not fully immersive (Carmigniani and Furht, 2011). In recent years, both AR and VR have become increasingly applied to training and education in a variety of disciplines (Al-Ansi et al., 2023; Tan et al., 2022). The interactive learning experiences provided by these technologies can greatly enhance the acquisition and retention of knowledge among learners. The application of AR and VR in production and manufacturing training is particularly noteworthy. With AR and VR, hands-on training experiences can be provided without the risks associated with real-world manufacturing high-risk and cost-expensive scenarios. Training and learning can be made safer and more efficient by having trainees interact with virtual models of equipment and processes. AR and VR have been implemented in training modules for various manufacturing and production tasks such as machine operation, maintenance procedures, and quality control, offering a controlled environment to master essential skills (Eswaran and Bahubalendruni, 2022). Moreover, recent studies have also shown that training on manufacturing tasks with the help of AR and VR can enhance learning outcomes, engagement, and motivation among trainees. For instance, a study by Abidi et al. (2019) found that VR-based training in manufacturing assembly is more effective and efficient, resulting in fewer errors and reduced training time compared to traditional methods. Similarly, Han et al. (2022) highlighted the benefits of using an AR-based assembly instruction app that significantly improved students’ task quality, speed, learning interest, and academic achievements in a mechanical assembly course compared to the traditional slide-based lectures.
However, extended use of AR and VR in training modules can lead to simulator sickness, a condition characterized by symptoms such as nausea, dizziness, and disorientation (Biswas et al., 2024; Vovk et al., 2018). This issue is particularly prevalent in prolonged training sessions. Du˙zma´nska et al. (2018) reviewed 39 articles on simulator sickness and found that symptom severity generally increases with VR exposure time, highlighting the need for cautious control and further research in VR development. Hussain et al. (2023) also found that the button size and object distance can be significant factors for simulator sickness in AR. However, the degree of simulator sickness between AR and VR might not be the same for the same amount of exposure. Additionally, the level of performance in AR and VR training can vary significantly because of several factors, such as the realism of the virtual environment, the complexity of the tasks, and the user’s prior experience with the technology. Therefore, to assess the efficacy of these platforms, it is crucial to thoroughly evaluate both performance and simulator sickness in AR and VR, particularly when using the same headset with comparable graphics quality.
Over the last decade, several studies have investigated simulator sickness and the level of performance among users in AR and VR training and games. Wang et al. (2022) developed a real-time predictive model for
simulator sickness in VR games using in-game characters’ movement and users’ eye motion data during gameplay. In another study, Wang et al. (2023) explored the impact of different frame rates on user experience, performance, and simulator sickness for two VR application scenarios. Elwardy et al. (2020) evaluated scenario quality and simulator sickness in 360
video streaming on an HTC Vive Pro HMD among users with varying levels of VR experience, using the modified absolute category rating with hidden reference (M-ACR-HR) method and a simulator sickness questionnaire (SSQ).
While a significant amount of study has been done on assessing simulator sickness and performance in AR and VR, the majority of studies examined these aspects separately. Therefore, there is a need for comprehensive research that simultaneously evaluates simulator sickness and performance within the same training module between AR and VR to understand the best practices for educational settings. Based on the above discussion, the current research has formulated the following research questions:
1. How does simulator sickness differ between AR and VR environments for students using the same additive manufacturing training module? 2. What is the comparative impact of AR and VR environments on student immersion, engagement, and mental workload? 3. Which training environment yields better usability and performance?
To answer these questions, the current research aims to evaluate simulator sickness and student experience surveys in the context of additive manufacturing training, comparing AR and VR environments. A training module on Powder Bed Fusion (PBF) 3D printing has been developed for both AR and VR environments. The study assesses simulator sickness and student experiences through standardized subjective tools, providing insights into the efficacy and challenges of using these technologies in additive manufacturing training.
METHOD
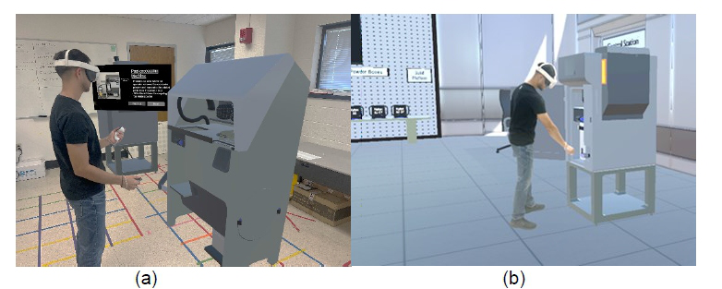
A virtual additive manufacturing lab with a setup for 3D printing with a Powder Bed Fusion (PBF) machine was created using the Unity game engine. All 3D models and animations were developed in Blender and imported into Unity as.fbx files. Participants experienced the lab in both VR and AR environments using a Meta Quest 3 VR headset. The training module included a preparation station with personal protective equipment, a powder storage unit, a build platform, a PBF 3D printer, and a post-processing machine. Figure 1 shows the virtual environments in AR and VR for the PBF 3D printing training module. The study received approval from the Institutional Review Board at the University of Texas at Arlington (UTA).
Simulator Sickness and Performance in AR vs VR: A Comparative Analysis Applied 1051
Figure 1: PBF 3D printing training module in (a) AR and (b) VR.
Participants Ten participants were recruited to experience both VR and AR training modules. The order of the training modules was randomized, with half of the participants experiencing the VR training first and the other half starting with the AR training. The participants were aged between 19 and 26 years (mean 22.1 years and SD 2.18) with 7 males and 3 females. They were undergraduate students in Industrial, Mechanical, or Aerospace Engineering to have basic knowledge of 3D printing. Among the ten participants, eight participants had past experience with VR, and six participants had past experience with AR. Three participants were Hispanic, five participants were Asian, and two were Caucasian. Three participants had received formal training on the additive manufacturing process, and all the participants had adequate knowledge about the 3D printing process.
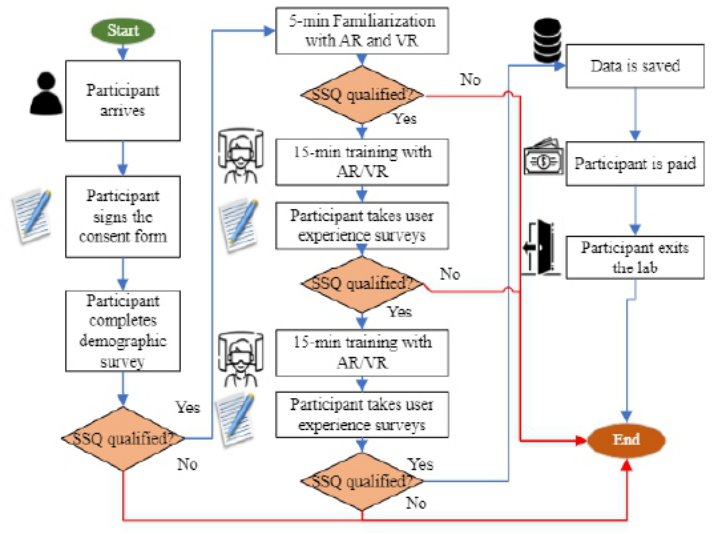
Experimental Procedure Upon arrival at the Human Factors Lab in the University of Texas at Arlington, participants signed the consent form after reading it carefully. Then, each participant was assigned an identification number and was asked to take a demographic survey and respond to the simulation sickness questionnaire (SSQ, Kennedy et al., 1993). At any point of participation, if a participant scored 5 or more on the SSQ, s/he was not allowed to continue the study. The identification number decided the training type to start with in order to ensure the randomization of AV/VR module assignments. The participants were then familiarized with VR or AR environments (different from the study environments) to understand how to navigate and interact during the experiment. Following this first exposure, they took the SSQ survey again to confirm their fitness for study continuation. Then, they completed the training using AR or VR headsets according to their random assignment. Once they completed one training, they took a 10-minute break to respond to experience surveys, including SSQ. Only qualified participants were allowed to continue with the study. After completing each training, participants filled out the Presence Questionnaire (PQ, Witmer et al., 1998)
for their immersion experience, the System Usability Scale (SUS, Brooke, 1996) for the usability of the training environment, the student engagement survey (Skinner and Belmont, 1993), and the mental workload using NASA-TLX (Hart and Staveland, 1988). The survey responses during the learning process were collected for both modules to be compared. Figure 2 shows the experimental procedure for the study for better illustration. Throughout the experiment, participants encountered instructional screens and quizzes to reinforce their understanding and ensure they followed the procedural steps accurately. This structured approach allowed for a thorough comparison of the impacts of AR and VR on simulator sickness and users’ immersion and system usability experiences, engagement, workload, and performance in a controlled setting.
Figure 2: Experimental procedure of the current study.
Data Analysis In the study, SSQ was administered 4 times: at the beginning (T0), after the familiarization exposure (T1), after the first training (T2), and after the second training (T3). A repeated measure ANOVA was performed to see the effect of exposure duration on users’ simulation sickness. Other survey responses were compared using paired t-tests for itemized scores and for standardized subscale scores. This comprehensive approach provided insights into the discomfort, performance, and immersion levels experienced by participants in AR and VR settings.
Simulator Sickness and Performance in AR vs VR: A Comparative Analysis Applied 1053
RESULTS
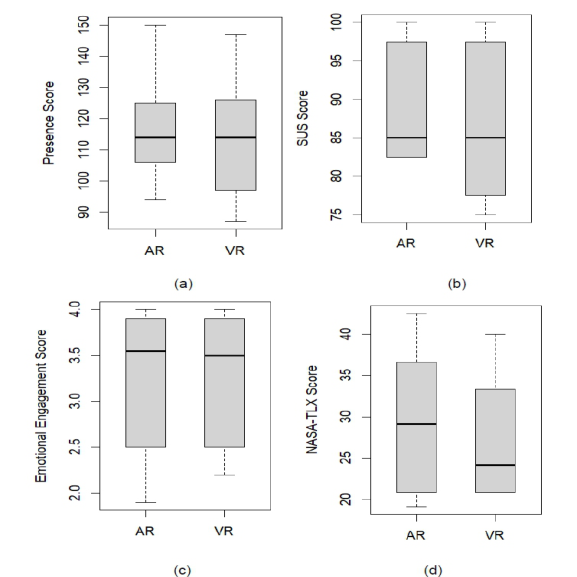
The paired t-tests were performed to compare AR and VR platforms in terms of overall presence scores (p-value = 0.621), overall system usability scores (p-value = 0.554), overall emotional engagement scores (p-value = 0.513), and overall mental workload scores (p-value = 0.492). Results indicated no statistically significant difference between these two environments. Paired t-testswere also performed to compare participants’ responses to the itemized scores of the presence questionnaire and SUS. There were no statistically significant differences in the quality of the interface, ease of act, self-evaluated performances, and acknowledging and differentiating sound cues. However, evidence of a significant difference was found in the perception of realism between AR and VR. The mean realism score for AR (43.1) was greater than the mean realism score for VR (38.3). In order to further explore the differences between these two virtual environments, boxplots for each metric have been compared (see Figure 3).
Figure 3(a) shows that the median presence score for both AR and VR is similar. This indicates that users have experienced a similar sense of presence in both AR and VR environments. Similarly, Figures 3(b) and 3(c) show that the median scores of the SUS and emotional engagement for AR and VR are similar. However, the mean SUS score for AR is slightly higher than the mean SUS score for VR, indicating that users found the AR training module to some extent more usable than the VR module. Finally, from Figure 3(d), the NASA-TLX median score for AR is slightly higher than VR. This indicates that users have found the AR training module more mentally demanding than the VR module. In the AR training module, users could see the other objects along with the animated items. This might cause distraction which might lead to increased mental workload than VR. In the VR training module, the virtual environment is fully immersive. This helps the users focus on the tasks more attentively.
Nine questions related to the additive manufacturing processes in AR and VR were asked to compare user performance. Users answered 53% correctly on average in VR, while they answered 49% correctly on average in AR. This also indicates that users can learn more attentively in VR compared to AR. There was no significant difference in their performance.
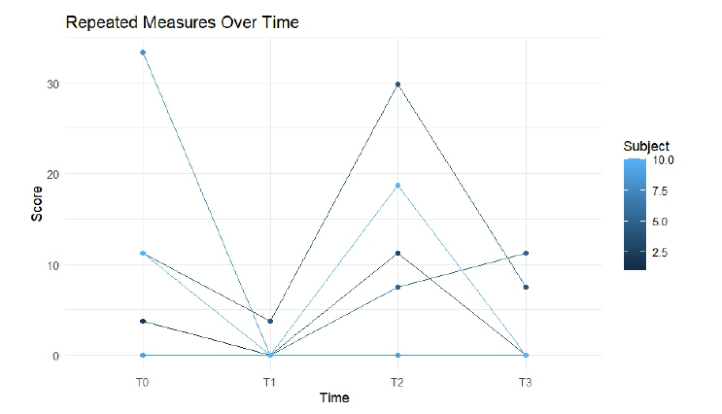
This study has also compared the average simulation sickness scores between the AR and VR. The mean SSQ scores are almost similar between these two environments. This study has deployed both AR and VR in the same head-mounted headset (Meta Quest 3) and the simulation sickness was not found to be significantly different. Figure 4 shows the repeated measures ANOVA of simulation sickness scores across different time points. The results from repeated measure ANOVA indicate that there is no significant effect of time on simulation sickness scores, as evidenced by the p-value of 0.868. The total duration of immersive exposure for each participant was around 13 minutes. This low exposure time might be the reason for no significant effect on simulation sickness.
Figure 3: Boxplot comparison of (a) presence scores, (b) SUS scores, (c) emotional engagement scores, and (d) NASA-TLX scores between AR and VR.Figure 4: Repeated measures ANOVA of simulation sickness scores across different time points.
Simulator Sickness and Performance in AR vs VR: A Comparative Analysis Applied 1055
DISCUSSIONS The current study explored various aspects of user experience in AR and VR environments, including presence, usability, emotional engagement, and workload, alongside a comparative analysis of simulation sickness between the two environments. Summarizing the results from the analysis, two points are apparent: (i) The paired t-tests conducted for these factors revealed no statistically significant differences between AR and VR, suggesting that both environments offer similar user experiences in these domains, and (ii) the user experienced higher levels of simulation sickness in VR compared to AR.
While the statistical analysis did not show significant differences, the mean scores provided insights into user experience variations between the two environments. VR caused higher simulator sickness than AR, likely due to its immersive nature, which can create sensory conflicts. Despite this, VR provided a stronger sense of presence and emotional engagement, making users feel more connected and immersed, particularly during learning about emerging technologies like 3D printing. Both AR and VR scored similarly on usability, indicating that users found both environments easy to interact with without further technical support. Notably, AR resulted in a higher mental workload compared to VR, likely because it requires users to integrate both real-world and virtual elements simultaneously. The low performance scores may be due to a lack of basic instructions on 3D printing procedures before trainee assessment. The reduced mental workload associated with using VR for tasks and answering questions likely contributed to the higher scores achieved in the VR setting. These findings suggest that while VR excels in creating immersive experiences, AR may be more suitable for applications requiring lower cognitive load and less sensory discomfort. These results align with previous research that highlighted the potential for increased simulator sickness in fully immersive VR environments (Pettijohn et al., 2020). The enhanced presence and emotional engagement observed in VR are consistent with Flavián et al. (2021), who demonstrated VR’s effectiveness in engaging users emotionally.
The results of this study have some implications for future studies. VR may be more effective in scenarios where a high level of immersion and emotional engagement is necessary to enhance learning or simulate real- world experiences. In contrast, AR could be preferable for tasks that benefit from contextual interaction with real-world elements, provided that the higher mental workload can be managed effectively. Additionally, this study highlights the need for user interface design improvements in VR to reduce simulator sickness and enhance the overall experience. Both technologies have their unique advantages, and their effectiveness can be maximized by carefully aligning their use with the intended educational or training objectives. Future studies should also explore personalized adaptations in AR and VR to cater to individual user preferences and capabilities, potentially improving user satisfaction and learning outcomes. Overall, these results indicate that both AR and VR offer valuable experiences depending on the context of use, each with its strengths.
CONCLUSION
This study has compared user experiences in AR and VR environments, focusing on factors such as presence, usability, emotional engagement, mental workload, and simulation sickness. The main findings indicated that while there were no statistically significant differences between AR and VR in most aspects, mean scores showed that VR caused higher simulator sickness but offered greater presence and emotional engagement. Both environments had similar usability ratings, suggesting users found them equally easy to navigate. AR, however, resulted in a higher mental workload, likely due to the simultaneous processing of real-world and virtual information. These results suggest that VR may be more suitable for tasks requiring high immersion and emotional connection, while AR may be preferable for applications where interaction with the real world is beneficial, provided that the mental workload is managed with fewer distractions.
Despite providing valuable insights, this study has some limitations. The sample size was relatively small, which may limit the generalization of the findings. Future research should involve a larger and more diverse participant pool to validate these results and further explore the differences between AR and VR environments. Additionally, it would be beneficial to examine the long-term effects of using AR and VR, particularly concerning simulator sickness and cognitive load. Future studies could also explore personalized AR and VR experiences to accommodate individual user needs and preferences, enhancing overall satisfaction and effectiveness in various educational and training contexts.
ACKNOWLEDGMENT
This material is based upon work supported by the National Science Foundation under Grant No. 2202598.
REFERENCES
Abidi, M. H., Al-Ahmari, A., Ahmad, A., Ameen, W. and Alkhalefah, H., 2019.
Assessment of virtual reality-based manufacturing assembly training system. The International Journal of Advanced Manufacturing Technology, 105(9), pp. 3743–3759. Al-Ansi, A. M., Jaboob, M., Garad, A. and Al-Ansi, A., 2023. Analyzing augmented reality (AR) and virtual reality (VR) recent development in education. Social Sciences & Humanities Open, 8(1), p. 100532. Biswas, N., Mukherjee, A. and Bhattacharya, S., 2024. “Are you feeling sick?” A
systematic literature review of cybersickness in virtual reality. ACM Computing Surveys. Brooke, J., 1996. SUS: A “quick and dirty” Usability Scale. Usability Evaluation in INdustry/Taylor and Francis. Carmigniani, J. and Furht, B., 2011. Augmented reality: an overview. Handbook of
augmented reality, pp. 3–46. Du˙zma´nska, N., Strojny, P. and Strojny, A., 2018. Can simulator sickness be avoided?
A review on temporal aspects of simulator sickness. Frontiers in psychology, 9, p. 2132.
Simulator Sickness and Performance in AR vs VR: A Comparative Analysis Applied 1057
Elwardy, M., Zepernick, H. J., Hu, Y., Chu, T. M. C. and Sundstedt, V., 2020, March.
Evaluation of simulator sickness for 360 videos on an hmd subject to participants’ experience with virtual reality. In 2020 IEEE conference on virtual reality and 3D user interfaces abstracts and workshops (VRW) (pp. 477–484). IEEE. Eswaran, M. and Bahubalendruni, M. R., 2022. Challenges and opportunities on AR/VR technologies for manufacturing systems in the context of industry 4.0: A state of the art review. Journal of Manufacturing Systems, 65, pp. 260–278. Flavián, C., Ibáñez-Sánchez, S. and Orús, C., 2021. Impacts of technological
embodiment through virtual reality on potential guests’ emotions and engagement. Journal of Hospitality Marketing & Management, 30(1), pp. 1–20. Han, P. F., Zhao, F. K. and Zhao, G., 2022. Using augmented reality to improve learning efficacy in a mechanical assembly course. IEEE Transactions on Learning Technologies, 15(2), pp. 279–289. Hart, S. G. and Staveland, L. E., 1988. Development of NASA-TLX (Task Load
Index): Results of empirical and theoretical research. In Advances in psychology (Vol. 52, pp. 139–183). North-Holland. Hussain, M., Park, J. and Kim, H. K., 2023. Augmented reality sickness questionnaire (ARSQ): A refined questionnaire for augmented reality environment. International Journal of Industrial Ergonomics, 97, p. 103495. Kennedy, R. S., Lane, N. E., Berbaum, K. S. and Lilienthal, M. G., 1993. Simulator
sickness questionnaire: An enhanced method for quantifying simulator sickness. The international journal of aviation psychology, 3(3), pp. 203–220. Marougkas, A., Troussas, C., Krouska, A. and Sgouropoulou, C., 2021. A framework for personalized fully immersive virtual reality learning environments with gamified design in education. In Novelties in Intelligent Digital Systems (pp. 95–104). IOS Press. Pettijohn, K. A., Peltier, C., Lukos, J. R., Norris, J. N. and Biggs, A. T., 2020.
Virtual and augmented reality in a simulated naval engagement: Preliminary comparisons of simulator sickness and human performance. Applied ergonomics, 89, p. 103200. Skinner, E. A. and Belmont, M. J., 1993. Motivation in the classroom: Reciprocal effects of teacher behavior and student engagement across the school year. Journal of educational psychology, 85(4), p. 571. Tan, Y., Xu, W., Li, S. and Chen, K., 2022. Augmented and virtual reality (AR/VR)
for education and training in the AEC industry: A systematic review of research and applications. Buildings, 12(10), p. 1529. Vovk, A., Wild, F., Guest, W. and Kuula, T., 2018, April. Simulator sickness in augmented reality training using the Microsoft HoloLens. In Proceedings of the 2018 CHI conference on human factors in computing systems (pp. 1–9). Wang, J., Liang, H. N., Monteiro, D., Xu, W. and Xiao, J., 2022. Real-time prediction
of simulator sickness in virtual reality games. IEEE Transactions on Games, 15(2), pp. 252–261. Wang, J., Shi, R., Zheng, W., Xie, W., Kao, D. and Liang, H. N., 2023. Effect of frame rate on user experience, performance, and simulator sickness in virtual reality. IEEE Transactions on Visualization and Computer Graphics, 29(5), pp. 2478–2488. Witmer, B. G. and Singer, M. J., 1998. Measuring presence in virtual environments:
A presence questionnaire. Presence, 7(3), pp. 225–240.
LISTED IN THE AHFE DIGITAL BOOKSTORE CATALOGUE
Explore the complete digital volume
Human Factors in Design, Engineering, and Computing
Read this individual research paper free through the original publisher, or explore the full digital proceedings book.
ISBN 978-1-964867-35-9
Explore this ISBN in the AHFE Bookstore ↗Listed in the July 2026 bookstore catalogue; search by ISBN to confirm current availability · Digital book purchase optional