Chen Zimo, Feng Hailong, Li Yajun (2024). A Front Face Design of New Energy Vehicles Based on Rough Set Theory and Backpropagation Neural Network. In: Kansei Engineering. AHFE Open Access, vol. 145, pp. 67–77. https://doi.org/10.54941/ahfe1005142
With the increasing awareness of environmental protection and prominent problem of traditional energy, new energy vehicles are an important choice to replace traditional oil-fueled vehicles. As an important part of new energy vehicles, the design of front face has an important impact on vehicles’ image, sales, and brand awareness. A front face’s modeling design process of new energy vehicles is proposed in this paper based on Kansei Engineering (KE)/ Rough Set Theory (RST)/ Backpropagation Neural Network (BPNN). Firstly, Kansei semantic analysis is carried out on the front face’s modeling of new energy vehicles, including collecting the front face samples of new energy vehicles and Kansei semantic words, the collected Kansei semantic words are reduced dimensional and clustered by using Factor Analysis (FA). Secondly, the morphological analysis method is used to decompose the front face samples of new energy vehicles into different design features, the attribute reduction algorithm in RST is used to identify the key design features of new energy vehicles that have an important impact on users’ satisfaction. Finally, BPNN is used to establish the mapping model between the users’ Kansei image and the key design features of new energy vehicles’ front face, thus obtaining the optimal design combination of new energy vehicles’ front face with the highest Kansei value. The results enable designers to grasp users’ sentimental cognition of new energy vehicles’ front face modeling effectively and accurately so as to improve users’ purchase desire. This method can provide references for the modeling design of related products.
With the increasingly serious environmental problems and energy crisis, many countries such as Japan and the United Kingdom have announced that they will ban the sale of internal combustion engine vehicles in the next 20 years and they have carried out policies to support the development of NEV and committed to promoting the green transformation of the automo- bile industry through technological innovation and industrial upgrading (Wu, Duan, Cui, & Qin, 2023). Under this background, NEV is rapidly occupy- ing the stage of urban transportation with its advantages of low emissions, environmental protection and energy saving. New energy power is not only a technological change, but also redefines the possibilities and boundaries of automotive styling. At the same time, the era of sensibility consumption has
promoted the improvement of aesthetic emotional needs in automobile mod- eling design. This trend is especially evident in the NEV design. The design of cars’ front face is not only the identity of the brand, but also determined the users’ first impression on the car, which drives the design innovation and brand differentiation. Meanwhile, it also has an important impact on consumer purchasing decisions.
In the existing researches, Helander et al. (Helander, Khalid, Lim, Peng & Yang, 2013) made researches on the emotional intentions of car purchasers and designers. He et al. (He et al., 2023) explored the emotions’ impact on the intentions of purchasing electric vehicles. At the same time, in current researches, the methods of feature detection (Lee, Kim & Suk, 2022) and computer-aided design (Ostrosi, Bluntzer, Zhang & Stjepandi´c, 2019) are adopted to optimize the vehicles’ styling design process; but these researches have ignored the joint effect of satisfying the users’ emotional needs and opti- mizing the design method. In general, although scholars have carried out extensive researches in the field of automobile modeling, there are still short- comings in NEV, especially the modeling design methods that can meet the emotional needs of users.
In the study of users’ perception, KE is a translation technology that con- verts users’ perception intentions into products’ design specifications (Guo, Qu, Nagamachi & Duffy, 2020). The practical application of KE to the pro- duction of “sentimental products” began in the automotive industry and achieved great success (Nagamachi, 1991). As a result, the design process that combines KE, RST and BPNN provides a superior solution to the quan- tification of users’ emotional needs (Dereli, Baykasoglu, Altun, Durmusoglu & Türksen, 2011). Thanks to the progress of artificial intelligence technol- ogy, it repeatedly simulates the thinking process of human’s brain through simplified calculation rules, thus achieving a lower error rate and higher processing speed (Kang, 2020). RST proposed by Polish scholar, Pawlak in 1982 is a mathematical method especially used to deal with fuzzy, inaccurate and uncertain data. Its most significant advantage is that it can effectively simplify data attributes without relying on any external knowledge (Pawlak & Słowinski, 1994). BPNN stands out among many algorithms because of its excellent learning ability and prediction accuracy. In can not only learn and realize accurate classification judgment through effective training pro- cess, but also has powerful functions for fitting and predicting continuous variables so as to perform well in regression tasks (Woo, Luo, Lin & Chen, 2022). Therefore, by combining KE with RST and BPNN, the paper will explore how to meet the emotional needs and aesthetic expectations of consumers through NEV’s front face design in the era of sentimental consumption. Firstly, KE theory is used to analyze the sentimental intention of NEV’s front face and FA is used to cluster the Kansei words. Secondly, morphological analysis method is used to decompose samples of NEV’s front face into dif- ferent design features; the attribute reduction algorithm in RST is used to identify the key features that have an important impact on the satisfaction of users. Finally, BPNN is used to establish the mapping model between the Kan- sei semantics of users and key design features so that the design combination
A Front Face Design of New Energy Vehicles Based on Rough Set Theory 69
with the highest Kansei evaluation value is obtained, ultimately obtaining the optimal design combination of NEV’s front face.
KANSEI SEMANTIC STUDY OF NEVS’ FRONT FACE Determination of Representative Products
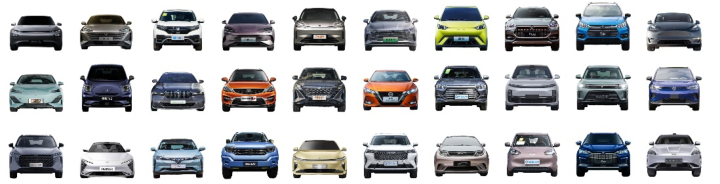
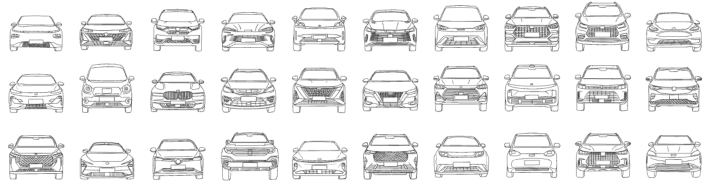
In this study, the front faces of NEV are selected as samples and 60 samples that meet the scope of the study are extensively collected through automobile magazines and design websites. In order to avoid the bias caused by users’ fixed preferences for automobile brands, a total of 30 representative NEV’s front faces are selected after discussion by the research team (Figure 1). In order to reduce the impact of background and color on subjects’ visual per- ception, all samples are drawn into wire frames using PHOTOSHOP and a NEV’s front face database is established (Figure 2) for further analysis.
Figure 1: 30 representative NEVs’ front faces.Figure 2: Wireframe of 30 representative NEVs’ front faces.
FA to Cluster Kansei Words in NEVs’ Front Faces By researching literatures and websites related to NEV, the research team initially select 9 Kansei words, as shown in Table 1. In this study, FA is used to reduce the dimension of Kansei words. Firstly, 30 designers conduct 9 evaluations of Kansei semantics and import the data into SPSS software for dimensionality reduction and cluster analysis. KMO and Bartlett Sphericity are carried out for factor analysis, thus observing whether the data is suitable for factor analysis. The experimental results are shown in Table 2. The value of KMO is 0794 (when the value of KMO>0.7, the experimental data is suitable for factor analysis); the approximate value is 123.919; the degree of freedom is 36; the Bartlett sphericity test is 0.000<0.05, showing significant
differences. In summary, KMO and Bartlett sphericity tests prove that this data is suitable for factor analysis.
Table 1. Nine initial kansei words.
Table available in the original PDF paper.
Dynamic Future Unique Delicate High-End Modern Gorgeous Sharp Smooth
Table 2. KMO and bartlett’s test.
Table available in the original PDF paper.
Kaiser-Meyer-Olkin Measure of Sampling Adequacy 0.794 Bartlett’s Test of Sphericity Appro. Chi-Square 123.919 df 36 Sig. 0
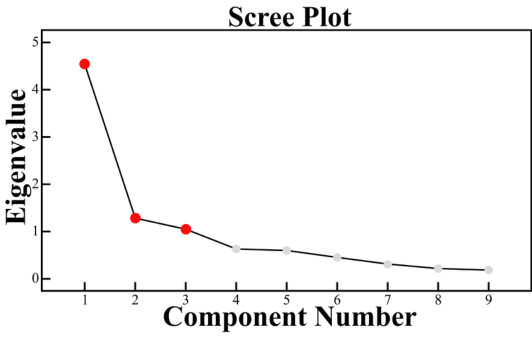
The factor lithotripsy diagram (Figure 3) shows three factors greater than 1. In the total variance interpretation (Table 3), the accumulative contribu- tion rate of the first three indicators is 74.838%. Although the cumulative contribution of this result is lower than the generally recommended 85% threshold, we examine the factor load matrix after orthogonal rotation and the component score coefficient matrix (Table 4); It is found that the variable load is higher on each factor, suggesting that these factors can well explain the associations among these variables. Secondly, we have carefully explained and studied each factor and found that they are interpretable and inherently consistent. In summary, the 9 terms can be reduced to 3 main factors. The first factor is composed of four indicators: future, high-end, modern and gor- geous, which is named as Progressive factor. The second factor is composed of three indicators: unique, delicate and sharp, which is named Streamline. The third factor is composed of two indicators: dynamic and smooth, which is named as Dynamic factor.
Figure 3: Factor lithotripsy diagram.
A Front Face Design of New Energy Vehicles Based on Rough Set Theory 71
Table 3. Total variance explained.
Table available in the original PDF paper.
IE Sum of Squared Loadings Sum of Squared Rotated Loadings Sum Var./% Cum./% Sum Var./% Cum./% Sum Var./% Cum./%
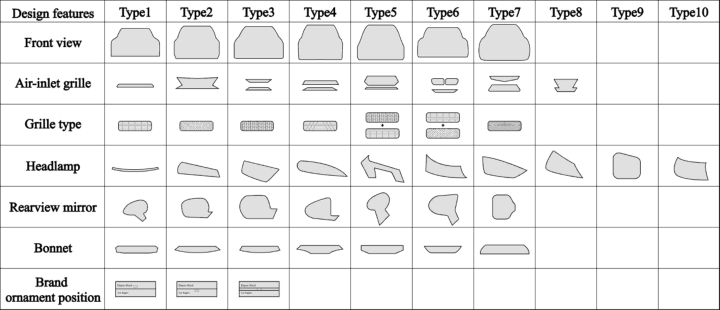
RST TO IDENTIFY THE KEY DESIGN FEATURES OF NEV ‘ S FRONT FACES Morphological analysis method is used to decompose the appearance of 30 samples into 7 design features, which are respectively front view, air-inlet grille, grille type, headlamp, rearview mirror, bonnet and brand ornament position. Each design feature is further subdivided into 49 types, as shown in Figure 4.
Since each design feature of the NEV’s front face has a different importance in influencing the satisfaction of users, design features with no impact may lead to inaccurate subsequent conclusions. Therefore, the attribute reduction algorithm is used in this study to extract key design features. The conditional attribute Cn of RST is set as seven design features respectively; the decision attribute D is the satisfaction of users. In the RST attribute reduction algo- rithm, the weight of the conditional attribute index is 0, indicating that the conditional attribute has no influence on the decision attribute in the reduc- tion process, namely the conditional attribute with weight 0 can be removed from the decision table. The following is a brief description of the calculation process.
Figure 4: From deconstruction table.
U, A, V, f
Equation reproduced from the original PDF.
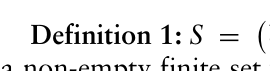
is an important system where U represents a non-empty finite set whose elements are called samples; A is a non-empty attribute set representing sample design features, A = C ∪D, A = C ∩ D̸ = ∅; C is the conditional attribute set; D is the decision attribute set; V represents the value field of the attribute; f is called a conditional attribute function, representing the value of A for each object in U.
Definition 2: Let R be the equivalence relation on U, which can be seen in formula 1; the equivalence type of conditional attribute is U/IND; the equivalence type of decision attribute is U/IND; Under the condition of not considering the specific conditional attributes or fields, Equivalence classes are divided according to the original feature set: U/Ind (C −{ce}) IND(R) = {(x, y) ∈U × U|∀a ∈A, f(x, a) = f(y, a)} (1)
Definition 3: The dependence degree of the decision attribute D on the con- ditional attribute C is rc (D); the dependence degree of the decision attribute D on knowledge C −{ce} is rc−|ce| (D). The importance of the conditional attribute to the decision attribute is σ (ce), which can be seen in formula (2) σ (ce) = rc(D) −rc−|ce|(D) (2)
Definition 4: The weight of conditional attribute index is We, which can be seen in formula (3).
We = σ (ce) Pn
λ = 1 σ (cλ) (3) A total of 100 subjects (50 males and 50 females with more than 3 years of driving experiences) are selected to evaluate the satisfaction of 30 samples in the sample park of Figure 2 and 78 design types of Figure 3. The research team use the equidistant division method to discretize the collected data. The Matlab software is applied to RST attribute reduction algorithm to identify the key design features that have an important impact on the satisfaction of users. The results are as follows:
A Front Face Design of New Energy Vehicles Based on Rough Set Theory 73
Firstly, the data in the table is divided into equivalence classes based on conditional attributes (design characteristics) and decision attributes (the satisfaction of users): U/IND (D) ={(1,2,6,7,8,9,11,17,18,19,20,21,22), (3,4,5,10,12,13,15,16, 23,24,25,26,28), (14,30)} U/IND (C) ={(1), (2), (3), (4,5,17), (6), (7), (8), (9,29), (10), (11), (12), (13), (14), (15), (16), (18), (19,27), (20), (21), (22,25), (24), (26), (28), (30)}
The conditional attributes (design features) are respectively removed; the equivalence classes of the fields are divided as follows.
=0, σ c7 =4/30 According to formula (3): w1 =0.1538,w2 =0.0769,w3 =0.1538,w4 =0.3077,w5 =0,w6 =0, w7 =0.3077
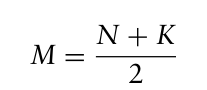
BPNN TO BUILD MAPPING MODEL BETWEEN KANSEI SEMANTICS AND KEY FEATURES OF NEVS’ FRONT FACES Artificial neural network model is the most typical in nonlinear regression analysis; BPNN is widely used in the field of products’ optimization design, because it can learn and store a large number of input and output mapping relationships. BPNN is a multi-layer feedforward neural network trained by error backpropagation algorithm. The structure of BPNN model is shown in Figure 4. It is very suitable for establishing the mapping relationship between users’ emotional needs and products’ design. Therefore, BPNN used in this paper is to construct the mapping relationship between users’ Kansei inten- tion and the features of key design. The training process includes two forms: forward propagation and back propagation. BPNN includes input layer, out- put layer and hidden layer. N is the number of nodes in the input layer (the number of design features); K is the number of nodes in the output layer (the number of Kansei words); M is the number of nodes in the hidden layer, as shown in formula (4).
Equation reproduced from the original PDF.
2 (4)
Firstly, 100 subjects (the same as some subjects in the rough set the- ory) evaluate the Kansei semantics of the three Kansei words “aggressive”, “streamlined” and “dynamic” based on 30 samples. Secondly, the research team classify the design features of 30 samples and construct a matrix of Kansei semantics evaluation and key design features, as shown in Table 5.
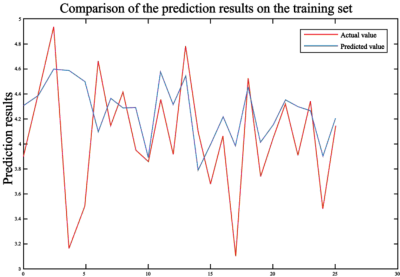
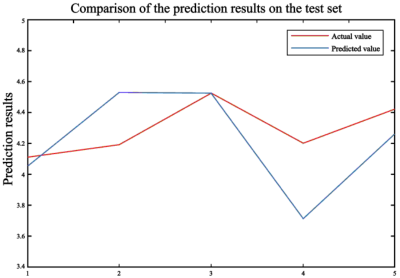
Based on the Matlab software platform, the BPNN model is constructed by using the data in Table 6. Just take the Kansei word “advanced” as an example, the number of nodes in the input layer is 5 key design features; the number of nodes in the output layer is 1 of Kansei word “advanced”. So the number of nodes in the hidden layer is 3 according to formula (4). The schematic diagram of the neural network in this study is shown in Figure 5. The first 25 samples are input into the BPNN neural network as a training set. After several training (the learning time is set as 1000 times; the error threshold is set to 1e-6 and the learning rate is set to 0.1). The training will be stopped when the training target is researched, as shown in Figure 6. The last five samples in Table 5 are used to test the reliability of the network after training and the results are shown in Figure 6. It can be seen that the rela- tive error between the average value of users’ actual Kansei evaluation and network prediction evaluation is less than 5%, indicating that the research model is well evaluated and meets the experimental expectations.
Five key design features are obtained by rough set theory. Each design fea- ture has the three categories of 7,8,7,10,3 respectively. Therefore, there are totally 7×8×7×10×3=11760 kinds of design schemes. All combinations are coded in decimal; as the input layer parameters of BPNN, the Kansei evalua- tion value corresponding to each scheme is calculated. Through calculation, the combination of design features corresponding to the maximum Kansei evaluation value is the optimal combination corresponding to each Kansei words, thus providing a certain reference standard for the design of NEV’s front face.
Figure 5: Fitting graph of training set and test set.Figure 6: The error in the test set.
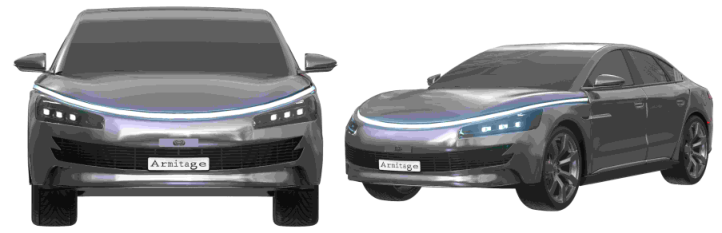
In order to verify the effectiveness of this method, the research team takes the experimental result of the Kansei word “advanced” as a reference; its Kansei evaluation reaches a maximum value of 4.74 corresponding to the input layer code of 18113. Namely, in the form deconstruction table, the front view 1, grille shape 8, grille type 1, headlamp 1 and brand ornament position 3 are selected. Based on the above results, the research team use CINEMA software to design a new NEV scheme for the NEV’s front face, as shown in Figure 7. A total of 100 subjects (50 males and 50 females with more than 3 years of driving experience) are invited to perform user satis- faction evaluation and kansei semantics evaluation on the new scheme of the NEV’s front face. The results show that the mean value of user satisfaction evaluation score is 4.37, which is higher than the mean of score of 3.5. The mean value of the subjects’ evaluation score is taken as the kansei semantics score, with an average score of 5.83, which is significantly higher than the Kansei evaluation value predicted by BPNN of 4.47 points. The effectiveness and feasibility of the proposed combination method are fully proved.
Figure 7: 3D models of NEV.
CONCLUSION
In this study, KE and artificial intelligence technology are combined to design products that meet the emotional needs of users. Firstly, KE theory is used to collect the Kansei intention evaluation of NEV’s front face; FA is used to extract three representative Kansei words. Secondly, RST attribute reduction algorithm is used to extract the key design features that have a high impact on the satisfaction of users. Finally, BPNN is used to construct the mapping model of the Kansei semantics of users and key design features; the optimal design combination of NEV’s front face that meets the Kansei requirements of users is obtained. Based on the above results, the research team designs a new scheme of NEV’s front face and verifies the effectiveness of the com- bined approach through the Kansei semantics evaluation of the new scheme by consumers. This study aims to provide designers with parameter guidance based on the emotional needs of users at the early stage of NEV develop- ment, improve the satisfaction of consumers and effectively reduce the risk of product development failure.
A Front Face Design of New Energy Vehicles Based on Rough Set Theory 77
REFERENCES
Dereli, T., Baykasoglu, A., Altun, K., Durmusoglu, A., & Türksen, I. B. (2011). Industrial applications of type-2 fuzzy sets and systems: A concise review. Computers in industry, 62(2), 125–137. Guo, F., Qu, Q.-X., Nagamachi, M., & Duffy, V. G. (2020). A proposal of the event-
related potential method to effectively identify kansei words for assessing product design features in kansei engineering research. International Journal of Industrial Ergonomics, 76, 102940. He, Z., Zhou, Y., Wang, J., Shen, W., Li, W., & Lu, W. (2023). Influence of emotion on purchase intention of electric vehicles: a comparative study of consumers with different income levels. Current Psychology, 42(25), 21704–21719. Helander, M. G., Khalid, H. M., Lim, T. Y., Peng, H., & Yang, X. (2013). Emotional
needs of car buyers and emotional intent of car designers. Theoretical Issues in Ergonomics Science, 14(5), 455–474. Kang, X. (2020). Combining grey relationship analysis and neural network to develop attractive automobile booth design. Computational Intelligence and Neuroscience, 2020. Lee, G., Kim, T., & Suk, H.-J. (2022). GP22: A Car Styling Dataset for Automotive
Designers. Paper presented at the Proceedings of the IEEE/CVF Conference on Computer Vision and Pattern Recognition. Nagamachi, M. (1991). An image technology expert system and its application to design consultation. International Journal of Human-Computer Interaction, 3(3), 267–279. Ostrosi, E., Bluntzer, J.-B., Zhang, Z., & Stjepandi´c, J. (2019). Car style-holon
recognition in computer-aided design. Journal of Computational Design and Engineering, 6(4), 719–738. Pawlak, Z., & Słowinski, R. (1994). Decision analysis using rough sets. International Transactions in Operational Research, 1(1), 107–114. Woo, J.-C., Luo, F., Lin, Z.-H., & Chen, Y.-T. (2022). Research on the sensory feeling
of product design for electric toothbrush based on kansei engineering and Back propagation neural network. Journal of Internet Technology, 23(4), 863–871. Wu, Z., Duan, C., Cui, Y., & Qin, R. (2023). Consumers’ attitudes toward lowcarbon consumption based on a computational model: Evidence from China. Technological Forecasting and Social Change, 186, 122119.
LISTED IN THE AHFE DIGITAL BOOKSTORE CATALOGUE
Explore the complete digital volume
Kansei Engineering
Read this individual research paper free through the original publisher, or explore the full digital proceedings book.
ISBN 978-1-964867-21-2
Explore this ISBN in the AHFE Bookstore ↗Listed in the July 2026 bookstore catalogue; search by ISBN to confirm current availability · Digital book purchase optional