Li Meihui, Meiyu Zhou (2026). Grey Relational Analysis of Bicycle Saddle Modeling Based on Kansei Engineering. In: Human Factors and Ergonomics In Design. AHFE Open Access, vol. 210, pp. 89–102. https://doi.org/10.54941/ahfe1007429
As cycling becomes increasingly popular, user expectations for bicycle saddles have evolved beyond basic functionality to more comprehensive perceptual comfort and aesthetic experience. However, there remains a lack of methodology for systematically translating users' subjective impressions of bicycle saddle form into practical design optimisation directions. This study is based on Kansei engineering theory and grey relational analysis , through sample collection, cluster analysis and expert evaluation, representative bicycle saddle samples and core perceptual vocabulary are selected, and the bicycle saddle form is further decomposed into quantifiable modeling elements. Subsequently, factor analysis is used to establish the relationship between modeling elements and core perceptual vocabulary, followed by grey relational analysis to determine the priority ranking of each modeling element under different perceptual vocabulary. The research findings provide a systematic, quantifiable basis for optimization design of bicycle saddle under different perceptual goals. This not only enhances the efficiency of bicycle saddle design but also ensures design outcomes better match users' diverse perceptual requirements.
In recent years, the concepts of healthy living and fitness have gained widespread acceptance. Among various sports, cycling has gradually attracted people’s attention and affection, evolving from a traditional way of commuting into a comprehensive sport that combines fitness, leisure and competition. During cycling, the bicycle saddle, as one of the pivotal components of human-bicycle interaction, not only supports the rider’s weight and stabilizes the riding posture, but also significantly influences the user’s comfort perception, emotional experience, and athletic performance through its form.
Current research on bicycle saddle design primarily focuses on two areas: ergonomics and material application. Ergonomic studies predominantly involve measuring and analysing physiological data, including pelvic bone distances and contact point data (Cheng et al., 2023), human joint displacement and electromyographic signals (Zhong et al., 2021), and human leg muscle force (Gao et al., 2016). Material application studies currently centre on the use of 3D printing, foam, carbon fiber, and other
90 Li and Zhou materials in bicycle saddles construction. As research on the functional aspects of bicycle saddles expands, some scholars have begun to pay attention to the user experience in terms of emotion and aesthetics, such as collecting subjective evaluations of users in different situations (Jo et al., 2017) or conducting multi-sensory experiments combining visual, tactile, and riding experiences to comprehensively assess users’ psychological feelings (Jo et al., 2020). Relevant studies have shown that visual perception often plays a dominant role in the formation of product emotional experience. Choudhury et al. (2014) found a significant correlation between interaction types (seeing, using) and product personality (e.g., lively). Desmet et al. (2008) argued that the visual appearance of an object has a greater impact on product personality (elegant, dominant) than its kinesthetic interaction. Furthermore, within the contemporary context of widespread online shopping, the appearance of a product often influences consumers’ purchasing decisions to a certain extent. However, from the perspective of existing research, there is still a relative lack of systematic studies on how the morphological element of bicycle saddles affect users’ aesthetic preferences and emotional imagery.
Kansei engineering, a methodology proposed by Professor Mitsuo Nagamachi of Hiroshima University in Japan during the 1970s, aims to enhance products or services by identifying product attributes and the relationships between these attributes and design features, thereby translating human emotional or psychological needs into product parameters (López et al., 2021). Grey Relational Analysis, introduced by Chinese scholar Deng Jilong in 1982, is based on the core idea of projecting system data into a geometric space and determining the degree of correlation between different sequences determined by the similarity of their sequence curve geometries (Lu et al., 2023). It is particularly suitable for dealing with small sample sizes, uncertainties, and incomplete information and has been widely applied in product design decision-making research.
At present, the combination of Kansei engineering and grey relational analysis is widely used in the research of product appearance design, such as VR head-mounted displays (Chen et al., 2025), football shoes (Han et al., 2022), and flying bridge yachts (Zhang et al., 2023). Most of the studies aim to establish a mapping relationship between user perception and product morphological elements through quantitative data, in order to determine the influence weights and importance rankings of morphological elements on user imagery. However, this method has been less applied in the research of bicycle saddle form design.
Therefore, this study focuses on the specific product of bicycle saddles and proposes a methodological framework that integrates Kansei engineering and grey relational analysis. By systematically decomposing and quantitatively analyzing the morphological elements of the bicycle saddles, a “product- semantic” mapping model is constructed to reveal the differences importance of various morphological elements of bicycle saddles under different Kansei image orientations, providing a scientific basis for targeted optimization of bicycle saddle appearance design.
Grey Relational Analysis of Bicycle Saddle 91 Research Process of Grey Relational Degree of Bicycle Saddle Form Based on Kansei Engineering
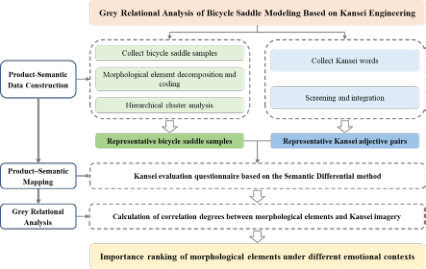
This study employs a “semantic–product” mapping framework to analyze the perceptual imagery of bicycle saddles from the perspective of morphological elements. The research consists of four main stages. First, a product space is constructed by collecting bicycle saddle samples and systematically decomposing and coding their appearance to establish a morphological element system, followed by cluster analysis to select representative samples. Second, a semantic space is developed by collecting and screening representative perceptual vocabulary describing saddle appearance. Third, a product–semantic mapping is established through semantic differential– based questionnaires to obtain users’ perceptual evaluation data. Finally, grey relational analysis is applied to quantify the correlation and importance ranking of morphological elements under different perceptual contexts, providing quantitative support for exterior design decisions (Figure 1).
Figure 1: Research process.
Product Data Construction Samples of commercially available adult sports bicycle saddles suitable for road and mountain biking were collected extensively from the official websites of well-known brands such as Specialized and Prologo, as well as relevant e-commerce platforms, to cover the main usage scenarios. To eliminate color- related interference in visual assessment, all sample images were uniformly processed using a top-down perspective and converted to greyscale. After screening, a total of 120 valid bicycle saddle samples were obtained.
Then, a focus group composed of three postgraduate students majoring in industrial design systematically disassembled the appearance features of the bicycle saddle samples based on the product morphology analysis method and relevant literature (Yao et al., 2024), with a focus on extracting the appearance features that have a more significant impact on visual perception and emotional judgment. Through multiple rounds of discussions, six primary morphological elements (S1 to S6) and 23 secondary categories (S1-1 to S6-4) were finally determined, forming a comprehensive bicycle saddle morphological element system (Table 1).
Table 1: Categories of morphological elements of bicycle saddles.
Table available in the original PDF paper.
Category Code
Morphological Element S1 S1-1 S1-2 S1-3 S1-4 S1-5
Overall form Long-nose Short-nose Split-nose front
To facilitate subsequent quantitative analysis, each morphological element was discretized and corresponding coding rules for morphological elements were established, converting the originally qualitative appearance features into discrete variables suitable for statistical analysis. By encoding the morphological elements of 120 samples one by one, the different saddle samples became comparable under a unified standard, providing basic data support for the subsequent cluster analysis and perceptual evaluation.
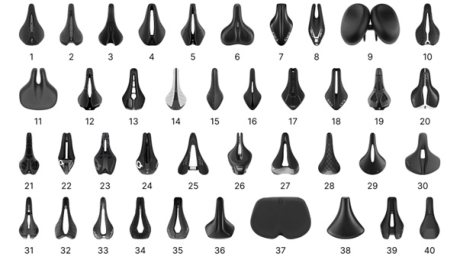
After completing the morphological element coding, to reduce the sample burden in the perceptual evaluation while ensuring the representativeness and objectivity of the research results, the Ward’s hierarchical clustering method was applied based on the morphological element coding results of the 120 bicycle saddle samples. This identified sample groups with similar morphological characteristics, ultimately resulting in 12 clusters. On this basis, considering the distribution of sample numbers and morphological difference features in each cluster, representative bicycle saddle samples were selected from different categories. Finally, 40 representative samples were selected (Figure 2).
Figure 2: Representative bicycle saddle samples.
Semantic Data Construction To reduce potential bias from single information sources, a multi-source strategy was adopted to collect Kansei vocabulary. Kansei words describing bicycle saddle appearance were gathered from cycling forums, e-commerce customer reviews, brand website descriptions, and relevant literature, resulting in an initial set of 192 terms. Based on the research objectives and product characteristics, a focus group further refined the vocabulary by merging synonyms, removing appearance-irrelevant terms, and forming antonym pairs. Finally, eight representative Kansei word pairs were selected to construct the emotional semantic space of bicycle saddle appearance (Table 2).
Table 2: Eight pairs of Kansei words.
Table available in the original PDF paper.
No. Kansei Words No. Kansei Words
1 Minimal-Ornate 5 Modern-Traditional
2 Streamlined-Angular 6 Sporty-Stable
3 Lightweight-Solid 7 Sharp-Soft
4 Refined-Rugged 8 Harmonious-Incongruous
Build Product-Semantic Mapping To obtain users’ subjective sensory perceptions of bicycle saddle aesthetics for the system, this study employed the Semantic Differential (SD) method based on sensory ergonomics theory. A sensory evaluation questionnaire was constructed using 40 representative bicycle saddle samples and 8 pairs of sensory adjectives. A 7-point Likert-type semantic differential scale was employed, with 0 as the neutral point and values ranging from “−3” to “+3” at either end, representing the extent to which participants inclined towards either end of the affective word pair. Following questionnaire distribution, participants were invited to subjectively evaluate the visual characteristics of bicycle saddles and complete the survey. A total of 35 valid responses were ultimately collected.
94 Li and Zhou Before conducting statistical analysis, it is necessary to test the reliability of the perceptual evaluation data. Cronbach’s α coefficient is currently often used to measure reliability takes values between 0 and 1. The closer the value is to 1, the better the reliability of the data. The analysis results show that the Cronbach’s α coefficient is 0.770, indicating that the scale has good internal consistency and stability, and meets reliability requirements for affective ergonomics research.
Building upon this established reliability, exploratory factor analysis was conducted on the 8 perceptual evaluation indicators to further reveal the internal structural relationships among the perceptual images of the bicycle saddle’s appearance. The Kaiser Meyer-Olkin (KMO) test is often used to check the partial correlations among variables, with values ranging from 0 to 1. The closer the KMO value is to 1, the stronger the partial correlations among the variables, and the better the factor analysis effect. The KMO test result was 0.813, and the Bartlett’s sphericity test result was significant (p < 0.001), indicating that there is a strong correlation among the variables and the data is suitable for factor analysis (Table 3).
Table 3: KMO and Bartlett’s test.
Table available in the original PDF paper.
KMO and Bartlett’s Test KMO value 0.813
Bartlett’s sphericity test Approximate chi-square 2821.184 df 28
P 0.000*** Note: ***, **, and * represent significance levels of 1%, 5%, and 10%, respectively.
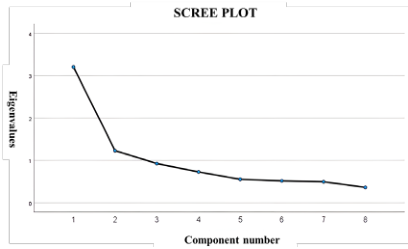
Factor extraction was conducted using Principal Component Analysis (PCA) to reduce the dimensionality of the perceptual evaluation data, and the factor structure was optimized by combining the Varimax rotation method. To ensure statistical validity while maintaining the integrity of the perceptual semantic dimensions, factor extraction was performed under a slightly relaxed eigenvalue threshold of 0.9, based on the scree plot (Figure 3) and eigenvalue magnitudes. Ultimately, three common factors were extracted, accounting for 66.94% of the cumulative variance, which can well reflect the main perceptual characteristics of the bicycle saddle’s appearance (Table 4).
Figure 3: Scree plot.Table 4: Total variance explained.
Table available in the original PDF paper.
Total Variance Explained Component Initial Eigenvalues Extraction Sums of Squared Loadings
Rotation Sums of Squared Loadings Cumulative % Total
Total % of Variance
Cumulative % Total % of Variance
1 3.205 40.058 40.058 3.205 40.058 40.058 2.276
2 1.228 15.346 55.404 1.228 15.346 55.404 1.910
3 .923 11.535 66.939 .923 11.535 66.939 1.169
4 .728 9.095 76.034
5 .552 6.894 82.928
6 .514 6.431 89.358
7 .493 6.158 95.516
8 .359 4.484 100.000
To provide a clearer interpretation of the common factors obtained during the analysis, the above data were rotated, and the resulting component matrix is shown in Table 5. The larger the absolute value of a common factor, the more representative it is. In the first factor, the value of “sharp-soft” is the largest. In the second factor, the value of “Harmonious-Incongruous” is the largest. And in the third factor, the value of “Minimal-Ornate” is the largest. Therefore, the three pairs of sensory words, “sharp-soft”, “Harmonious- Incongruous”, and “Minimal-Ornate”, were ultimately selected as the representative variables for the subsequent research.
Table 5: Rotated component matrix.
Table available in the original PDF paper.
Rotated Component Matrixa Component
1 2 3
Sharp-Soft .761 Sporty-Stable .725
Lightweight-Solid .693 Modern-Traditional .623
.757
Harmonious- Incongruous Streamlined-Angular .721
Refined-Rugged .511 .615 Minimal-Ornate .909
The core of grey relational analysis lies in transforming the original data into data curves and evaluating the degree of association by comparing the similarity of the geometric shapes of the curves. When the geometric shapes of different curves are more similar and their changing trends are more consistent, the association is stronger. Conversely, the association is weaker (Liu et al., 2018). By applying the grey relational analysis method, a mathematical model can be effectively established between morphological elements and Kansei words, thereby revealing the general laws between form and emotion.
Therefore, this study employed grey relational analysis to explore the connection between the design elements of bicycle saddles and their perceptual images. The mean scores of the three core perceptual word pairs, “Sharp-Soft”, “Harmonious-Incongruous”, and “Minimal-Ornate”, from the questionnaires, as well as the 40 corresponding sample morphological element categories, were integrated to obtain the final morphological element and perceptual evaluation scale as shown in Table 6.
Table 6: Morphological elements and sensory evaluation scale.
Table available in the original PDF paper.
No. Overall Form
Contour Style
Nose Shape
Tail Shape
Minimal- Ornate
Sharp- Soft
Harmonious- Incongruous
Cut-out Structure Form
Surface Texture Characteristics
1 2 2 4 2 2 2 –0.37 0.10 –0.16
2 2 2 4 2 2 3 –0.20 0.00 –0.06
3 2 2 1 3 2 3 –1.06 0.00 –0.63
4 2 2 3 3 2 2 –1.09 0.51 0.09
5 2 2 2 1 3 3 –0.60 –0.06 0.00
6 2 3 1 1 2 4 –0.63 1.20 –0.46
7 2 2 1 1 3 1 –0.57 0.29 0.29
8 3 1 2 1 1 1 –0.29 –0.51 0.23
9 5 3 1 1 1 4 0.00 0.63 1.00
… … … … … … … … … … Then, taking the semantic evaluations of the 40 samples corresponding to the three pairs of perceptual words as the reference sequences, and the morphological element codes of each sample as the comparison sequences, the subsequent grey relational analysis was conducted. Taking “Minimal- Ornate” as an example, the morphological element matrix M1 (Equation 1) of the bicycle saddle was obtained as:
Equations and mathematical formulas are available in the original paper PDF.
Grey Relational Analysis of Bicycle Saddle 97 [ ( ) = [Equation or mathematical symbol available in the original paper PDF] i ik M x k (2)
( ) ( ) ( ) ( ) = [Equation or mathematical symbol available in the original paper PDF][Equation or mathematical symbol available in the original paper PDF][Equation or mathematical symbol available in the original paper PDF][Equation or mathematical symbol available in the original paper PDF][Equation or mathematical symbol available in the original paper PDF] 1 , 2 , , i i i i x k x x x n (3) where: = ∈ = ∈ [Equation or mathematical symbol available in the original paper PDF][Equation or mathematical symbol available in the original paper PDF] 0,1,2, , , ; 1,2, , , . i m m N k n n N Respectively represent the rows and columns of the matrix.
( ) 0 x k the reference sequence, the corresponding pair of Kansei words is “Minimal-Ornate”. Additionally, there are m groups of morphological element sequences as comparison sequences, each containing 40 factors, which are used for grey relational analysis. Then, the matrix data is normalized to obtain the normalized matrix S1 (Equation 4), and its calculation formula is shown in Equation 5:
Equations and mathematical formulas are available in the original paper PDF.
(5)
( ) ( )
i i ik n
[ ] 1
( ) =
1
Equation available in the original PDF paper.
x k n
i k ik
The arithmetic mean method is used to calculate the average value in the formula. Then, subtract the reference sequence ( ) 0 x k from each row of the normalized matrix S and take the absolute value to obtain the difference sequence matrix Δ1 (Equation 6), and its calculation formula is shown in Equation 7.
Equations and mathematical formulas are available in the original paper PDF.
1 1
( ) ( ) ( ) ( )
[Equation or mathematical symbol available in the original paper PDF]
* * * * 1 0 1 0
(7)
[Equation or mathematical symbol available in the original paper PDF][Equation or mathematical symbol available in the original paper PDF][Equation or mathematical symbol available in the original paper PDF] x x x n x n ( ) ( ) ( ) ( ) [Equation or mathematical symbol available in the original paper PDF]
1 1 m m
* * * * 0 0
Equations and mathematical formulas are available in the original paper PDF.
98 Li and Zhou The obtained difference sequence matrix is further used to calculate the grey relational coefficient. The formula for the grey relational coefficient γ is defined as Equation 8:
( ) ( ) ( )
Equations and mathematical formulas are available in the original paper PDF.
i max x k x k k (8) ( ) ( ) ∆ = − * * 0 max i i k maxmax x k x k (9)
( ) ( ) ∆ = − * * 0 min i i k minmin x k x k (10) ( ) ( ) ( ) ∆ = − * * 0 0 i i k x k x k (11)
Where: ξ is the resolution coefficient, and ξ is generally recommended to be set at 0.5 (Deng. 1989). The core function of the resolution coefficient is to adjust the degree of comparison between two objects, and its value can be reasonably adjusted according to actual needs. The grey relational coefficient γ represents the degree of correlation between the reference sequence and each comparison sequence, and its range is: ( ) ( ) ( ) γ ≤ ≤ 0 0 , 1 i x k x k .0, obtaining the grey relational coefficient matrix (Equation 12):
Equations and mathematical formulas are available in the original paper PDF.
1 , ,
( ) ( ) ( ) ( ) γ γ
Equation reproduced from the original PDF.
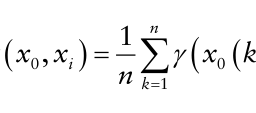
i i k x x x k x k n (13) Substitute the obtained grey relational coefficient matrix into Equation (13) to calculate the grey relational degree. The grey relational degree is the average value of the grey relational coefficients. Thus, the degree of association of each styling element of the bicycle saddle can be calculated. That is, when
( ) ( ) γ γ > 0 0 , , i j x x x x holds, it indicates that the grey relational degree of ( ) ix k to ( ) 0 x k is greater than that of ( ) jx k to ( ) 0 x k . The larger the value of
the grey relational degree, the more significant the role of the morphological element in the corresponding perceptual image. The final ranking results of the importance of different Kansei words to the morphological elements are shown in Table 7.
100 Li and Zhou As can be seen from Table 8, when the identification coefficient ξ is 0.5, there are significant differences in the ranking of the importance of morphological elements under different perceptual images. Since the value of the identification coefficient ξ has the effect of enhancing or weakening the contrast of each correlation degree, the smaller the value of the identification coefficient, the stronger the contrast of each correlation degree (Lyu et al., 1997). Therefore, to further refine the results, the results were recalculated when ξ was 0.4, 0.3, 0.2, and 0.1. Therefore, under the perceptual vocabulary pair “Minima-Ornate”, the importance of the morphological elements is ranked as follows: surface texture characteristics, contour style, nose shape, tail shape, overall form, and cut-out structure form.
The same steps were used to calculate the importance ranking of the design elements of the bicycle saddle under the influence of another two pairs of sensory words, “sharp-soft” and “Harmonious-Incongruous”. Under the pair of sensory words “sharp-soft”, the importance ranking of the design elements is as follows: tail shape, cut-out structure form, contour style, nose shape, surface texture characteristics, and overall form. While under the pair of sensory words “Harmonious-Incongruous”, the importance ranking of the design elements is: cut-out structure form, overall form, tail shape, surface texture characteristics, contour style, and nose shape.
The above grey relational analysis results can more accurately guide the design process, further enhancing designers’ work efficiency, and also better satisfy users’ emotional and aesthetic experiences. This can accelerate the update of bicycle saddle morphological designs and thereby strengthen the product’s competitive edge in the market.
CONCLUSION
This study takes bicycle saddles as the research object and, based on Kansei Engineering theory, integrates morphological element analysis, cluster analysis, and grey relational analysis to investigate the relationship between saddle morphological elements and users’ Kansei images.
First, a representative sample library of bicycle saddles was established. The saddle appearance was systematically decomposed into a morphological element system consisting of six primary elements and twenty-three secondary categories, which were quantitatively expressed through discretized coding. Based on these codes, cluster analysis was conducted to select forty representative samples. In parallel, a Kansei vocabulary system was constructed, and eight pairs of representative Kansei word pairs were identified to form the perceptual semantic space for bicycle saddle design.
Second, a mapping relationship between saddle samples and Kansei vocabulary was established through questionnaire surveys. Grey relational analysis was then applied to determine the importance ranking of morphological elements under three key Kansei dimensions, with the distinguishing coefficient set to ξ = 0.5. The results provide clear guidance for targeted bicycle saddle design under different emotional orientations.
Grey Relational Analysis of Bicycle Saddle 101 The main contribution of this study lies in the construction of a quantitative “product–semantics” mapping model for bicycle saddle design, which extends the methodological framework of saddle appearance research. The findings offer designers a clear basis for prioritizing morphological elements, thereby improving design efficiency and supporting emotion-oriented form optimization. Future research may further enhance the generalizability of the results by expanding the sample size, diversifying user groups, and incorporating additional analytical methods.
REFERENCES
Chen Xin, Zhang Nan. (2025). Research on Gray Correlation Degree of VR Head Mounted Display Modeling Based on Kansei Engineering. Creation and Design, (02):29–38. Cheng Wenting, Zhang Tengteng, Fan Qingyun, Yang Jierui, Andreas Panpenfuss.
(2023). Ergonomic design of bicycle saddle based on finite element analyses technology. Journal of Machine Design,40(10):163–169. Chowdhury, A., Karmakar, S., Reddy, S.M., Ghosh, S., Chakrabarti, D. (2014).
Usability is more valuable predictor than product personality for product choice in human-product physical interaction. International Journal of Industrial Ergonomics, 44 (5), 697–705. Deng J L. (1989). Introduction to grey system theory. The Journal of Grey System,1(1):1–24. Deng Ju-long. (1982). The Grey Control System. Journal of Huazhong University of
Science and Technology, 10(3): 9–18. Desmet, P.M., Nicolas, J.C.O., Schoormans, J.P. (2008). Product personality in physical interaction. Design Studies, 29(5), 458–477. Gao Fei, Xiang Zhongxia, Zhao Ming, Li Lili, Hu Zhigang, Zhang Jian. (2016).
Simulation and testing analysis of bicycle riding motion based on Anybody. Journal of Machine Design,33(01):105–110. Han Wei. (2022). Soccer shoe recommendation system based on Kansei engineering.
South China University of Technology. Jo Y K, Chun H C, Jonathan R, et al. (2020). Evaluation of the user emotional experience on bicycle saddle designs via a multi-sensory approach. International Journal of Industrial Ergonomics,80(11):1030–1043. Jo-Yu KUO, Chun-Hsien CHEN, Jonathan ROBERTS. (2017). The Subjective
Impression of Bicycle Saddles in Different Contexts.in: Transdisciplinary Engineering: A Paradigm Shift. C. Chen et al. (Eds.). pp. 303–310. Liu Zhenghong, Lin Yun, Xu Yuliang, et al. (2018). Product Design Scheme Evaluation Based on TOPSIS and Grey Relational Analysis. Modular Machine Tool & Automatic Manufacturing Technique, (6):163–167. López, Ó., Murillo, C., & González, A. (2021). Systematic Literature Reviews in
Kansei Engineering for Product Design-A Comparative Study from 1995 to 2020. Sensors, 21(19), 6532. Lu, N., Liu, S., Du, J., Fang, Z., Dong, W., Tao, L., & Yang, Y. (2023). Grey relational analysis model with cross-sequences and its application in evaluating air quality index. Expert Systems with Applications, 233, 120910. Lyu Feng. (1997). Research on the Identification Coefficient of Relational Grade for
Grey System. Systems Engi-neering-Theory & Practice, 17(6): 49–54. Nagamachi, M. (1986). Emotion technology and its application. The Japanese Journal of Ergonomics, 22(6), 319–324.
Human-Product Interactions. International Journal of Design, 6(2). Yao, K.-C., Chang, Y.-N., Chen, L.-Y., Li, K.-Y., Xu, J.-R., Ho, W.-S., et al. (2024).
Ergonomics in Bicycle Saddle Design: Application of TRIZ Innovation System Method with IPA-Kano Model Validation. Designs, 8(6), 114. Zhang Yang, Song Lei, Li Xuelin, et al. (2023). Grey Relational Analysis of Flybridge Yacht Modeling Based on Kansei Engineering. Packaging Engineering,44(16):180–187. Zhong Ling. (2021). Research on Bicycle Saddle Design Based on Joint Displacement
and Physiological Signal Detection. Changchun University of Technology.
LISTED IN THE AHFE DIGITAL BOOKSTORE CATALOGUE
Explore the complete digital volume
Human Factors and Ergonomics In Design
Read this individual research paper free through the original publisher, or explore the full digital proceedings book.
ISBN 978-1-964867-86-1
Explore this ISBN in the AHFE Bookstore ↗Listed in the July 2026 bookstore catalogue; search by ISBN to confirm current availability · Digital book purchase optional