Ari Aharari (2026). Human-Centered Explainability for Industrial Inspection: A Scenario‑Responsive Framework. In: Interdisciplinary Practice in Industrial Design. AHFE Open Access, vol. 222, pp. 12–22. https://doi.org/10.54941/ahfe1007742
The use of AI-driven vision systems is rapidly becoming a core component of quality assurance in smart‑manufacturing environments. However, the usefulness of these systems depends not only on their detection performance but also on how their outputs are conveyed to operators on the production floor. This study introduces a scenario‑responsive Kansei–XAI interaction framework designed to align explainable visual feedback with human‑centered design attributes such as transparency, confidence building, and operational control. Drawing on insights from two practical industrial contexts, periodic tray inspections and continuous conveyor‑line monitoring, the framework defines a Scenario Rhythm–Risk Profile Matrix together with a risk‑modulated explanation strategy that adjusts the level of explanatory detail according to uncertainty levels and operational hazards. Two graphical interface prototypes demonstrate how the framework can be implemented, and a systematic evaluation methodology is outlined to support future deployment and validation efforts.
Artificial intelligence has moved visual inspection beyond the limits of conventional rule-based techniques, with deep learning models for detection and segmentation now delivering robustness and adaptability once thought impractical on factory floors. These gains promise higher throughput and fewer escaped defects. Yet, deployment outcomes are still shaped as much by human-centered considerations as by model accuracy: operators must be able to understand and trust what the system reports, and they must be supported by interfaces that make those reports actionable in real time. Recent assessments of AI adoption in manufacturing repeatedly note that, although algorithmic accuracy has advanced, explainability and operator- facing decision support remain underdeveloped for high-consequence environments where responsibility ultimately falls on people (Hoffmann & Reich, 2023; Moosavi et al., 2024).
In quality-critical domains—e.g., food packaging, electronics assembly, and component verification—decisions are taken under asymmetric risk: missing a defect can trigger safety incidents, recalls, or reputational harm, whereas
Human-Centered Explainability for Industrial Inspection 13 overflagging primarily slows operations. Classic work on human–automation interaction frames this challenge in terms of trust calibration: operators need to rely on automation neither too much nor too little, but in proportion to its actual capability (Lee & See, 2004). If trust is miscalibrated—either inflated or unduly conservative—staff may dismiss valid alerts or defer excessively to the system, underscoring the need for interfaces that convey uncertainty, confidence, and rationale at a glance and in ways that align with operational tempo.
A parallel concern is maintaining Situation Awareness (SA)—the ability to perceive, interpret, and anticipate system states—under continuous workload. Poorly structured feedback can erode SA, especially on lines moving at hundreds of units per minute, where sustained monitoring makes operators vulnerable to vigilance decrement (Endsley, 1995). Explanations, therefore, must be crafted to support perceptual economy: brief, glanceable cues that assist verification without adding to cognitive load. Consistent with findings from workload research using NASA-TLX, even small increases in cognitive burden can slow response, increase error rates, and degrade long- run performance (Hart, 2006).
Work in explainable AI (XAI) for manufacturing reflects this dual-edged reality. Visual artifacts—such as saliency maps or overlays highlighting suspected defects—can improve speed and confidence when accurate, yet can also misdirect users when the cues diverge from the underlying issue, encouraging over-reliance or false assurance (Müller et al., 2024). These observations motivate explanation mechanisms that are attuned to context: reduce intrusiveness when confidence is high and operational risk is low; increase detail and justification when uncertainty or stakes rise.
In response, this paper proposes a scenario-adaptive explanatory interface framework for industrial visual inspection. The framework is grounded in two deployments with contrasting temporal and operational demands: (1) event-bounded tray inspection for size/weight conformance, and (2) continuous conveyor monitoring for oxygen-indicator color changes. The two settings differ in attentional profile (episodic versus continuous), workflow cadence (inspect–reset versus monitor–intervene), and error cost structure (isolated versus cumulative). Making these distinctions explicit is essential to determine not only what to explain, but also when and how much to explain.
By integrating insights from human factors engineering, trust calibration, and contemporary XAI findings, we articulate design principles for risk-gated, low-intrusion, operator-aligned explanations that safeguard throughput while strengthening confidence, usability, and decision quality under asymmetric risk. In short, we address a persistent deployment gap: model-centric progress has outpaced guidance for operator-facing explainability and interaction. We therefore treat explainability as an interaction policy—parameterized by task rhythm and operational risk—validated and illustrated through the two contrasting use cases of event-bounded tray inspection and continuous conveyor monitoring (Hoffmann & Reich, 2023; Hart, 2006; Müller et al., 2024).
BACKGROUND AND RELATED WORKS Deep learning has greatly advanced automated defect detection by providing robustness beyond traditional rule-based inspection. However, these improvements have not eliminated a major deployment barrier: operators often struggle to interpret AI outputs, reducing trust and limiting adoption on the shop floor (Moosavi et al., 2024; Hoffmann & Reich, 2023). As production systems become more complex, the lack of transparency reinforces the need for explainable AI (XAI) to ensure interpretable and auditable decision support (Madathil et al., 2025).
In quality-critical industries, operators make rapid decisions under asymmetric error costs, where missed defects are far more consequential than false alarms. Human–automation studies emphasize that effective reliance depends on trust calibration, the alignment between operator trust and system capability (Lee & See, 2004). Miscalibrated trust—either over- or under-reliance—can degrade performance. Interface design plays an important role, as the clarity of feedback and the visibility of uncertainty shape reliance and comprehension when systems are opaque (Parasuraman et al., 2000; Onnasch et al., 2014).
Automation literature also warns that while higher automation can lower workload, it may diminish situation awareness (SA), particularly when system feedback is incomplete or poorly timed (Onnasch et al., 2014). Endsley’s SA model highlights the limits of attention and working memory in dynamic environments (Endsley, 1995). On fast-moving inspection lines, sustained monitoring can cause vigilance loss, making it essential that explanations be concise, glanceable, and cognitively economical. NASA-TLX findings further show that even small increases in workload can slow responses and raise error rates (Hart, 2006).
Within industrial inspection, visual explanations such as saliency overlays can support faster decision-making, but incorrect or misaligned cues can mislead operators and increase oversight risk (Müller et al., 2024). This motivates context-adaptive XAI strategies that scale the amount of explanation based on uncertainty and operational risk. Although datasets like MVTec AD have driven progress in anomaly detection (Bergmann et al., 2019), most research focuses on algorithms rather than human interpretability. Complementary efforts propose causal and defect-guided models to improve detection clarity (Liang et al., 2024) and advocate for integrating process knowledge with visual explanations to improve acceptance (Emmanouilidis & Rica, 2023).
Work on embedded XAI demonstrates that mixed-modal explanations can be delivered efficiently even under edge-device constraints (Nguyen et al., 2024), showing their practicality in real factory environments. However, several gaps remain:
Human-factors principles such as workload management and trust calibration are rarely incorporated into design guidelines (Hoffmann & Reich, 2023; Moosavi et al., 2024).
There is limited guidance on when and how much explanation should be shown relative to cognitive load or task tempo.
Task-rhythm differences—episodic inspection vs. continuous monitoring—are seldom used to shape explanation behaviors.
Few systems implement risk-scaled explanation policies despite the high cost of false negatives.
Excessive alerts can cause alarm fatigue and reduce responsiveness (Hunter, 2024).
While AI-based inspection is technically mature, current systems insufficiently integrate XAI with human-centered design, SA preservation, and workload considerations. The framework proposed in this work responds to these gaps by linking explanation density, timing, and operator engagement to the dynamics of industrial inspection, supporting both throughput and decision quality under uneven risk.
INDUSTRIAL USE CASES AND OPERATIONAL CONSTRAINTS To ground the proposed approach in real practice, we draw on two contrasting deployments on production lines: discrete, tray-triggered inspection and streaming conveyor surveillance. Although both target vision-based quality assurance, they differ markedly in attentional cadence, workflow cadence, and the consequences associated with errors.
Discrete Tray Checks (Operator-Led) In frozen seafood processing, manual portioning introduces natural dispersion in piece geometry and mass. Small deviations may pass, but larger inconsistencies propagate downstream—delaying packing, disrupting tray fill patterns, and triggering QC rejects. Inspection therefore requires simultaneous assessment of geometry and weight, under non-ideal imaging (e.g., tilted trays, partial occlusions, uneven lighting).
To address these conditions, the system employs an OBB-capable YOLOv11n variant (YOLOv11n-obb) to capture orientation and irregular contours. A networked electronic scale provides an independent physical measurement, enabling cross-checks between vision and weight. Tray arrival (via a sensor) initiates pose alignment using detected tray corners, stabilizing pixel-to-millimeter calibration. After the scale reading stabilizes, inference is executed and the GUI renders the compliance decision.
Each tray constitutes a bounded decision episode: one tray into one verdict. Operators must issue a rapid judgment but also be able to trace the basis of an NG. Consequently, the interface should present concise, stable layouts with high-salience OK/NG status, while providing on-demand access to evidence without clutter or distraction. Explainability needs to be available yet restrained, supporting a verify-then-confirm interaction pattern (Aharari & Tanaka, 2025; Aharari, Kuwaduru & Mehdipour, 2023).
On packaged-food lines, oxygen indicators embedded in products shift color with residual oxygen (e.g., pink to blue). At high throughputs, manual discrimination is cognitively taxing due to subtle chromatic variation, continuous stimuli, and sustained vigilance demands—conditions that heighten the risk of vigilance decrement (Aharari & Imamura, 2025; Aharari & Haraguchi, 2023).
A compact edge stack on a Raspberry Pi runs a YOLOv5-based detector coupled with a purpose-built color evaluation module. A photoelectric sensor synchronizes image capture as each package passes the camera. A small local display provides instant classification feedback. End-to-end processing averages ≈ 1.2 s per image, with evaluation indicating high discrimination performance.
Unlike the tray case, operators must sustain situation awareness over a continuous flow, intervening only on NG events. The GUI should therefore favor glanceable baselines where anomalies pop out against normal throughput. Alarm-fatigue management is critical: cues that are too frequent or too loud risk desensitizing users; cues that are too subtle risk misses. Explanations should be rhythm-aware and demand-driven, surfacing supporting evidence only when uncertainty (or operational stakes) warrants operator attention.
Across both installations, operators converged on similar needs:
Lower cognitive load through stable layouts and minimal unnecessary visual search.
Clear visibility of errors with immediate, interpretable NG signaling.
Traceability so that the basis for decisions (detections, measurements, uncertainty) can be reviewed and audited.
Risk-scaled explanations, with denser evidence shown only when confidence is low or consequences are high.
PROPOSED FRAMEWORK The goal of the proposed approach is to provide operators with explanations that are appropriate for the tempo of the task and proportional to operational risk and model uncertainty. To accomplish this, we introduce a scenario-adaptive framework composed of two complementary components:
Scenario Rhythm–Risk Profile grid that characterizes inspection conditions.
Risk-responsive explanation policy that determines how much information the interface should reveal.
Human-Centered Explainability for Industrial Inspection 17 Scenario Rhythm–Risk Profile Grid
Inspection tasks vary in both temporal rhythm and error-cost characteristics.
The framework models these dimensions as orthogonal axes:
Scenario Rhythm distinguishes between, episodic inspection (discrete, operator-reset cycles) and continuous monitoring (ongoing surveillance with rare interventions).
Risk Profile reflects the asymmetry of error consequences, ranging from low/moderate to high severity.
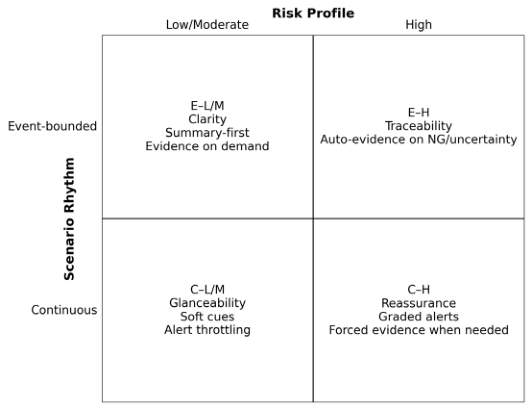
Mapping a production environment onto these axes allows the interface to determine whether operators require: a summary-oriented presentation for fast decision cycles, low-intrusion cues suitable for continuous workloads and full evidential breakdown when risk or uncertainty is elevated.
Figure 1: Scenario–rhythm vs risk–profile matrix for scenario-adaptive explanation design.
The resulting matrix (Figure 1) guides explanation style selection and helps standardize interaction patterns across different inspection scenarios.
Risk-Responsive Explanation Strategy To formalize how explanation density should react to model behavior, we define explanation level E as a function of two variables, model confidence c∈(0–1) and an application-level risk scalar r∈(0–1).
Explanation demand increases when confidence drops or when risk increases: ( ) ( ) 1 , 0, 0 1 E E E f c r c r ∂ ∂ = − > > ∂ − ∂
18 Aharari A practical three-level policy is as follows (thresholds tunable by line conditions): This formulation supports a three-tier policy that can be tuned to line-specific constraints such as false-positive tolerance, auditing requirements, and acceptable intervention frequency.
High confidence region (c > τh) Summary View Only (OK/NG and minimal stats)
Medium confidence region (τm < c ≤ τh ) Soft Cues (subtle overlays and optional drill-down)
Low confidence or high risk region (c ≤ τm or r=H and c ≤ τh) Evidence View Auto-presented (localization/measurements/uncertainty notes and traceable log) Default thresholds such as τh ≈ 0.90, τm ≈ 0.60 act as starting points, but production settings may tune them based on line variability, inspection tempo, or domain-specific risk asymmetries.
Kansei-Driven Interface Priorities Through field observations and operator interviews, three emotional-cognitive objectives (Kansei attributes) consistently emerged. These objectives shape how the above policies translate into interface behaviors:
Clarity: prominent OK/NG indicators and consistent layout.
Reassurance: uncertainty cues and graded alerts.
Controllability: operator-initiated evidence and progressive disclosure.
Together, these objectives ensure that explanations not only inform but also support the operator’s cognitive workflow and emotional state under high-pressure conditions.
GUI CONCEPTS To translate the scenario-adaptive framework into practical interfaces, we developed two complementary graphical user-interface concepts. Each concept is tailored to the temporal rhythm and cognitive demands of its respective inspection environment:
GUI-1 supports discrete, tray-triggered evaluations where operators inspect and then confirm.
GUI-2 supports continuous conveyor-line monitoring where operators primarily observe and intervene only when necessary.
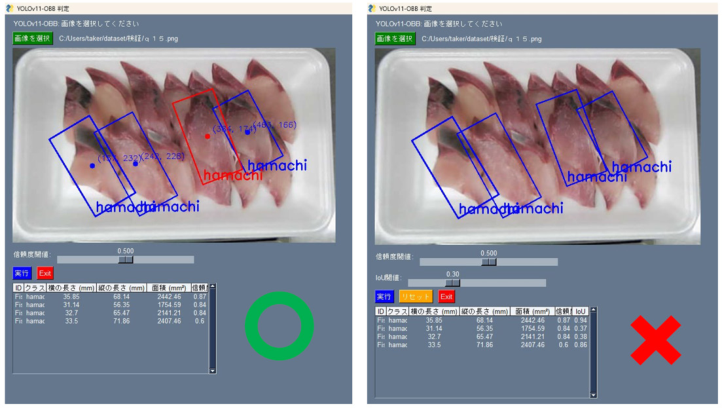
GUI-1: Interface for Tray-Triggered Inspection (Inspect → Confirm Workflow) GUI-1 is structured around a dual-layer information design (Figure 2). The primary layer presents only the essentials—an easily visible OK/NG outcome and a minimal amount of contextual detail needed for rapid acknowledgment. This layer is intentionally sparse to support fast, repetitive cycles.
Human-Centered Explainability for Industrial Inspection 19 When more detail is required—typically during NG or borderline cases— the operator can move to the secondary evidence layer, which reveals: localized overlays, measurement annotations, extracted geometric information, and uncertainty cues.
This hierarchical organization aligns with the episodic nature of tray inspection. Each time the tray is removed, the interface automatically resets, ensuring that no cognitive residue is carried into the next cycle. This design reduces working-memory load and helps maintain consistent decision quality.
In scenarios involving irregular shapes or overlapping portions, the evidence layer highlights problematic detections through distinct visual cues, making irregularities quickly discernible. The system also includes a re-capture/re-inference option so operators can recover from ambiguous or partially visible samples (Aharari & Tanaka, 2025; Aharari, Kuwaduru & Mehdipour, 2023). Figure 2 illustrates the adaptive design for size- and weight-compliance inspection.
Figure 2: Scenario-adaptive GUI for tray-based size and weight compliance inspection.
GUI-2: Interface for Conveyor Surveillance (Monitor → Intervene Workflow) Where GUI-1 supports episodic decisions, GUI-2 is optimized for continuous observation, where operators monitor a constant flow of items and only respond to abnormalities.
The design emphasizes glanceability, low fatigue, and sustained situational awareness:
Tiered alerting: Only high-confidence NG results trigger a prominent notification. Borderline detections are signaled using soft cues, preventing desensitization and reducing alert fatigue (Aharari & Imamura, 2025; Aharari & Haraguchi, 2023).
Throughput-aware layout: Counters displaying OK/NG/uncertain totals provide instant feedback about production status and support post-batch verification and accountability.
Robust visibility: Enhanced contrast and strong chromatic indicators ensure that critical information is visible despite glare, shadows, and factory-floor lighting variability.
Fatigue mitigation and trust calibration: Signal intensity is scaled according to confidence so operators learn to differentiate between routine detections and events that require manual verification.
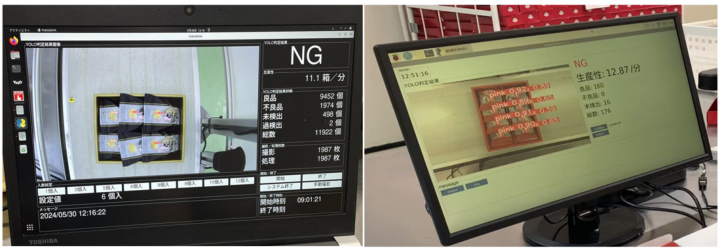
These features collectively support a monitor-first interaction style, where the interface preserves vigilance while avoiding cognitive overload. Figure 3 presents the corresponding continuous-monitoring GUI for oxygen-indicator assessment.
Figure 3: Continuous monitoring GUI for conveyor-line oxygen-indicator color evaluation.
Explainability as an Interaction Policy The two concepts reinforce the central argument of this work: explainability in manufacturing should not be treated as a single visual technique but as a policy that adapts to the operational rhythm and risk profile.
In event-bounded inspection, summary-first designs accelerate cycle time while enabling accountable follow-up through on-demand evidence.
In continuous monitoring, adaptive alerting and throttling guard against fatigue, protect vigilance, and sustain trust.
The integration of Kansei-informed attributes—clarity, reassurance, and controllability—ensures that interfaces align not only with cognitive needs but also with operator confidence and comfort, both of which are critical for long-term adoption.
EVALUATION PROTOCOL Future evaluations of the proposed framework should follow a structured methodology incorporating both performance and human-factor measures:
NASA-TLX workload assessment to quantify cognitive burden.
Response-time metrics, including tray-inspection decision latency and conveyor acknowledge time.
Error metrics, especially those emphasizing false-negative–dominated consequences.
Trust-calibration instruments, measuring appropriate reliance, perceived transparency, and comfort with automated judgments.
Traceability completeness, examining event-log quality and the ease of retrieving supporting evidence.
A within-subject experimental design comparing baseline GUIs with the proposed adaptive designs is recommended. Optional eye-tracking analysis can provide further insight into perceptual economy and help identify potential attention-misdirection patterns.
CONCLUSION
This work introduced a scenario-adaptive explanation framework to improve how operators interact with AI-based visual inspection systems. Although modern deep-learning models achieve high accuracy, effective deployment still depends on interfaces that communicate decisions clearly, manage cognitive load, and support operator accountability.
By examining two contrasting environments—tray-based size/weight checks and continuous oxygen-indicator monitoring—we showed that explanation strategies must adapt to task rhythm and risk. The framework integrates principles from human factors, trust calibration, and XAI to define how explanation detail and timing should change with uncertainty and error severity.
A central contribution is the risk-gated explanation policy, which increases evidential detail only when needed, helping prevent over-reliance, loss of situation awareness, and unnecessary attentional burden. The GUI prototypes demonstrate how interface design must mirror workflow: discrete inspect-and-confirm cycles benefit from summary-first layouts with optional evidence, while continuous monitoring requires glanceable alerts and fatigue-resistant signaling.
Overall, the study argues that explainability in manufacturing is fundamentally a human-centered design challenge. Aligning explanation behavior with operational tempo and cognitive demands can enhance trust, decision quality, and throughput. Future work should include longitudinal field studies, operator-adaptive personalization, and integration with multi-sensor inspection systems.
REFERENCES
Aharari, A. & Haraguchi, K. (2023). Development of Automated Oxygen Indicator Color Discrimination Using Artificial Intelligent Technology. Proceedings of the 2023 IEEE 3rd International Conference on Electronic Communications, Internet of Things and Big Data (ICEIB 2023), pp. 206–210.
Japanese Sweets Packaging: An AI-Driven Approach to Oxygen Indicator Color Detection. Proceedings of the 2025 IEEE 15th Symposium on Computer Applications & Industrial Electronics (ISCAIE), pp. 420–423. Aharari, A. & Tanaka, S. (2025). Development of Artificial Intelligence-Based Product Size Detection System. Engineering Proceedings, IEEE ICEIB 2025, 108(1), pp. 1–9. Aharari, A., Kuwaduru, K. & Mehdipour, F. (2023). Development of an Artificial
Intelligence (AI) Based Visual Counting System for the Food Industry. Proceedings of the 13th IEEE Symposium on Computer Applications and Industrial Electronics (ISCAIE 2023), pp. 136–139. Bergmann, P., Fauser, M., Sattlegger, D. & Steger, C. (2019). MVTec AD – A Comprehensive Real-World Dataset for Unsupervised Anomaly Detection. Proceedings of the IEEE/CVF Conference on Computer Vision and Pattern Recognition (CVPR), pp. 9584–9592. Emmanouilidis, C. & Rica, E. (2023). Visual Quality Control via eXplainable AI and
the Case of Human in the AI Loop. In: 16th WCEAM Proceedings, Lecture Notes in Mechanical Engineering. Springer. Endsley, M.R. (1995). Toward a Theory of Situation Awareness in Dynamic Systems.
Human Factors, 37(1), pp. 32–64. Hart, S.G. (2006). NASA-Task Load Index (NASA-TLX); 20 Years Later.
Proceedings of the Human Factors and Ergonomics Society Annual Meeting, 50(9), pp. 904–908. Hoffmann, R. & Reich, C. (2023). A Systematic Literature Review on Artificial Intelligence and Explainable Artificial Intelligence for Visual Quality Assurance in Manufacturing. Electronics, 12(22), 4572. Hunter, N. (2024). The Psychology Behind Alarm Response: Insights from Human
Factors. Human Reliability Associates. Available at: https://www.humanreliability. com/ (accessed January 26, 2026). Lee, J.D. & See, K.A. (2004). Trust in Automation: Designing for Appropriate Reliance. Human Factors, 46(1), pp. 50–80. Liang, T., Liu, T., Wang, J., Zhang, J. & Zheng, P. (2024). Causal Deep Learning for
Explainable Vision-Based Quality Inspection under Visual Interference. Journal of Intelligent Manufacturing, 36, pp. 1363–1384. Madathil, A.P., Luo, X., Liu, Q., Walker, C., Madarkar, R. & Qin, Y. (2025). A Review of Explainable Artificial Intelligence in Smart Manufacturing. International Journal of Production Research. Moosavi, S., Farajzadeh-Zanjani, M., Razavi-Far, R., Palade, V. & Saif, M. (2024).
Explainable AI in Manufacturing and Industrial Cyber–Physical Systems: A Survey. Electronics, 13(17), 3497. Müller, R., Reindel, D.F. & Stadtfeld, Y.D. (2024). The Benefits and Costs of Explainable Artificial Intelligence in Visual Quality Control: Evidence from Fault Detection Performance and Eye Movements. Human Factors and Ergonomics in Manufacturing & Service Industries, 34(5), pp. 396–416. Nguyen, H.T.T., Nguyen, L.P.T. & Cao, H. (2024). XEdgeAI: A Human-centered
Industrial Inspection Framework with Explainable Edge AI. arXiv preprint. Onnasch, L., Wickens, C.D., Li, H. & Manzey, D. (2014). Human Performance Consequences of Stages and Levels of Automation: An Integrated Meta-Analysis. Human Factors, 56(3), pp. 476–488. Parasuraman, R., Sheridan, T.B. & Wickens, C.D. (2000). A Model for Types and
Levels of Human Interaction with Automation. IEEE Transactions on Systems, Man, and Cybernetics – Part A: Systems and Humans, 30(3), pp. 286–297.
LISTED IN THE AHFE DIGITAL BOOKSTORE CATALOGUE
Explore the complete digital volume
Interdisciplinary Practice in Industrial Design
Read this individual research paper free through the original publisher, or explore the full digital proceedings book.
ISBN 978-1-964867-98-4
Explore this ISBN in the AHFE Bookstore ↗Listed in the July 2026 bookstore catalogue; search by ISBN to confirm current availability · Digital book purchase optional