Eduards Aksjonenko, Airita Aksjonenko (2023). What are the key components and contributing factors for effective feedback system for training programs within a field of business administration?. In: Human Interaction & Emerging Technologies (IHIET 2023): Artificial Intelligence & Future Applications. AHFE Open Access, vol. 111, pp. 820–829. https://doi.org/10.54941/ahfe1004090
Digital transformation creates opportunities for easy result delivery and system implementation that clearly identifies motivation and drawbacks for everyone involved. To create an effective and engaging feedback system that helps monitor training programs and can be applied in various organizations – lecturers from the Department of Management of BA School of Business and Finance tested a new feedback method system with the intention to find the key components and contributing factors that also measures the performance of the quality of an educational products, organization goals and performance of participants (students) and lecturers involved in the process. Online survey methods, e-mail marketing tools and classical statistical methods in combination with machine learning algorithms were used. The main purpose of the feedback collection was to ensure high-level engagement in response collection - that demonstrates problems and positive aspects for a product of educational programs in the field of business administration and finance studies which are both relevant for entrepreneurial studies and knowledge gaining within any organization.The article is based on statistical methods and analyses contributing factors that managed to collect more than two-thirds of quality feedback responses which is a higher rate than usual rate in organizations involved. Overall, 197 respondent answers were analysed from three educational institutions with similar educational programs, with the same two lecturers performing at 11 different study group courses. As a result – both way two (lecturer-participant) or even three-sided (lecturer-organization and organization-student) feedback system can be widely integrated and applied in both private and public sector educational and commercial institutions for a purpose – to monitor progress towards the goal reach whether it is the entrepreneurial intention, evaluation of skills, quality or a practical use of a knowledge gained.Conclusions involve aspects of – what makes an educational product valuable in the eyes of a customer and target audience. Also - why the feedback is crucial and how it benefits the overall monitoring of the goal reach for the organization. In combination with digital transformation opportunities – the system can be implemented in any organization for the process evaluation of in-house or outsourced training programs objectively.Keywords: Feedback system, Digital Transformation, Entrepreneurial education, Experiential learning, Goals, Entrepreneurial intention, Business administration
What Are the Key Components and Contributing Factors for Effective Feedback System 821
INTRODUCTION
Recent decades witnessed the rapid growth of training programs but accor- ding to Elert, Andersson and Wennberg (2015) – it is known just a little – what impact it makes on creating high-quality firms because of effort and inspiration put into the study process which even ends with positive gra- ding or high course completion success rate results. The same question can be asked – if and how we are implementing the right feedback collection methods that align with the goals of the organization while performing the educational process.
Feedback received – both positive and negative if used in progress monito- ring – increases motivation for goal striving (Borovoi, Schmidtke and Vlaev, 2020). Therefore, it is necessary to perform goal and other critical result mea- surement by establishing the right monitoring systems even before the study courses or training programs start or are even developed.
IMPORTANCE OF THE EDUCATIONAL PROCESS FEEDBACK SYSTEM WITHIN ORGANIZATION As a method – multi-indicator measurement is one of the mainstream models for entrepreneurship education efficiency evaluation because in parallel of participant success it also includes the level of attitudes, skills and performa- nce of lecturers (Liu, Kulturel-Konak and Konak, 2021). Evaluation division into four levels (reflection, learning, behaviour and results) introduced in Kirkpatrick’s framework (Kirkpatrick, 1959) starts with the role of the prime educator and its competency.
In the field of entrepreneurship and business administration - it is one of the base components in measuring the impact on participant performance (Ruskovaara and Pihkala, 2014).
In order to increase the chances of entrepreneurial intention as one of the outcomes that organization expects as a goal to be reached – techniques and new tactic integration as experiential learning methods should be used and encouraged in entrepreneurship-related education (Liang et al., 2016).
To attract the attention of students – content delivery nowadays should be in connection of technology-mediated learning which is described as envi- ronment where technology an intermediary (Agbo et al., 2023). It includes both content delivery methods and easy to give a feedback options thanks to online automated surveys which decrease administrative costs in seeking analysis (in combination of digital transformation opportunities – processes can be automatised). Feedback-seeking behaviour has been studied in the field of organizational psychology (Anseel et al., 2013) and there is a steady growth for research attention on seeking feedback because it develops posi- tive attitudes with clients, employees, students and according to social capital theory – relations that can expect aspiration towards the achievement of vari- ous goals of organizations and can also co-engage participants on specific supportive behaviours (Bandura, 2002).
Feedback-seeking research and activities is attractive and according to Liu et al. (2022) include practical benefits – participants involved in busi- ness administration studies are even more interested to continue seeking
822 Aksjonenko and Aksjonenko
both sided feedback and gaining value in their entrepreneurial educational processes as a potential implication to their future business activities.
TRAINING PROGRAM EVALUTAION Both authors were the lecturers that delivered 11 study courses in the field of business administration and finance in the first semester of the study year 2022./23. All 288 students who participated and passed the courses were informed and kindly asked to anonymously fill out the feedback surveys with a promise – that they will also receive analysis and overall performa- nce summary within the course so they can compare their individual input. Students were from 3 different educational institutions in Latvia of mixed age, gender, language the course was performed (Latvian (LV) and English (ENG)), and nationality. Also, there was a promise that a full analysis of each course and lecturer performance will be given directly to the management of organization to ensure three-sided information exchange opportunities in evaluating the efficiency. Both lecturers did equal study content delivery workload.
Both authors agreed that content delivery and quality for the courses will be according to the best practices based on previous positive experience and methods benefiting the successful outcome for the study program and orga- nization goals that include knowledge level, interest in other subjects and practical use of skills. Also, it was agreed that surveys are sent after students receive full feedback, comments and final grades from lecturers which is an indication that a study course is over, and all answers are encouraged to pro- vide honest and critical feedback to improve the study process of the course and work of a lecturer.
All together – 197 (68,4%) responses were collected in full which were used to perform the analysis mentioned in this article. Each of the participants answered 25 questions.
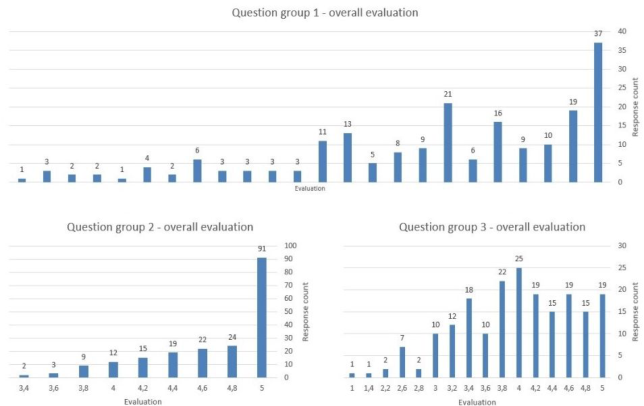
Exploratory Data Statistics To understand the distribution and tendencies of the survey responses, explo- ratory data analysis (EDA) was performed on the dataset. The initial question was – how do the replies vary between question groups? The questions from a survey were divided into three groups: group 1 focusing on overall course and content quality, group 2 – on communication with the lecturer, and group 3 – on comparison to other courses. As indicated in Figure 1, question group 1 exhibits a very skewed distri- bution towards the higher values. The same applies to question group 2. However, question group 3 seems to exhibit a distribution that’s more nor- mal, indicating that responses in this question group were not as high as in the first two.
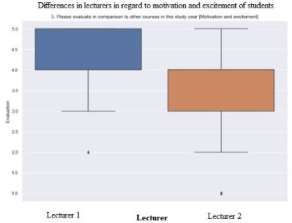
After exploring the individual question groups, additional attention was paid to how various attributes of the course were reflected in the responses. For this purpose, a simple boxplot was used, with the X-axis representing the attribute groups of interest. Some interesting insights were derived while com- paring evaluation distributions between two lecturers present in this study.
What Are the Key Components and Contributing Factors for Effective Feedback System 823
Figure 1: Overall evaluation in three question groups (Aksjonenko and Aksjonenko, 2023).Figure 2: Differences in lecturers in regard to motivation and excitement of students (Aksjonenko and Aksjonenko, 2023).
Figure 2 illustrates the difference between lecturers (L1, L2) when it comes to students’ motivation and excitement, with L1 scoring approximately a point higher than L2.
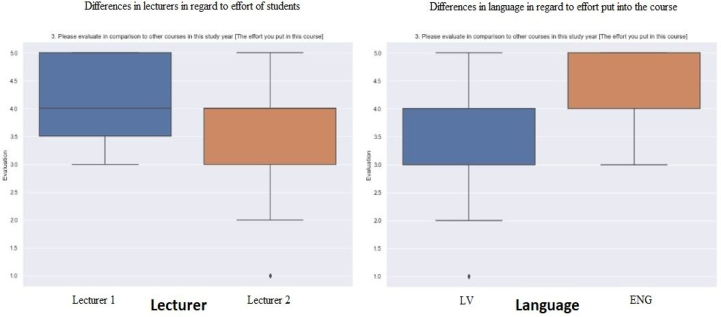
The same tendency, albeit less pronounced, is exhibited when exploring students’ effort put into the course and similar also observed when it came to the language in which the course was taught, where courses taught in Latvian (LV) were in general rated a point lower when it came to students’ effort put into the course (both seen in Figure 3). Differences in style, knowledge delivery and characteristics of a person are contributing factors.
Descriptive Statistics A descriptive statistical analysis (see Table 1) was performed on students’ evaluations. Although the question groups are not directly comparable due to different evaluation scales (0-5 for group 1 and 1–5 for groups 2 and 3), some conclusions might still be drawn from the distribution of data.
824 Aksjonenko and Aksjonenko
Figure 3: Differences in lecturers in regard to effort of students and differences in language in regard to effort put into the course (Aksjonenko and Aksjonenko, 2023).Table 1. Descriptive statistics of question groups (Aksjonenko and Aksjonenko, 2023).
Table available in the original PDF paper.
First, the question group regarding the course’s comparison to other cour- ses shows the lowest mean evaluation of 3.96, but also the highest standard deviation of 0.9, which indicates that there is a wider range of answers. Que- stion group 2 (communication with the lecturer) was rated the highest, with a mean value of 4.66. However, this is not comparable to question group 1, as the latter has a wider evaluation scale.
Two of the question groups (group 1 and group 3) show a very high value of Cronbach’s alpha – 0.93 and 0.87 which indicates a high internal consi- stency of the question groups. Question group 2, however, indicated a lower internal consistency than is generally deemed sufficient (<0.65), which shows that the questions might be contradicting each other when referring to the overarching question (in this case – communication with the lecturer).
What Are the Key Components and Contributing Factors for Effective Feedback System 825
The Shapiro-Wilks test indicates that none of the question group answers come from a normal distribution, as the Test value is larger than the Signi- ficance values. This can also be observed when plotting the answers in a histogram (see Figure 1).
Correlation Analysis Correlation analysis of the three question groups (see Table 2) reveals that the question groups regarding the content of the course have a highly significant (p < 0.01) strong positive correlation with the two other question groups (marked as “***”). It is the identification of that if a student evaluates the course highly in general, it is most likely they will give a high grade in the subcategories of “communication with their lecturer” and “the quality of the course with regard to other courses” also.
Moreover, a correlation matrix was also computed for the individual que- stions, which showed a strong positive collinearity (Pearson’s R > 0.7) for two question pairs:
q1a (General evaluation of the course) & q1e (Efficient usage of lesson time)
q3a (My involvement in this course) & q3b (The effort you put in this course) Interestingly, the student’s view on how efficiently the lesson time was used shows strong positive correlation to the overall evaluation. This might indi- cate that efficient lecture class time usage is one of the most important factors for a student. The latter question pair (q3a & q3b), however, seems to be asking two very similar questions, as involvement might be interchangea- ble with effort for most students, therefore the collinearity between these questions seems more self-explanatory.
Table 2. Correlation matrix (Aksjonenko and Aksjonenko, 2023).
Table available in the original PDF paper.
Pearson Correlation Coefficient Correlation matrix Content Communication Comparison
Content 1.0*** Communication 0.58*** 1.0*** Comparison 0.65*** 0.31*** 1.0***
Regression Analysis To further understand which attributes of a study course, contribute to a high (or low) evaluation, Ordinary Least Squares (OLS) regression was per- formed on the dataset. The dependent variable Y in this dataset was the mean evaluation of the course (average of all questions), and the independent vari- ables were binary features constructed from the course attributes. The binary feature groups for OLS are as follows:
Language (ENG – English, LV- Latvian)
Lecturer (Lecturer 1, Lecturer 2)
Name of the course (Course)
826 Aksjonenko and Aksjonenko
Study field (Business Administration, Finance)
Group of students (by a study year)
Educational organization (University 1, University 2, University 3) The OLS Regression model was fit with an R-squared value of 0.24, and an adjusted R-squared value of 0.2. The F-statistic is 5.94 with 10 degrees of freedom 1 and 186 degrees of freedom 2, which indicates a statistically significant result at the P = 0.01 level (5.94 > 2.32).
To explore the contribution of each variable to the final evaluation, the regression coefficients were considered along with their test and significance values (Table 3). The feature that yielded the highest contribution to a posi- tive overall evaluation was the field of Business Administration. Meaning, whenever a course was a part of the Business Administration field, there is a highly significant chance that the course will be rated higher. The same strong, statistically significant positive relationship applies for courses of “Software Metrology” and “Basics of Management 1”.
Another significant factor for a higher evaluation of the course is the pre- sence of Lecturer 1, so when the value for Lecturer 1 is “1”, the likelihood of the course being rated higher increases – this is the fourth strongest predictor in the model.
Table 3. Ordinary least squares multiple regression (Aksjonenko and Aksjonenko, 2023).
Table available in the original PDF paper.
Binary parameter Coefficient t P > |t|
0.460 2.298 0.023
Study field - Business Administration 1.295 38.200 0.000 Course - Software Metrology 0.893 13.260 0.000 Course – Basics of Management 1 0.761 19.102 0.000 Lecturer 1 0.728 9.039 0.000 Educational organization - University 1 0.676 8.620 0.000 Educational organization - University 2 0.487 11.667 0.000 Group – 1st year (business processes, distance learning)
0.221 1.817 0.071
Course - Basics of Management 2 0.455 5.090 0.000 Language - ENG 0.281 4.324 0.000 Group – 3rd year (finance, day studies) 0.275 1.978 0.049 Group – 3rd year (finance, evening studies) 0.266 2.639 0.009 Group – 3rd and 4th years combined (finance, distance learning)
0.168 2.699 0.008
Group – Seniors in high school (business processes)
0.072 1.173 0.242
Course - Marketing 0.132 1.329 0.185 Group - 3rd and 4th years combined (business process, evening studies) -0.005 -0.036 0.972 Group – 1st year (business process, evening studies)
-0.187 -1.462 0.146
Group - 1st and 2nd years combined (business process, international groups)
-0.424 -6.238 0.000
Course – Strategic Management -0.353 -8.174 0.000 Group - 3rd year (business processes, international groups combined)
What Are the Key Components and Contributing Factors for Effective Feedback System 827
The last of the strong positive predictors with a coefficient above 0.5 is University 1, which stands for “BA School of Business and Finance”. Meaning – if the course is a part of the University 1 curriculum, the ave- rage evaluation has a high probability to increase. It might be in a relation that both lecturers are originally from the department of this educatio- nal organization. As a contributing component, this can be researched in future.
Some of the strong negative predictors – features whose presence decre- ases the evaluation – are the student group “3rd course – business process management, international groups combined”, as well as the course “Strate- gic Management”. Meaning, the group tends to rate their courses lower, as well the course “Strategic Management” appears to be rated lower as well. This is an indication that communication with a group should be performed in order to improve potential problems related to communication and the whole study administration process.
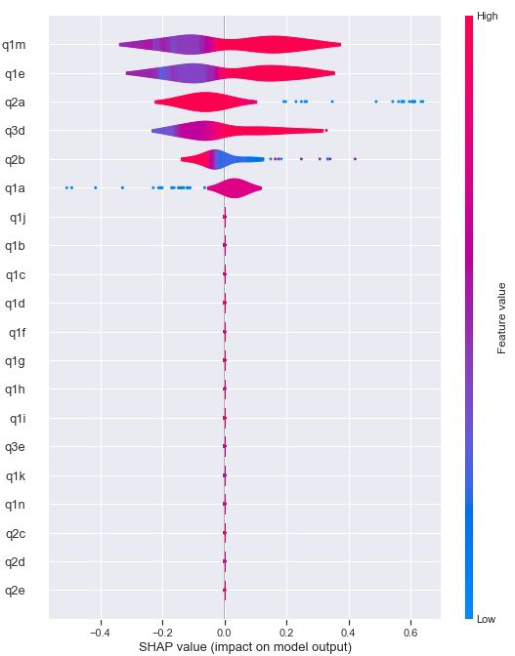
Gradient Boosted Trees for Further Attribute Contribution Exploration After identifying that there is a difference between how the two lecturers were evaluated, it was imperative to explore this relationship further and discover which questions specifically were contributing the most to this difference between the lecturers. To discover this, a feature contribution analysis was performed through training a XGBoost - Gradient Boosted Trees machine learning algorithm (Chen and Guestrin, 2016), where the independent variables were the question answers (25 x 197) and the depen- dent variable was whether Lecturer 1 was present or not. A model was trained to answer the following question: judging from the answers, which lecturer do you think it is? Feature contributions were explored using the SHapley Additive exPlanations (SHAP) analytic package (Lundberg and Lee, 2017). In the feature contribution plot (Figure 4), the Y1 axis represents most of the questions present in the survey, and the X axis represents each question’s impact on the model output, and Y2 axis represents whether the question had a high or low score. All of this is measure in respect to Lecturer 1, hence an inverse relationship is implied for Lecturer 2. For example, question q1m (“relevance of additional materials”) – when answered with higher values (red shade concentrated on the right side of the 0 impact line) – contributes more to the likelihood of Lecturer 1.
Additionally, questions q1e and q3d (“Use of class time”, “My motivation and excitement”) also exhibit a similar relationship, where higher values in these questions increase the probability of Lecturer 1.
However, questions q2a (“It was clear - how and through which channels to communicate with a lecturer”) and question q2b (“Lecturer responded through communication channels within 1 week”) exhibit an inverse relati- onship, meaning that higher values of these features increase the likelihood of Lecturer 2, thus we can discern Lecturer 2 was rated higher in this regard which explains individualities of styles while delivering and communicating.
828 Aksjonenko and Aksjonenko
Figure 4: SHAP value violin plot (Aksjonenko and Aksjonenko, 2023).
DISCUSSION AND CONCLUSION A review and revision of the second question group would increase the relia- bility of the evaluation scale which would benefit for a future more efficient feedback system.
One of the key contributing factors is the lecturer’s use of the efficient class time and communication with organizations and lecturers while collecting the feedback – which ensures participation and motivation for providing full feedback.
Feedback result system described can be considered an effective and easy-to-facilitate option for goal and progress monitoring because of result- sharing options with participants involved (management), customers (stu- dents etc.), and lecturers (specialists, consultants, persons executing the training program).
Further research could explore – how can consistent and regular feedback collection in parallel with actions taken by parties involved – can improve motivation for keeping up behaviour and development of the culture that measures the goal reached both for participants and the organization in a synergetic way.
What Are the Key Components and Contributing Factors for Effective Feedback System 829
ACKNOWLEDGMENT
This research has been financed by the Project “R¯igas Tehnisk¯as universita- tes un Banku augstskolas doktorantu un akad¯emisk¯a person¯ala stiprin¯ašana strat¯e´gisk¯as specializ¯acijas jom¯as”, Nr. 8.2.2.0/20/I/008.
REFERENCES
Agbo, F. J., Olaleye, S. A., Bower, M. and Oyelere, S. S. (2023). Examining the relationships between students’ perceptions of technology, pedagogy, and cognition: the case of immersive virtual reality mini games to foster computational thinking in higher education. Smart Learning Environments, 10(1). Anseel, F., Beatty, A. S., Shen, W., Lievens, F. and Sackett, P. R. (2013). How Are We
Doing After 30 Years? A Meta-Analytic Review of the Antecedents and Outcomes of Feedback-Seeking Behavior. Journal of Management, 41(1), pp. 318–348. Bandura, A. (2002). Social Foundations of thought and action. In: The Health Psychology Reader. [online] London: SAGE Publications Ltd, pp. 94–106. Available at: https://books.google.lv/books?hl=en&lr=&id=PdY9o3l5vpYC&oi=fnd&pg= PA94&ots=uGiWoU-j7N&sig [Accessed 13 May 2023]. Borovoi, L., Schmidtke, K. and Vlaev, I. (2020). The effects of feedback valance and
progress monitoring on goal striving. Current Psychology. Chen, T. and Guestrin, C. (2016). XGBoost: A Scalable Tree Boosting System. Proceedings of the 22nd ACM SIGKDD International Conference on Knowledge Discovery and Data Mining - KDD ’16, pp. 785–794. Elert, N., Andersson, F. W. and Wennberg, K. (2015). The impact of entrepreneurship
education in high school on long-term entrepreneurial performance. Journal of Economic Behavior & Organization, 111, pp. 209–223. Kirkpatrick, D. L. (1959). Techniques for evaluating training programs: Part 2-learning. Journal of the American Society of Training Directors, 13(12), 21–26. Liang, K., Dunn, P., Howard, A., & Khananayev, S. (2016). Students’ assessment of experiential learning in an entrepreneurship curriculum: Expectations ver- sus outcomes. Journal of Small Business and Entrepreneurship Development, 28(1), 125. Liu, H., Kulturel-Konak, S. and Konak, A. (2021). A measurement model of entrepre-
neurship education effectiveness based on methodological triangulation. Studies in Educational Evaluation, 70, p. 100987. Liu, M., Gorgievski, M. J., Zwaga, J. and Paas, F. (2022). Understanding and motivating student feedback seeking: Insights from a lean startup based entrepreneurship program. The International Journal of Management Education, p. 100750. Lundberg, S. and Lee, S.-I. (2017). A Unified Approach to Interpreting Model Pre-
dictions. arXiv:1705.07874 [cs, stat]. [online] Available at: https://arxiv.org/abs/ 1705.07874 [Accessed 13 May 2023]. Ruskovaara, E. and Pihkala, T. (2014). Entrepreneurship Education in Schools: Empirical Evidence on the Teacher’s Role. The Journal of Educational Research, 108(3), pp. 236–249.
Read this individual research paper free through the original publisher, or explore the full digital proceedings book.
ISBN 978-1-958651-87-2
Explore this ISBN in the AHFE Bookstore ↗Listed in the July 2026 bookstore catalogue; search by ISBN to confirm current availability · Digital book purchase optional