In general, it is known that people's mental moods can be affected by changing their clothes.Though low self-esteem and mental disorders related to it have become a social problem in recent years, a simple way to change clothes may contribute to improving depressive symptoms. This study targets to improve self-esteem by changing clothing.There have already been a lot of studies to improve self-esteem. They include the use of social networking sites focusing on praise and the development of interactive technologies to improve young people's self-esteem. However, no method has been proposed to objectively judge whether people spend a daily life with themselves satisfied.Stress values are constantly changing. Their means and variances vary with activities. It implies there is a suitable stress value for each of them. We want to engage in some activities initiatively and are obliged to do others. The former has intrinsic stress while the latter an extrinsic. Even in the same activity, some people want to do it under high tension, while others want to do it in a relaxed manner. The paper introduces activity contexts classified with 2 dimensions related to stress. One dimension shows whether they are intrinsic or extrinsic, while the other presents whether the stress value is appropriate. The paper proposes an experimental method to discover the features of clothing that can improve self-esteem through the analysis of data collected from an activity tracker. Appropriate stress levels are considered to differ from person to person. The proposed method records stress values per subject and activity context, to calculate the appropriate stress value from the mean and variance of the stress values. The method regards items of clothing that bring long-lasting suitable stress values as ones that increase the self-esteem of the users and improve their performance. If the characteristics of clothing that improve self-esteem can be objectively identified from sensor data, a change of clothing into identified one can help reduce feelings of hopelessness and depression caused by low self-esteem. This method uses a multidimensional emotional scale of clothing to represent the characteristics of clothing. The experiment is carried out by collecting data using four questionnaires on the multiple affective states generated by dressing, the activity context, Rosenberg's self-esteem scale, and the apathy scale. The stress values, heart rate, and activity intensity are also collected from an activity tracker. The analysis is mainly based on the sensor data from the activity tracker. It reduces the effort on the subjects during the experiment.Sensor data on stress values from activity trackers are used as an indicator related to self-esteem. The stress state appropriate to activity status and clothes is predicted by a random forest model constructed from real data. As a result, it is found that people wearing clothing that makes them feel 'fulfilled' according to their assessment of self-esteem are more likely to be in an appropriate state of stress.The result is expected to play an effective means in alleviating symptoms of low self-esteem and depression.
In recent years, the decline in self-esteem and the increase of mental disorder have become social problems. Increasing self-esteem is important for peo- ple (Kernis, 2006). Various studies have already been carried out on how to improve self-esteem. For example, the interactive technologies to raise young people’s self-esteem have been developed (El-Darbi, 2013) and to raise self-esteem through the arts have been attempted (Chevalier-Amy, 2020).
By the way, there is a method of changing human affects with the psychol- ogy of cloth or social psychology of dress (Flugel, 1933). This shows that clothing can change human affects. Therefore, this study targets to improve self-esteem by changing clothing.
In addition, the psychology of clothe is a field that researches the cultural and social relationships between clothes and human beings in order to lead a fulfilling life in one’s own way. However, there is no way to objectively judge whether people spend a daily life with themselves satisfied. In order to solve this, we propose to use activity trackers in this study. The activity tracker is a wristwatch-type sensor and observes the wearer’s stress value as long as well as the heart rate and physical activity level. We analyse sensor data from the wearer’s activity tracker and identify the terms where the stress state is suit- able for the wearer’s current activity. The stress state is an index associating with the self-esteem. Depending on the current activity, our method regards that long-lasting suitable stress state improves self-esteem and the activity
Analysis of Clothing Features Improving Self-Esteem 773
performance. This makes it possible to find clothing features that improve the self-esteem objectively.
Wearing clothes with these characteristics can improve the self-esteem if we can objectively identify the characteristics of clothes that increase the wearer’s self-esteem through our method.
The Scales for Clothing and Stress Evaluation According to the psychology of clothe (Flugel, 1933), people can change their own emotions by changing their appearance. Making one’s appearance more agreeable to his/her liking or socially desirable can influence his/her behaviour (Davis and Lennon, 1988) and generally helps to improve his/her self-esteem.
A scale for examining the interrelationship between clothing and affect has been proposed as the scale for the multiple affective states generated by dressing (Saito, Nakagawa and Fujiwara, 1995).
This study uses this scale as a measure of assessment of clothing. For a measure of the self-esteem, this study does the stress level. It is already known that stress level changes are important and helpful in monitoring the self-esteem(Galanakis et al., 2016). In addition, methods for measuring stress values with activity trackers have already been established to some extent (Siirtola, 2019).
Hypothesis As we have discussed in above, it is already known that people’s emotions can be changed by their clothing.
The following two hypotheses are set out in this study.
There are common characteristics of clothing that improve people’s self- esteem
With mean µ and standard deviation σ, the appropriate stress value for a particular person in a particular activity context exists in the range of [µ −σ, µ + σ] Based on these two hypotheses, a questionnaire survey and activity tracker sensing were conducted to find clothing features that improve self-esteem.
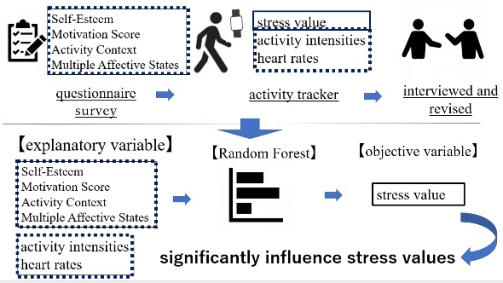
Figure 1 is a summary diagram of the methods used in this experiment. The method assumes that the subject chooses the clothes of the day and does not change clothes on that day.
On each day, a questionnaire was administered first, after which the sub- jects wore an activity tracker. At the end of the day’s experiment, the activity context is interviewed and revised.
Surveys can be divided into two categories: to get the characteristics of the subjects and to get the characteristics of their clothing.
The surveys to get the characteristics of the subjects are trait self-esteem scale values, motivation scores and activity context. The questionnaire on the trait self-esteem represents the Rosenberg Self-Esteem Scale (Rosenberg, 2011). That on the motivation is based on the Motivation Score (Kobayasi et al., 1998).
Figure 1: Summary diagram of the methods used in the experiment.
Questionnaire to obtain clothing characteristics is on a multiple states gen- erated affective by dressing scale (Saito, Nakagawa and Fujiwara, 1995). This scale assesses human feelings for clothing in a total of 35 words.
Activity trackers measure physical activity, heart rate and stress levels. The obtained data for all days are used to predict the results with a Ran- dom Forest model. The explanatory variable in the Random Forest model is the questionnaire results and the objective variable is the stress value. From these results, we find explanatory factors that strongly influence the stress level values.
Activity Context and Appropriate Stress Values Stress values vary depending on the situation. Therefore, stress value means and variances are likely to vary depending on what type of activity is carried out.
In this study, we analyse the acquired stress values on a per-subject and per- activity context basis. First, the average µ and the standard deviation σ of these stress values, divided per subject and per activity context, are deter- mined. In this study, stress values in the range [µ −σ, µ + σ] are referred to as the appropriate stress values for a subject in a given activity context.
The activity context has four stages depending on whether the activity is externally or intrinsically motivated. Externally, subjects are forced by others to perform activities, and intrinsically, they do it because they want to do it themselves.
The division of activities into externally or intrinsically motivated is seen as an important process for motivating subjects to pursue the activity. An activity that is enjoyable for one person may not always be enjoyable for another person, because the same activity may not always be enjoyable for another person. In line with this, it is expected that the level of appropriate stress values in each activity context will vary per person.
In light of the above, clothes with a longer duration of showing an appro- priate stress value are considered to be clothes that improve the performance of the subjects and increase their self-esteem.
Analysis of Clothing Features Improving Self-Esteem 775
Experimental Purpose and Method We carried out an experiment to discover the features of clothing that increase the self-esteem, following Figure 1. Our experiment consisted of a total of four questionnaires on the trait self-esteem, motivation, cloth- ing and activity context, and physical activity data collected by the Garmin. Of the questionnaires, the Rosenberg Self-Esteem Scale and the Motivation Score are used to obtain the characteristics of the subjects. The multi- ple affective states generated by dressing is for obtaining clothing char- acteristics, while the Activity Context is to collect the data the subject’s behaviour.
The experiments were conducted to six subjects, five females and one male, aged 19–22 years. We focussed on the characteristics of the subjects. We did not focus on gender differences. The six subjects are called as Subject A-F in below.
We carried out 1–4 times of experiments per each subject. Each experiment took 1 hour at least and 5 hours at most. Each experiment was conducted on a different day. The number of the experiments were 2 for Subject A, 4 for Subject B, 3 for Subjects C, D and F, and 1 for Subject E.
The questionnaire on the trait self-esteem was based on Japanese translation of the Rosenberg Self-Esteem Scale proposed in (Uchida, 2010). The answer for each question in the questionnaire was scored in 4 grades. Subjects with higher total scores have higher trait self-esteem.
The motivation questionnaire was based on the Motivation Score (Kobayashi et al., 1998). The Motivation Score questionnaire has originally been applied to the recipients of apoplexies during healing. We referred this questionnaire since it has been more useful for the recipients whose states of health are more closed to healthy. Subjects with higher total scores are more depressed.
Subjects with high total scores on the Rosenberg Self-Esteem Scale and low scores on the Motivation Scale are considered to be the healthiest mentally.
These questionnaires were only asked at the beginning of the first experiment, as they were given to identify the characteristics of the subjects.
At beginning of each experiment, the subject answered the questionnaire on the clothing which he/she is wearing in that day, and that on the activity contexts in the day. The clothing questionnaire consists of 35-word questions shown in Table 1. It shows the multiple affective states generated by dressing (Saito, Nakagawa and Fujiwara, 1995) translated by the author of this paper. The questionnaire at the experiment carried out in Japanese, which is the same language as the references.
Subjects were asked to select all the words that match their own feel- ings about their own clothes on that day from the list of 35 words based on the multiple affective state scale generated by dressing. The 35 words are grouped into the main categories shown in the top part of Table 1. The names of the main categories were not indicated to the subjects.
Table 1. The words in multiple affective states generated by dressing.
Table available in the original PDF paper.
2.fullfilment 3.firstclass feeling 4.relaxation of positive
1.cheerfulness and refreshingness Energetic Intelligent Proud At case Light New Steady Relaxed Uplifting Calm Superior Comfortable Refreshing Classy Aroused Relieved Sleeker more drawn Richer Gentler
To obtain the subjects’ activity contexts, we first asked them to respond in writing to one or more of their main activities for the schedule of the day at the start of each day’s experiment. Then, for each activity, they were asked to answer the activity context on four levels: hobby, somewhat hobby, somewhat obligatory and obligatory. The intrinsic activity contexts discussed in this section are corresponding to hobbyist. The extrinsic activity contexts correspond to obligatory.
Furthermore, after the end of each day’s experiment, we interviewed the subjects to determine what activities they have actually carried out and at what time of the day. If the actual context of the interviewed activity has been different from the pre-responded activity context, the actual activity context was recorded as the activity context.
The Garmin sensor, a wristwatch-type activity tracker, was worn on the subject’s wrist to acquire physical activity data. The data acquired by the device can be collected by an application on the smartphone and can be downloaded in a certain format called .fit from the official website. We converted it to an Excel file format with FitFileTool.
In the data, the stress values and heart rates are time series data recorded in every minute. For the activity intensity, the intensity s and time t of the exercise are recorded after a certain activity is detected by the device.
Experimental Result of Questionnaire The characteristic data of the subjects are shown in Table 2.
Table 2. Characteristic data of the subjects.
Table available in the original PDF paper.
Subjects Motivation Self-esteem A 16 23 B 17 14 C 20 21 D 19 21 E 15 26 F 25 16
Analysis of Clothing Features Improving Self-Esteem 777
In the references (Okada et al., 1998), a motivation score of 16 or more points was considered to be low motivation and a score of 30 or more points was considered high.
For the Self-Esteem Scale, they are recommended that a score of 20 or more should be considered low and a score of 30 or more should be considered high (Uchida, 2010).
However, as it is only a recommendation and we referred the inter-subject averages, in this study a motivation score of 20 or more is considered to be low motivation. the Self-Esteem Scale score of less than 18 points is considered to be low and that of 25 points or more is considered to be high.
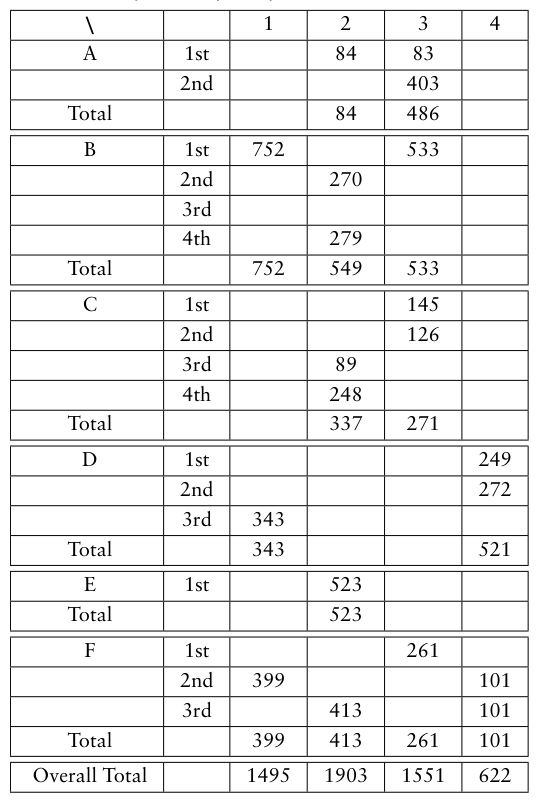
The time distribution over the whole period for each activity context obtained during the experiment is shown in Table 3. The codes 1–4 at the top of the table are codes for the activity context, where 1 represents duty, 2 does somewhat duty, 3 does somewhat hobby and 4 does hobby. The numbers in the table are represented by minutes.
Table 3. Activity context per experiment.
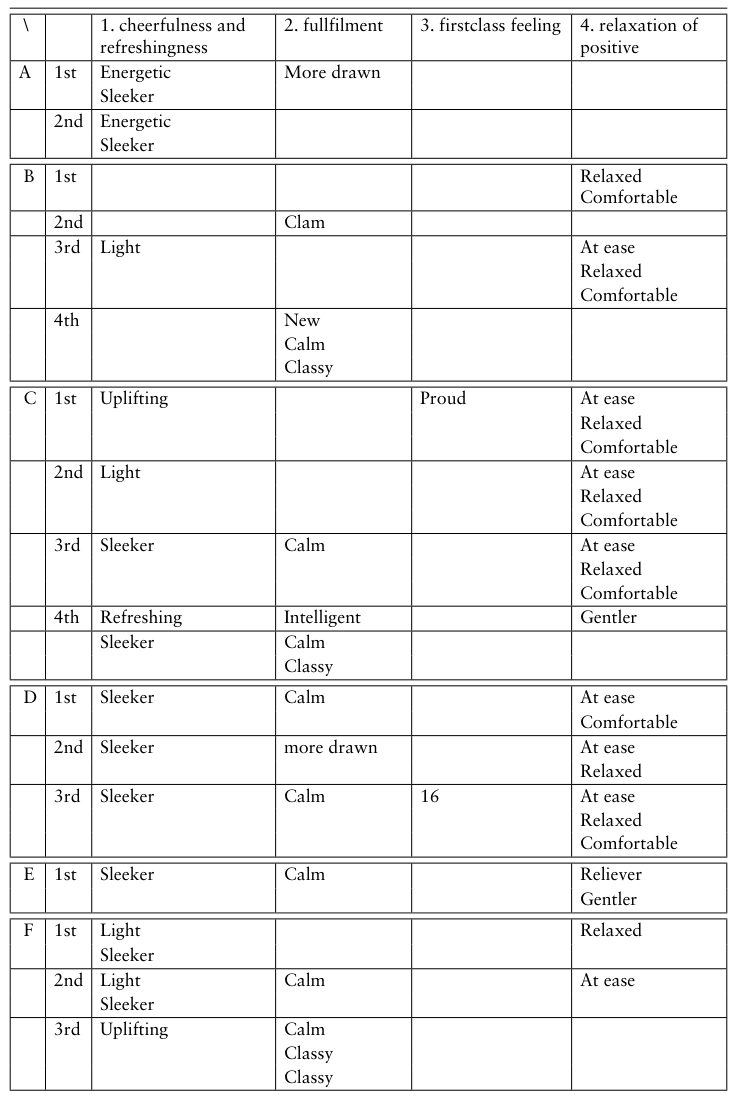
Table 4 shows the multiple affective state generated by each clothing per experiment session. This shows the words which each subject selected in the questionnaire on clothing in each experiment. The words are classified according to the main categories.
Table 4. Multiple affective states.
Analysis of Clothing Features Improving Self-Esteem 779
All the subjects selected the words belonging to the main categories “1. cheerfulness and refreshens”or “2. fulfilment”during the experiments. None of those belonging to “5. Depression and unsettled”, “6. shame”, or “7. Pressure and strain” were selected.
From these results and the testimonies of the subjects, it can be concluded that the subjects were successful in selecting clothes that they themselves believed would improve their performance to some extent.
Experimental Results and Pre-Processing of Sensor Data The three kinds of sensor data acquired are stress values, heart rates and physical activities. Each of the data was modified into a time series data with a 1-minute period. The method of filling in each missing value is as follows.
First, for stress values, values below zero can be regarded as missing values, or zero values due to cancellation with the activity intensity.In this study, all values below 0 were removed without completion as missing values, because there were few values below 0 originally and because only a very small number of subjects performed hard exercises during the experiments.
For heart rates, the missing values were replaced by the mean of the values immediately before and after the missing values.
An activity intensity is recorded after a certain amount of activity, with the amount of movement s and time t. Therefore, for each momentum data (s,t), the activity intensity during the term from the previous momentum data time t’ to time t was complemented with the momentum s.
Table 5 shows the results of the mean and standard deviation of the stress values for each activity context.The codes 1–4 in the top row of the table are codes for the activity context, where 1 represents duty, 2 somewhat duty, 3 somewhat hobby and 4 hobby. As predicted before the experiment, there was a significant variation in stress values from each activity context and from each subject.
Table 5. Stress values for each activity context.
Table available in the original PDF paper.
\ 1 2 3 4 Mean Standard Deviation
Mean Standard Deviation
Mean Standard Deviation
Mean Standard Deviation A 12.621 6.086 25.763 17.152 B 84.349 5.140 69.048 15.455 52.256 19.051 C 27.808 25.299 37.553 19.497 D 16.572 10.809 44.009 35.713 E 51.005 14.117 F 37.503 22.754 34.599 19.411 46.391 21.970 25.087 15.546
Table 6 shows a summarisation of the mean and standard deviation of the heart rates. Values in the range 80–90 are the most frequent. The aver- age heart- rates are similar (89.016 and 89.729, about 89) in both of the activity context 2 of Subject B and the activity context 3 of Subject C. However, the corresponding average stress values that are calculated with
reference to the heart rates are 69.048 and 37.553, showing a considerable difference.
Table 6. Heart rates for each activity context.
Table available in the original PDF paper.
\ 1 2 3 4 Mean Standard Deviation
Mean Standard Deviation
Mean Standard Deviation
Mean Standard Deviation A 66.742 8.077 80.457 20.912 B 93.403 16.556 89.016 28.912 86.262 15.341 C 83.496 21.438 89.729 17.138 D 70.297 19.681 76.722 30.141 E 84.977 20.033 F 90.779 17.269 85.322 13.017 84.925 13.780 84.401 9.330
Table 7 shows a summrisation of the means and standard deviations of the activity intensities. When compared to the other activity contexts, it was found that the momentum averages for activity context 2. somewhat oblig- atory were a little more similar among the subjects. The standard deviations are mostly between 30 and 40.
Table 7. Activity intensities.
Table available in the original PDF paper.
\ 1 2 3 4 Mean Standard Deviation
Mean Standard Deviation
Mean Standard Deviation
Mean Standard Deviation A 120.900 30.162 138.432 32.386 B 118.480 33.503 134.974 36.247 96.284 34.310 C 130.493 38.303 159.616 37.175 D 95.000 30.322 111.429 32.759 E 147.866 33.673 F 141.404 47.401 122.828 28.899 103.264 32.722 95.129 22.681
Specific Clothing Features That Improve Performance Based on the acquired data, we predicted the data for each subject using the Random Forest model. The purpose of the prediction is to find the important factors, especially associating with the clothing, to affect the stress. The stress is regarded to be related to the self-esteem, then activity performance.The explanatory variables are the features on the heart rates, those on the physical activities and theclothing characteristics given by the 35 words. The objective variable is the stress value.
Important Explanatory Variables Tables 8–12 shows the variable importance of the Random Forest model for each subject. The respective prediction accuracies were 0.864 for Subject A, 0.669 for B, 0.938 for C, 0.871 for D, and 0.850 for F.
Analysis of Clothing Features Improving Self-Esteem 781
“HertRate” represents heart rate, “CurrentActivityIntensity” represents activity intensity, “fight” represents motivation score and “Rosen” repre- sents self-esteem scale. The reason why the importance of the heart rate as an important variable is high is that the heart rate is based on the calcula- tion of stress values in Garmin. We could not obtain the important variables for Subject E because only one experiment (only one clothing and activity context) was conducted for E. For this reason, the table of Subject E is not available.
In summary, it was found that whether or not the clothing features belong- ing to “2. Fulfilled” were included (except Subject E) was an important variable in determining the prediction results for all subjects.
On the basis of these results, it was found that the appropriate stress values were shown when wearing “2. Fulfilled” clothing, as shown in Table 13. It shows the percentage of appropriate stress values. Percentages are calculated per subject and per activity context. The codes 1–4 in the top row of the table are codes for activity contexts, where 1 indicates duty, 2 somewhat duty, 3 somewhat hobby and 4 hobby. The table shows that the percentages of appropriate stress values are over 60% in all subjects and in all activity contexts.
Table 13. Percentage of appropriate stress values (wearing ‘fulfillment’).
Table available in the original PDF paper.
Subjects 1 2 3 4 A 0.667 0.699 B 0.667 c 0.733 0.646 D 0.773 E 0.667 F 0.604 0.642 0.842
Analysis of Clothing Features Improving Self-Esteem 783
The results show that people are more likely to be in appropriate stress when wearing clothes that they describe themselves as being in the ‘fulfill- ment’ category.
DISCUSSION
Table 14 shows the results of applying the RandomForest model with sensor data and questionnaire data for all respondents.
It shows the objective variables as stress values and the explanatory vari- ables as heart rate (HertRate), motivation score (fight), self-esteem (Rozen) and self-esteem scale for clothing. It can be inferred that the motivation score and wearing “2. fulfillment” clothing are important in predicting the stress level values.
This study attempted to identify clothing features that improve the self- esteem by analysing sensor data obtained by activity trackers. To find clothing features that improve the self-esteem, a RandomForest model was con- structed to predict changes in stress levels, which are said to be closely related to the self-esteem.
In this model, the stress values, heart rates, activity intensities, affect words and their categories for multiple affective states generated by dressing char- acteristics, subjects’ trait self-esteem scale values and motivation scores were used as explanatory variables.
The results show that people are more likely to be appropriately stressed when wearing clothes that they perceive to be in the ‘fulfilment’ category in the multiple affective scale for clothing. In the present experiment, the range of appropriate stress values was set to [µ −σ, µ + σ] based on the mean µ and standard deviation σ.
However, there is still room for further study on this range, which should be addressed in the future.
REFERENCES
Chevalier-Amy, N. (2020) ‘Becoming: How Expressive Arts Nurture Self- Esteem, Identity and Empowerment, Development of a Method’, in. Available at: https://www.semanticscholar.org/paper/Becoming%3A- How-Expressive-Arts-Nurture-Self-Esteem%2C-Chevalier- Amy/6e023fa783e8ff890f5a9537768d754641017bdd (Accessed: 21 April 2023). Davis, L. L. and Lennon, S. J. (1988) ‘Social Cognition and the Study of Clothing and Human Behavior’, Social Behavior and Personality: an international journal, 16(2), pp. 175–186. Available at: https://doi.org/10.2224/sbp.1988.16.2.175. El-Darbi, A. (2013) ‘How to Improve Self-Esteem Workshop’, in. Available
at: https://www.semanticscholar.org/paper/How-to-Improve-Self-Esteem-Works hop-El-Darbi/622ed7d7fc9e15346e3ed9f15c26dcef4e9fee44 (Accessed: 21 April 2023). Flugel, J. C. (1933) ‘The Psychology of Clothes’, The Sociological Review, a25(3), pp. 301–304. Available at: https://doi.org/10.1111/j.1467-954X.1933.tb01889.x. Galanakis, M. J. et al. (2016) ‘A Literature Review on the Connection between Stress
and Self-Esteem’, Psychology, 07(05), pp. 687–694. Available at: https://doi.org/ 10.4236/psych.2016.75071. Kernis, M. H. (ed.) (2006) Self-Esteem Issues and Answers: A Source- book of Current Perspectives. New York: Psychology Press. Available at: https://doi.org/10.4324/9780203759745. Kobayashi, S, et al. (1998) ‘Assessment of post-stroke motivational decline using a motivation score’, Stroke, 20(3), pp. 318–323. Available at: https://doi.org/10. 3995/jstroke.20.318 (in Japanese). Okada, K. et al. (1998) ‘Assessment of reduced motivation after stroke using moti-
vation scores’, Stroke, 20(3), pp. 318–323. Available at: https://doi.org/10.3995/ jstroke.20.318. Rosenberg, M. (2011) ‘Rosenberg Self-Esteem Scale’. Available at: https://doi.org/ 10.1037/t01038-000. Saito, E., Nakagawa, S. and Fujiwara, Y. (1995) ‘Construction of the Scale
for Measurement of Multiple Affective States Generated by Dressing’, Sen’i Kikai Gakkaishi (Journal of the Textile Machinery Society of Japan), 48(4), pp. T105–T112. Available at: https://doi.org/10.4188/transjtmsj.48.4_T105. Siirtola, P. (2019) ‘Continuous stress detection using the sensors of commercial smartwatch’, Adjunct Proceedings of the 2019 ACM International Joint Confer- ence on Pervasive and Ubiquitous Computing and Proceedings of the 2019 ACM International Symposium on Wearable Computers, pp. 1198–1201. Available at: https://doi.org/10.1145/3341162.3344831. Uchida, Tomohiro (2010) ‘An examination of the reliability and validity of the
Rosenberg Self-Esteem Scale: Using the Japanese version translated by Mimura & Griffiths’, Annual Review of Graduate School of Education, Tohoku University, 58(2), pp. 257–266. (In Japanese).
Read this individual research paper free through the original publisher, or explore the full digital proceedings book.
ISBN 978-1-958651-87-2
Explore this ISBN in the AHFE Bookstore ↗Listed in the July 2026 bookstore catalogue; search by ISBN to confirm current availability · Digital book purchase optional