Marie-Anne Pungu Mwange, Fabien Rogister, Luka Rukonic (2022). Measuring driving simulator adaptation using EDA. In: Human Factors and Simulation. AHFE Open Access, vol. 30, pp. 35–43. https://doi.org/10.54941/ahfe1001489
Most research about simulator adaptation focus on driving style and participants' comfort. However, in recent years, there is a growing interest in physiological data analysis as part of the user experience (UX) assessment. Furthermore, the application of machine learning (ML) techniques to those data may allow the automatic detection of stress and cognitive load. Previously, we noticed that new participants in experiments with our simulator were often in a constant state of tension. This prevented optimal training of our ML models as many of the collected data were not representative of a person's normal state.Our work focuses on improving driver's UX by keeping the cognitive load and stress at levels that do not interfere with the primary task of driving. We use a custom-made driving simulator as our testing platform and evaluate participants' emotional state with physiological signals, specifically electrodermal activity (EDA). EDA is the variation of the skin conductance created by sweat glands. It is linked to the sympathetic nervous system and is an indication of physiological and psychological arousal. We selected EDA because several studies have shown that it is a fast indicator of stress and cognitive load.To ensure that we are consistently collecting accurate data that could be fed to ML algorithms, we need to be able to correlate physiological reactions to external stimuli. We want to avoid them to be confused with general tension. Therefore, we need to determine the time it takes for most participants to physiologically adapt to our simulator. In this between-subjects study, we examined the impact of short time (ca. 10 min) exposures to the simulation and compared it with a longer exposure period (ca. 35 min).Another problem we faced was that some participants were too indisposed by driving in the simulator to complete testing sessions. Therefore, we needed to find a way to discriminate them during the recruitment process. Literature has shown that there might be a link between motion sickness and simulator sickness and in this study, we searched for a correlation between the motion sickness susceptibility questionnaire (MSSQ) and the self-reported simulator sickness using the simulator sickness questionnaire (SSQ).For our investigation, we recruited 22 people through an agency. They were divided in two groups. Group A (short-time exposures) had 10 participants between 25 and 69 years old (M=49.5; SD=17.1, 5 women, 5 men) and group B (long-time exposure) had 12 people between 28 and 65 years old (M=43; SD=12.8, 5 women, 7 men). We requested from the agency to recruit only active drivers of automatic transmissions cars as our simulator mimics this type of vehicle.Motion sickness susceptibility and discomfort felt in the simulator are moderately correlated. The coefficient value is 0.51. The number of participants of our study being small, further research is necessary to determine if the MSSQ can be used as a discriminator in the recruitment phase. In addition, we can conclude that a longer exposure of 35 min results overall in better physiological adaptation.
When driving a simulator for the first time, people go through a phase of adaptation. In this phase, they learn how to manipulate the commands, how the system reacts and immerse into the virtual environment. We can gene- rally consider them as having adapted when they reach the point where existing driving skills are successfully transferred to the simulator (Sahami et al., 2009). There are several methods to make sure that participants reach that point, such as driving a predefined practice distance, driving for a prede- fined practice time, or probing about their feeling of comfort. In our previous study (Rukoni´c et al., 2022), we used a combination of the latter two; there was a 10 to 15 minutes period of free drive, after which, we asked partici- pants if they felt comfortable using the simulator. If they did not, we extended this time.
However, all aforementioned methods show limitations, as they neglect people’s individual skills (Liebherr et al., 2020). To solve this problem, McGhee et al. (2004) suggested observing steering behavior and considered drivers to be adapted when they steer in a stable manner (e.g., no abrupt ste- ering wheel angle deviation or high amount of steering wheel reversals). This
approach showed an adaptation time of roughly 4 minutes. Thus, a timespan of more than 10 minutes should be adequate.
The problem we faced is that, despite participants being fully capable to control the vehicle, their physiological data showed that they remained very tense throughout the whole test. This state of tension was an issue because it concealed reactions to specific events behind the general strain. We have not seen this pattern with trained users yet.
Another recurring problem related to the usage of simulators is the simu- lator adaptation syndrome (SAS). It is the discomfort induced by a simulator, a well-known phenomenon akin to motion sickness (Gálvez-Garcia et al., 2020). Several participants experienced this trouble during their driving ses- sion, and we have evaluated it with the simulator sickness questionnaire (SSQ) (Kennedy et al., 1993; Walter et al., 2019). We think that SAS might have had an impact on their physiological state as well. Previous studies sho- wed that exposure duration and repeated exposure to a simulator influence the sickness (Kennedy et al., 2000; Teasdale et al., 2009).
COLLECTING PHYSIOLOGICAL DATA FOR MACHINE LEARNING Previously, we solved the problem by relying on other tools, such as UX questionnaires to evaluate participants’ subjective reactions to events in expe- riments. Nonetheless, we want to complement our assessment of the driver’s UX with more objective criteria based on users’ electrophysiological reacti- ons. The application of machine learning (ML) techniques to those data may allow the automatic detection of stress and cognitive load.
The main objective of this study was to determine the time it takes for participants to reach a state that is stable enough to allow ML algorithms to make the link between physiological reactions and external stimuli. Secondly, we looked for a correlation between the motion sickness susceptibility que- stionnaire (MSSQ) and the self-reported SSQ. In case the correlation exists, MSSQ could serve as a tool to discriminate participants that are too prone to SAS during the recruitment process.
MEASUREMENTS Electrodermal Activity to Assess Drivers’ State
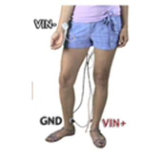
We decided to record the electrocardiogram (ECG) and electrodermal activity (EDA); as they are well-known indicators for stress, emotional responses and cognitive overload (Healey, 2000; Healey et Picard, 2005). We used a Bio- pac MP36R to collect this data. To accommodate participants’ modesty and minimize the driving inconvenience due to electrodes and cables, we decided to put the ECG electrodes using a Lead II setup (Figure 1). To respect the social distancing, participants placed the electrodes by themselves under our guidance.
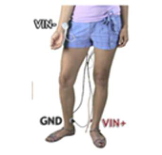
The simulator replicated an automatic transmission car and participants did not need to use their left foot to control the pedals. Thus, EDA electrodes were attached to the sole of their left foot (Figure 2) that was resting on a designated area. We based this placement on previous work that shows that
Measuring Driving Simulator Adaptation using EDA 37
Figure 1: The ECG electrode placement in Lead II setup extracted from Biopac (n.d.).Figure 2: EDA electrode placement extracted from Tobii pro (n.d.).Figure 3: Example of EDA signal.
Figure available in the original PDF paper.
it gives good results for emotional response measurement (Van Dooren et al., 2012). In this study, we chose to focus on the EDA. The heart rate and its vari- ability, extracted from the ECG, might be topics for future work. EDA (also known as GSR or galvanic skin response) is the variation of the skin conductance created by sweat glands in the extremities. It is linked to the sympathetic nervous system and is an indication of physiological and psych- ological arousal (Biopac, 2015). An EDA signal consists of a succession of peaks that correspond to emotional responses (Figure 3). The responses can be either spontaneous or generated by external events.
Self-Reported History of Discomfort and Perception In addition to EDA, we assessed participants’ sensitivity to motion sickness with the short version of the MSSQ in French (fMSSQ, Paillard et al., 2013) before the start of the test. Before and in-between driving sessions, they also filled out the French version of the SSQ to indicate the evolution of their potential discomfort.
EXPERIMENTAL DESIGN Apparatus
Participants operated a fixed simulator composed of a customized version of CARLA, an open-source simulation environment based on Unreal engine
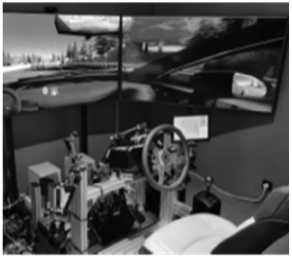
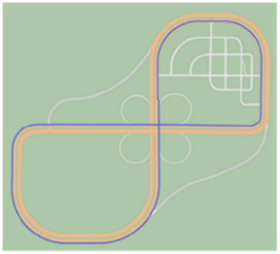
Figure 4: Simulator setup.Figure 5: Map used in our scenarios.
(Dosovitskiy et al., 2017). It was displayed on three large 50-inch-curved scre- ens. We added an adaptable car seat and a Fanatec set of a steering wheel, a gear shifter and pedals (Figure 4). Aiming at a high level of immersion, black curtains and soundproof panels were set around the simulator. We installed two 4K cameras, an AISIN Driver Monitoring System (DMS - a high reso- lution infrared camera that will be mounted in real cars in the future) and a microphone to oversee and record the experiment. To give participants some help on the path to follow when necessary, they had a small screen on their right side to mimic a navigation system. We used a tailor-made software suite that was developed internally to create the test scenarios and run, record and analyze the test sessions.
Experimental Scenarios We created two different scenarios, and they both used the same map (Figure 5):
A very simple scenario (scenario 1) on the highway, where the driver was driving alone.
A more complex and realistic scenario (scenario 2) starts in a city, with pedestrians and traffic lights, and then, participants were instructed to
Measuring Driving Simulator Adaptation using EDA 39
enter the highway and drive on an infinite loop with sharp curves. This scenario had moderate traffic.
Procedure Before the experiment, we informed participants that they would be conne- cted to electrodes and roughly informed them of the electrodes’ placement. When they arrived, we welcomed them and handed out a consent form explai- ning the types of data collection and how we would use it. Then, we explained how to place the electrodes according to the previous description, while we supervised them. After, they connected the electrodes to the Biopac and adju- sted their seating. Afterward, they filled out the fMSSQ and then the first SSQ, to render the first score of their general state, before they sit in the simula- tor. After that, we introduced the simulator and how to operate it. Before they started driving, they had five minutes of relaxing time with the soothing music of their choice.
The first driving session was a 5-minute free drive on the simulator with scenario 1. Drivers received no specific instruction on how and where to drive. Afterward, they gave their first impression and filled the second SSQ. Then they had another relaxing time with the same conditions as before.
The second drive used scenario 2. We asked participants to drive as nor- mally as possible and respect a 90 kph speed limit. The duration of this session is discussed in next section. After the drive, they completed SSQ again and had another relaxation session.
The third and last session used scenario 2 as well, the driving instructions were the same as the previous one. The main difference was that drivers were asked to perform some tasks by a voice agent, which was simulated by the test moderator using the Wizard of Oz technique. Each one of them lasted about 2 minutes and upon completion, the voice agent instructed participants to keep on driving.
The first task was an auditory Stroop test (Knight et al., 2017). Dri- vers heard male and female voices pronouncing gendered words and other words with very similar sounds (“homme”, “pomme”, “gomme”, “femme”, “dame”, “gamme”, “fille”, “fils”, “file”) with an increasing rate (between 1s and 0.6 second) and in between the words they heard, they had to quickly infer the gender of the speaking voice.
The second task was a numerical exercise of counting backward in leaps of 3 starting from a 3-digit number. Participants who quickly finished this task in less than 2 minutes were asked to count backward in leaps of 7 starting from another number.
The last task was a wordy test. They had to spell words of increasing length backward.
The goal of these tasks was to generate stress or increase the cognitive load that would be significant enough to be visible in the EDA signal. The time between tasks lasted 3 minutes, as this is supposed to give the participant enough time to overcome the arousal generated by the task.
The overall session lasted between 16 and 18 minutes. After which, we asked participants to fill out the last SSQ form followed by a quick discussion about the whole experience.
Experimental Groups To investigate the impact of the familiarization session (second drive) on participants’ adaptation, we assigned them to two groups with different familiarization durations:
One group (group A) had a short session of 5 min
The other group (group B) had a longer session of 30 min To understand the impact of repeated exposure, we asked a subgroup of 6 participants from group A to come back and redo the whole experiment within 1 to 3 days.
Participants 22 people took part in this study. Both male and female, between 25 and 69, of all age groups. They were all in possession of a driving license and active drivers familiar with automatic transmission cars. They were recruited by an agency and received a 100 € incentive. Group A had 10 participants between 25 and 69 years old (M=49.5; SD=17.1, 5 women, 5 men) and Group B had 12 people between 28 and 65 years old (M=43; SD=12.8, 5 women, 7 men). Apart from one participant, they reported good general health conditions and had corrected or no impaired vision.
TREATMENT AND RESULTS During the first two sessions, we observed the general aspect of the collected signals. We gave more attention to the last drive, because of the mental effort that was generated by secondary tasks. We analyzed recorded EDA signals using the Python NeuroKit2 library to remove noise and artifacts due to mea- suring conditions. Afterward, we examined the signals to see if we could link EDA responses to tasks and fed them to our ML algorithms for classification.
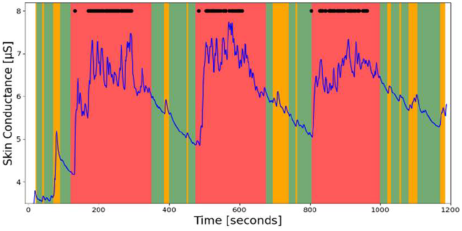
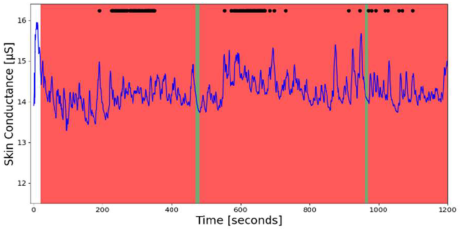
We considered a participant as having adapted when the EDA signal did not show many overreactions that could not be linked to an event. Overall, the signal of adapted people shows very distinctive zones when treated by our ML algorithm (Figure 6). Oppositely, people who have not adapted have big zones of high cognitive load (Figure 7).
Out of the 10 drivers of group A:
3 participants had a bad signal that could not be analyzed
5 showed good adaptation to the simulator. We have to emphasize that amongst these adapted drivers, one of them refused to interact with the voice agent other than to indicate that the interactions were too stressful and completely refused to answer afterward.
In comparison, group B, with 12 drivers:
2 participants had a signal that could not be analyzed
One participant had to stop after the first task of the last drive due to discomfort. He had vision issues.
9 good adaptations.
Measuring Driving Simulator Adaptation using EDA 41
Figure 6: Example of the EDA signal of an adapted person, after treatment by our ML algorithm. Each dot corresponds to the driver interacting with the voice agent. Green zones are classified as non-stressful, orange zones are stressful responses and red ones are high cognitive load.Figure 7: Example of the EDA of a driver that did not adapt.Table 1. Average MSSQ and SSQ score evolution during the experiment.
Table available in the original PDF paper.
Average MSSQ Average SSQ after 1st drive
Average SSQ after 2nd drive
Average SSQ after 3rd drive Group A 5 8 9 17 Group B 7 18 33 41
Six participants from group A that came back to repeat the experiment showed no significant improvements. Those who adapted had a slightly bet- ter adaptation and sometimes less recovery time between tests but those who did not adapt the first time were still not adapted on the second trial. How- ever, they all reported feeling significantly better, as the SSQ score after the first drive on the first day was 14 but dropped to 2 on the second day. On the other hand, the discomfort of participants in group B grew a lot more than those of group A after the second drive, as shown by the average SSQ score (Table 1). In general, when participants had a baseline SSQ score that was not null, it tended to decrease when they were in group A, but increase strongly when they were in group B. This can be due to the monotony of the highway loop they had to drive on, as suggested by some of our participants.
Regarding the link between motion sickness susceptibility and discomfort, our study estimates it to be moderate. The Pearson’s correlation coefficient between the MSSQ score and the SSQ score after the first drive is 0.51. The
only participant that dropped out of the experiment, P20, had an MSSQ score of 5.6, which was not the highest across all participants. The participants with the highest MSSQ, P15 and P21, had quite high scores of SSQ after the first drive but for P15, this score dropped by the end of the experiment while it rose for P21 (Table 2).
CONCLUSION
Simulator adaptation measured by EDA is in its beginning. Our results sug- gest that a 35 minutes long drive gives enough time for participants exposed to a simulator for the first time to adapt. However, there is a tradeoff to make, as this makes the experiment less comfortable. We suggest that other researchers reproduce this study with less redundant circuits to see the impact of the trajectory itself. In addition, the number of participants of our study being small, further research is necessary to determine if the MSSQ can be used as a discriminator in the recruitment phase.
ACKNOWLEDGMENT
The authors acknowledge the support by the project VIADUCT under the reference 7982 funded by Service Public de Wallonie (SPW), Belgium.
REFERENCES
Biopac Systems Inc (2015), EDA introductory guide. Biopac website: https://www.biopac.com/wp-content/uploads/EDA-Guide.pdf Biopac Systems Inc (n.d.), Introductory ECG Guide. Biopac website: https://www.biopac.com/wp-content/uploads/ECG-Guide.pdf Dosvitsky, A., Ros, G., Codevilla, F., Lopez, A., and Koltrun, V. (2017), “CARLA: an open urban driving simulator”, Conference on Robot Learning (CoRL), pp. 1–16. Gálvez-Garcia, G., Albayay, J., Bascour, C., and Fonseca Oyarzún, F. (2020),
“Joint and individual effectiveness of galvanic cutaneous stimulation and tactile stimulation at decreasing Simulator Adaptation Syndrome”, PLoS ONE Healey, J.A. (2000). “Wearable and Automotive Systems for Affect Recognition from Physiology”, PhD Thesis, Massachusetts Institute of Technology Healy, J.A., and Picard, R.W (2005). “Detecting stress during real-world dri-
ving tasks using physiological sensors”, IEEE Trans. Intell. Transp. Syst., 6(2), pp. 156–166. Kennedy, R.S., Lane, N.E., Berbaum, K.S., and Lilienthal, M.G. (1993). “Simulator sickness questionnaire: An enhanced method for quantifying simulator sickness”, International Journal of Aviation Psychology, 3(3), pp. 203–220.
Measuring Driving Simulator Adaptation using EDA 43
Kennedy, R.S., Stanney, K.M., and Dunlap, W.P. (2000). “Duration and Exposure to Virtual Environments: Sickness Curves During and Across Sessions”, Presence Teleoperators & Virtual Environment, 9(5), pp. 463–472. Knight, S., and Heinrich, A. (2017). “Different Measures of Auditory and Visual
Stroop Interference and Their Relationship to Speech Intelligibility in Noise” Frontiers in Psychology, vol. 8, p. 230. Liebherr, M., Schweig, S., Brandtner, A., Averbeck, H., Maas, N., Schramm, D., and Brand, M. (2020), “When virtuality becomes real: relevance of mental abilities and age in simulator adaptation and dropouts”, Ergonomics, 63(4), pp. 1–13. McGehee, D.V., Lee, J.D., Rizzo M., Dawson, J., and Bateman, K. (2004). “Quan-
titative analysis of steering adaptation on a high performance driving simula- tor”, Transportation Research Part F: Traffic Psychology and Behaviour, 7(3), pp. 181–196. Paillard, A.C., Quark, G., Paolinio, F., Denise, P., Paolino, M., Golding, J.F., and Ghulyan-Bedikian, V. (2013). “Motion sickness susceptibility in healthy subje- cts and vestibular patients: Effects of gender, age and trait-anxiety”, Journal of Vestibular Research, vol 23, pp. 203–210 Rukoni´c, L., Pungu Mwange, M., and Kieffer, S. (2022), “Teaching Drivers about
ADAS using Spoken Dialogue: A Wizard of Oz Study”, 6th International Confe- rence on Human Computer Interaction Theory and Application (HUCAPP). Sahami, S., Jenkins, J., and Sayed, T. (2009), “Methodology to Analyze Adaptation in Driving Simulators”, Transportation Research Record, vol. 2138, pp. 94–101. Teasdale, N., Lavallière, M., Tremblay, M., Laurendeau, D., and Simoneau, M.
(2009). “Multiple exposition to a driving simulator reduces simulator symptoms for elderly drivers”, proceedings of the Fifth International Driving Symposium on Human Factors in Driver Assessment, Training and Vehicle Design, Big Sky MT, United States. Tobii Pro (n.d.), Recommended GSR electrode locations. Tobii pro website: https://www.tobiipro.com/learn-and-support/learn/steps-in-an-e ye-tracking-study/setup/gsr-electrode-locations/ Van Dooren, M., deVries, J.J., and Janssen, J.H. (2012). “Emotional sweating across
the body: Comparing 16 different skin conductance measurement locations”, Physiol Behav, 106(2), pp. 298–304. Walter, H., Li, R., Munafo, J., Curry, C., Peterson, N., and Stoffregen, T. (2019), APAL Coupling Study, University of Minnesota.
LISTED IN THE AHFE DIGITAL BOOKSTORE CATALOGUE
Explore the complete digital volume
Human Factors and Simulation
Read this individual research paper free through the original publisher, or explore the full digital proceedings book.
ISBN 978-1-958651-06-3
Explore this ISBN in the AHFE Bookstore ↗Listed in the July 2026 bookstore catalogue; search by ISBN to confirm current availability · Digital book purchase optional