Danielle Benesch, Tanya Paul, Alexandre Marois (2024). Training stress models on open-access data for a continuous human state monitoring platform. In: Neuroergonomics and Cognitive Engineering. AHFE Open Access, vol. 126, pp. 34–44. https://doi.org/10.54941/ahfe1004736
Stress can be an indicator of discomfort with a task, which is of relevance for training in safety-critical fields. Knowing a trainee’s stress level could be especially useful when objective performance outcomes are unclear or when success in training tasks alone is insufficient to predict proficiency in real-life safety-critical scenarios. In this study, stress classification models trained on open-access physiological data and integrated in Sensor Hub, a multi-sensor system for near real-time monitoring, were developed. To obtain ground-truth neurophysiological data recorded under high-stress conditions, raw electrocardiogram (ECG) and respiration data in an open-access database sourced from PhysioNet, consisting of 57 participants with arachnophobia watching spider videos, was used. Machine learning algorithms were trained on features extracted from these raw signals. A first set of algorithms focused on heart rate, respiratory rate, and heart rate variability (HRV) features. The second set included feature normalization according to an individual’s baseline. Models based on individually normalized features reached balanced prediction accuracy >80%. A pilot data collection was conducted with a different sensing device than the device used to obtain these measures. Qualitative analysis revealed that real-time R-R intervals from the new sensors were sensitive to artifacts, suggesting that the model relying on HRV features may not be reliable. The model that used only the baseline normalized heart and respiratory rate was selected as the final choice, exported in the Open Neural Network Exchange format and integrated into the Sensor Hub platform, providing predictions every second. This research demonstrates the potential of open-access data for providing a solid starting point for training cognitive models, while also highlighting the necessity of real-time testing to confirm that models can generalize across different sensors and processing pipelines.
Psychological stress is a condition that can importantly affect behavior. It can be defined as “a particular response of an organism to an identified demand stimulus” arising when one experiences a situation that “exceeds his or her real or perceived abilities to successfully cope with the demand, resulting in disturbance to his or her physiological and psychological equilibrium” (Kolbell, 1995, p. 31). Stress can be experienced in the workplace (Colligan
and Higgins, 2006). Indeed, stress has been widely observed across multi- ple operational domains, particularly in high-stake and extreme domains such as air traffic control (Hodgetts et al., 2015), pedestrian traffic work (Marois et al., 2018), piloting (Dehais et al., 2014) and public safety oper- ations (Queirós et al., 2020). These domains are typically characterized by important cognitive challenges pertaining to multitasking, cognitive overload and distraction, which are all prone to errors. Moreover, errors in these domains may pose great risks upon people and infrastructure, which can further increase the pressure experienced by operators. However, experience and comfort with a task may reduce the stress experienced by operators in such domains. As such, psychological stress could represent a key indicator of comfort and proficiency on a given task, particularly for trainings in safety- critical fields. The current research was specifically interested in developing a stress prediction model to be applied for training public safety personnel.
Continuous stress monitoring emerges as a valuable tool for improv- ing and individualizing training, offering instructors a more comprehensive understanding of each student’s overall task comfort and enabling timely interventions based on stress levels at specific moments. Different strategies can be favored for monitoring stress. Subjective reports, either from an exter- nal rater or in the form of a self-report, can first be used. This strategy is often used, relying on a variety of scales which have been validated empiri- cally (Massood et al., 2012). Self-reported measures are however difficult to integrate for real-time assessments; they often require an operator to interrupt their tasks to answer questions about their state, which may hinder perfor- mance on the task. Furthermore, such a metric may sometimes be biased (Sato and Kawakara, 2011). Neurophysiological recordings represent an alterna- tive to these types of measures. Recent advancements in sensors’ mobility and edge computing capacities have allowed for a plethora of new appli- cations for human state monitoring, including for the online evaluation of stress.
Data collected by physiological monitoring tools can be turned into action- able information to provide a person’s cognitive, medical or operational portrait in a real-life situation if proper high-level contextual information is provided. For instance, Berka et al. (2010) presented an accelerated train- ing strategy based on an interactive neuro-educational technology, exploiting electroencephalography power bands as well as heart activity. Marksman- ship trainees’ ideal state for firing a weapon was identified thanks to these measures. Training performance of marksmen supported by the neuro- educational technology improved significantly more from baseline to final trials compared with control marksmen performing the training without aid. According to the authors, such an improvement was driven by a lower state of stress, increased alertness and better match between state and task demands. Similarly, Krätzig et al. (2021) relied on heart rate measures as indicators of stress management among police officers taking part in an advanced reactive shooter course. Overall, such work shows how physiological monitoring can contribute to improve training efficiency.
Recognizing the potential of using non-invasive wearable sensors to assess stress continuously throughout training, previous work led to the
development of a near real-time data integration, synchronization, and pro- cessing nexus to use for training applications. In Marois et al. (2023), we presented the different steps carried out to develop a context-adapted monitoring solution for public safety personnel training, driven by users’ needs. The solution developed relied on a set of sensors including: a smart garment with electrocardiography (ECG), respiration and acceleration com- ponents; a smartwatch with notification, accelerometer and monitoring capacities; a wearable recording functional near-infrared spectroscopy; and a phone equipped with a GPS, a camera and a microphone. Using the Sen- sor Hub solution (i.e. a multi-sensor system for near real-time monitoring; Gagnon et al., 2014), data collected from these sensors can be persisted and processed to extract features for the real-time prediction based on an ensem- ble of machine learning models. As outlined by subject-matter experts from two Canadian public safety organizations, such models should be able to predict and depict stress levels of trainees. As such, from the predictions pro- vided by the Sensor Hub, a dashboard was developed with the capacity to provide views for live monitoring, after action review and analysis.
The goal of this study was to develop stress classification models that could be integrated into the Sensor Hub to provide actionable information for train- ing public safety personnel. To develop a proof-of-concept model of stress based on the raw physiological signals currently available in Sensor Hub, we relied on an open-access database representing instances of stress among a population of spider-fearful individuals exposed to spider videos (Ihmig, Gogeascoechea, Neurohr-Parakenings et al., 2020). ECG and respiration data were collected from the participants. Different machine learning tech- niques were used to develop stress prediction models according to a series of features extracted from the ECG and respiration data, such that the combina- tion of cardiorespiratory features can be used to generate a higher-level metric (i.e., stress) that is more easily interpretable by instructors than individual features alone.
METHOD
Participants Recruitment took place at Saarland University in Germany. Eighty spider- fearful participants took part in the study (age range: 18–40); however, the recordings of 57 participants are publicly available on PhysioNet. Of these 57 participants, 53 participants were included in the current analysis, after discarding the recordings of four participants due to missing values.
Procedure After having provided informed consent, all participants were exposed to 16 1-min spider video clips sampled from TV documentaries showing detailed shots of spiders. Before starting the exposure session, participants went through a 1-min demo clip. Clips 1–8 and clips 9–16 were grouped and pre- sented in a random order. After each clip, participants were asked how many spiders were presented in the clip. A 5-min relaxation period followed the presentation of all 16 clips.
Training Stress Models on Open-Access Data 37
Material and Apparatus Throughout the experiment, participants’ ECG, respiration, and electroder- mal activity signals were collected with a BITalino biosignal measurement device (PLUX – Wireless Biosignals S.A., Lisbon, Portugal) at a sampling fre- quency of 100 Hz. ECG electrodes were placed according to a standard lead II configuration, and respiration was measured using a chest strap with a piezo- electric sensor. The current analysis did not include electrodermal activity signals, as these are not recorded by the wearable devices already integrated into the Sensor Hub platform.
Data Processing and Analysis Several steps were carried out to process the data prior to model training (raw data can be found in Ihmig, Gogeascoechea, Schäfer et al., 2020). First, data from two periods was selected and labelled as two within-subject conditions: a) the first 5 minutes of the exposure session was selected for the high stress condition (aiming to reduce possible habituation to the stimuli); and b) the 5 minutes of the resting period at the end of the experiment was selected for the low stress condition, such that the two conditions used equal-length segments.
Signals from these two time-windows were then preprocessed. Prepro- cessing and feature extraction was performed using version 0.2.7 of the open-source Neurokit2 Python library (Makowski et al., 2021). The library’s default algorithms for ECG and respiration were applied: The raw signals were first filtered to reduce noise, from movement or powerline interference, for example. A 0.5-Hz high-pass Butterworth filter was used for filtering the ECG signal, followed by filtering out powerline interference. The respiration signal was filtered using a band-pass Butterworth filter with cutoffs of 0.5 Hz and 3 Hz. Peaks were detected from the ECG and respiration signals to extract the heart and respiratory rate, respectively.
Following the initial preprocessing of signals, further features were extracted. In addition to the heart and respiratory rate, two heart rate variability (HRV) features were extracted: high-frequency power, between 0.15-Hz and 0.4-Hz, and low-frequency power, between 0.04-Hz and 0.15-Hz. To account for inter-individual variability in physiology, such as an individual’s resting heart rate, normalization of physiological features according to each individual was implemented, a common preprocessing step in stress classification (Giannakakis et al., 2019; Nardelli et al., 2015; Ollander et al., 2016; Parent et al., 2019). This involved dividing each feature value by a reference feature value (Parent et al., 2019), which was calcu- lated by taking the mean of the feature values from the two conditions (“high stress” and “low stress”) for each participant. This individual-based normal- ization was applied to all the features (i.e. the heart rate, respiratory rate, high-frequency HRV and low-frequency HRV).
Despite the common use of HRV features and individual-based normal- ization in stress classification, it is important to acknowledge their potential risks for the envisioned real-time monitoring context. HRV features can be sensitive to artifacts and missing data (Baek & Shin, 2017; Cajal et al., 2022), which are often present in data collected outside of controlled laboratory
conditions. Furthermore, while normalization was possible using the entire recording from the current training dataset, the optimal method for imple- menting baseline normalization in real-time scenarios, where only historical data can be used, remains to be determined (Mishra et al., 2020). In light of these considerations, machine learning models were developed using different groups of features to evaluate the trade-offs of incorporating HRV features and individual-based normalization. Four feature sets were selected: a) using only the heart and respiratory rates (Rate only models); b) using the heart rate, respiratory rate and HRV power features (Rate and HRV models); c) using only the normalized heart and respiratory rates (Normalized rate mod- els); and d) using the normalized heart rate, respiratory rate and HRV power features (Normalized rate and HRV models).
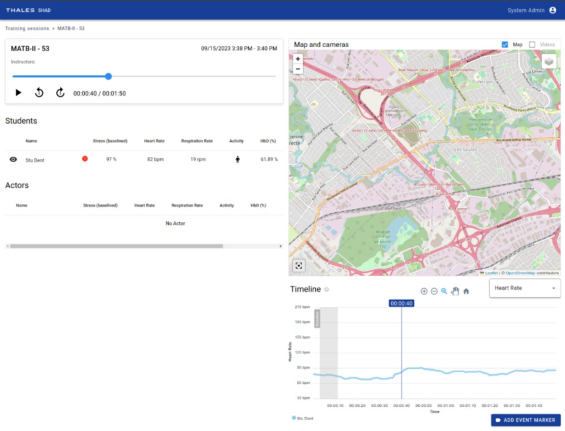
For all four feature sets, two classification algorithms were selected, namely a random forest classifier and a logistic regression, each using the default hyperparameters from the Scikit-Learn Python library. Given limited data for model optimization, these two algorithms were chosen to compare a simpler linear classifier to a more complex non-linear classifier. We used 10- times repeated 5-fold participant-wise cross-validation to obtain the model performance, which randomly partitioned the data into five folds 10 times, aiming to maximize the use of the available data for both training and testing and reduce the variance in the performance estimate. This procedure gener- ated 50 random forest classifiers and 50 logistic regression models for each feature set. Based on the feature set and algorithm combinations with the highest mean balanced accuracy, the best models were exported in the Open Neural Network Exchange (ONNX) format and integrated into the Sensor Hub platform (see the dashboard shown in Figure 1; cf. Marois et al., 2023), in order to provide predictions every second.
Figure 1: Dashboard showing model predictions and data collected from one partici- pant using the monitoring solution for public safety personnel training.
Training Stress Models on Open-Access Data 39
RESULTS
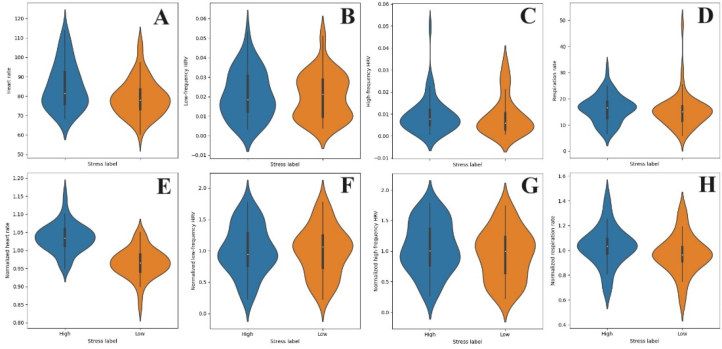
Each feature extracted from the ECG and respiration signal was first analyzed (see Figure 2). Differences in distribution pattern could be observed for the heart rate and, to some extent, the respiration rate features. Paired-sampled t-tests were performed to compare both high stress and low stress conditions. The average heart rate value was significantly higher in the high stress condi- tion (M = 85.21, SD = 11.88) than in the low stress condition (M = 79.28, SD = 9.45), t(51) = 6.20, p <0.001, Cohen’s d = 0.86. The same pattern was observed for the normalized heart rate measures with higher values for the high stress condition (M = 1.03, SD = 0.04) as opposed to the low stress condition (M = 0.97, SD = 0.04), t(51) = 6.18, p <0.001, Cohen’s d = 0.86. The other tests performed on the other features failed to reach significance, ts < 1.47, ps > 0.147, Cohen’s ds < 0.21.
Figure 2: Distribution of all features extracted from the ECG and respiration signal according to the stress condition (A: heart rate; B: low-frequency HRV; C: high- frequency HRV; D: respiratory rate; E: normalized heart rate; F: normalized low- frequency HRV; G: normalized high-frequency HRV; and H: normalized respiratory rate).
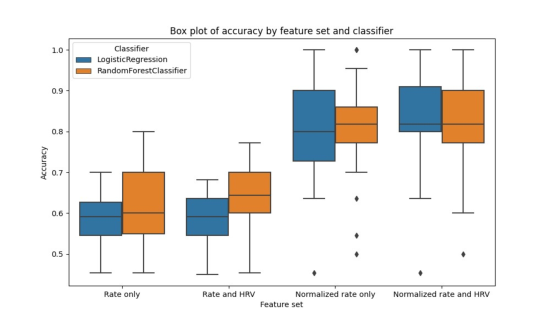
The features were then used as inputs for the machine learning models. Results for the eight types of models are presented in Figure 3. As depicted, random forest classifiers generally outperformed the logistic regression mod- els. The best performance was observed across the Normalized rate and HRV models, more specifically with logistic regression, reaching a mean balanced accuracy of 83.7% (SD = 10.85), followed by the random forest using the same feature set (M = 82.18%, SD = 10.40). The set of Nor- malized rate models performed similarly (logistic regression: M = 80.16, SD = 10.29.; random forest: M = 80.86, SD = 9.71). The models contain- ing non-normalized features, however, performed poorly. The mean balanced accuracy for the Rate only models was 58.05% (SD = 5.74) for logistic regression and 63.08% (SD = 8.95) for the random forest. For the Rate and HRV model, mean balanced accuracy for logistic regression and the random forest was 58.78% (SD = 5.88) and 64.45% (SD = 7.80), respectively.
Figure 3: Box plot depicting the balanced accuracy on unseen participants for the four approaches depending on the type of machine learning model for the prediction of high vs. low stress state.
Consistent with Benavoli et al.’s (2017) method for comparing the perfor- mance of multiple classifiers, a Bayesian analysis was used to evaluate the balanced accuracies of each type of model generated across the 50 iterations. A repeated-measures factorial analysis of variance (ANOVA) Bayesian equiv- alent test was performed with a 2 (classifier: logistic regression vs. random forest) × 4 (feature set: Rate, Rate and HRV, Normalized rate, and Normal- ized rate and HRV). The test provided strong evidence favoring an effect of the two factors. As shown in Table 1, the data observed are about 1.06×1053 times more likely under the full model comprised of the two factors and of their interactions than under the null model (for details on the interpretation of the Bayesian analysis, see van den Bergh et al., 2020). Additional anal- ysis supported that, among the non-normalized models, the random forest models yielded higher balanced prediction accuracies (with BFs01 < 0.022, providing evidence against the null hypothesis), as opposed to the normal- ized models which were statistically equivalent from one model to another (with BFs01 > 3.380, favoring the null hypothesis). Normalization of the data yielded higher balanced accuracies as each non-normalized model (e.g., the Rate only model) was statistically outperformed by its normalized model equivalent (e.g., Normalized rate only).
Table 1. Model comparison for all models under the consideration for the data.
Table available in the original PDF paper.
Model p(M) p(M|D) BFM BF01 %error 0.20 >0.99 1468.15 1.00 - Classifier + Feature set + Classifier * Feature set
0.20 <0.01 0.01 406.43 2.24
Classifier + Feature set Feature set 0.20 2.63×10⁻⁴ <0.01 3786.69 2.38 Classifier 0.20 8.61×10-52 3.44×10-52 1.16×1052 2.15 Null model 0.20 8.61×10-52 3.78×10-53 1.06×1053 1.82
Training Stress Models on Open-Access Data 41
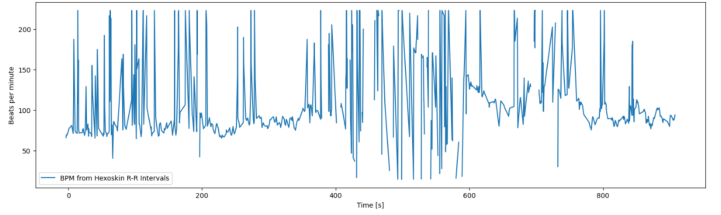
A pilot data collection was conducted with a different sensing device used for heart rate, respiratory rate, and HRV than the device used to obtain these measures in the open-access database. More precisely, signals were collected with a Hexoskin garment worn by Thales Research & Technology employees as part of their work on this project. Qualitative analysis of the collected data revealed that real-time R-R intervals generated from the sensors were sensitive to artifacts (see Figure 4), suggesting that the model relying on HRV features may not be reliable. Note, however, that the Hexoskin also provides a more advanced processing method for computing R-R intervals through their server, but this method was not integrated in the Sensor Hub platform for real-time processing.
Therefore, the model that used only the baseline-normalized heart and res- piratory rate was chosen and implemented into the Sensor Hub solution. For this implementation, a new feature was developed on the monitoring plat- form to enable the use of baseline recordings from the dashboard developed in Marois et al. (2023) for the calculation of normalized features.
Figure 4: Sample of the R-R intervals (shown in beats per minute) recorded with Sensor Hub during a pilot data collection, showing unrealistic and missing values.
DISCUSSION
The goal of this study was to develop a stress prediction model for real- time stress monitoring for public safety personnel training. To reach this goal, we used an open-access dataset comprised of physiological signals of spider-fearful participants. We extracted the heart rate, respiratory rate, and frequency-domain HRV features, which were used to train machine learning models. The best-performing model (mean balanced accuracy: 83.7%) used the normalized heart rate, respiratory rate and HRV. How- ever, qualitative analysis of pilot data collected with the Sensor Hub solution for real-time monitoring suggested that the HRV features were unreliable due to R-R interval calculation problems. Therefore, the best- performing model using only the normalized heart and respiratory rate, without any HRV features (balanced accuracy: 80.86%), was chosen. This final model was integrated into the trainee monitoring dashboard discussed by Marois et al. (2023), using the dashboard to indicate which data can be used for baseline normalization and providing a stress prediction value every second.
While the integration of this model is an advancement towards a neuro- physiological stress monitoring system for public safety officers, additional research is required to validate the system’s suitability for its intended context. It should be noted that the stress experienced by the spider-fearful individuals in the training dataset may not be perfectly equivalent to the stress encoun- tered by public safety officers during training. Its intensity and nature can differ from that of a public safety training program. Despite similarities in autonomic responses and common brain activity across different subtypes of stress, anxiety, and fear, some patterns of neurophysiological expression are thought to vary. For instance, Schaefer et al. (2014) showed that normative fear activates a network of threat-responsive brain regions whereas phobic fear activates larger arrays of brain regions. Furthermore, over time, par- ticipation in certain training programs may influence baseline physiological parameters such as HRV (e.g., Jouanin et al., 2004). Consequently, the car- diorespiratory feature patterns present in the training data might differ from those exhibited by public safety officers under stress during training, due to population and task disparities.
CONCLUSION
By developing and integrating a stress model into a near real-time dash- board for supporting training of public safety personnel, the current work demonstrates how raw physiological data has the potential to be turned into actionable information useful for applied contexts. Future work will aim to quantitatively validate the entire processing pipeline in the envisioned con- text by testing the developed system with public safety officers undergoing stress.
REFERENCES
Baek, H. J. and Shin, J. (2017) “Effect of missing inter-beat interval data on heart rate variability analysis using wrist-worn wearables”, Journal of Medical Systems, 41, 1–9. https://doi.org/10.1007/s10916-017-0796-2 Benavoli A., Corani, G., Demsar, J. and Zaffalon, M. (2017) “Time for a change: a
tutorial for comparing multiple classifiers through Bayesian analysis”, Journal of Machine Learning Research, 18(77), pp. 1–36. Berka, C., Behneman, A., Kintz, N., Johnson, R. and Raphael, G. (2010) “Accelerating training using interactive neuro-educational technologies: Applications to archery, golf and rifle maksmanship”, The International Journal of Sport and Society, 1(4), pp. 87–104. https://doi.org/10.18848/2152-7857/CGP/v01i04/ 54040 Cajal, D., Hernando, D., Lázaro, J., Laguna, P., Gil, E. and Bailón, R. (2022) “Effects
of missing data on heart rate variability metrics”, Sensors 22, no. 15: 5774. https: //doi.org/10.3390/s22155774 Colligan, T. W. and Higgins, E. M. (2006) “Workplace stress”, Journal of Workplace Behavioral Health, pp. 21, 89–97. https://doi.org/10.1300/J490v21n02_07 Dehais, F., Causse, M., Vachon, F., Régis, N., Menant, E. and Tremblay, S. (2014)
“Failure to detect critical auditory alerts in the cockpit: Evidence for inatten- tional deafness”, Human Factors, 56(4), pp. 631–644. https://doi.org/10.1177/ 0018720813510735
Training Stress Models on Open-Access Data 43
Gagnon, J.-F., Lafond, D., Rivest, M., Couderc, F. and Tremblay, S. (2014) “Sensor- Hub: A real-time data integration and processing nexus for adaptive C2 systems”, ADAPTIVE 2014, Sixth International Conference on Adaptive and Self-Adaptive Systems and Applications, pp. 63–67. Giannakakis, G., Marias, K. and Tsiknakis, M. (2019) “A stress recognition system
using HRV parameters and machine learning techniques”, In 2019 8th Interna- tional Conference on Affective Computing and Intelligent Interaction Workshops and Demos (ACIIW), pp. 269–272. https://doi.org/10.3389/fpubh.2017.00258 Hodgetts, H. M., Tremblay, S., Vallières, B. R. and Vachon, F. (2015) “Decision support and vulnerability to interruption in a dynamic multitasking environment”, International Journal of Human-Computer Studies, 79, pp. 106–117. https://doi. org10.1016/j.ijhcs.2015.01.009 Ihmig, F. R., Gogeascoechea, A. H., Neurohr-Parakenings F, Schäfer S. K.,
Lass-Hennemann, J. and Michael, T. (2020) “On-line anxiety level detection from biosignals: Machine learning based on a randomized controlled trial with spider- fearful individuals”, PLoS ONE, 15(6), e0231517. https://doi.org/10.1371/jour nal.pone.0231517 Ihmig, F. R., Gogeascoechea, A., Schäfer, S., Lass-Hennemann, J. and Michael, T.
(2020) “Electrocardiogram, skin conductance and respiration from spider-fearful individuals watching spider video clips (version 1.0.0)”, PhysioNet. https://doi.or g/10.13026/sq6q-zg04 Jouanin, J. C., Dussault, C., Pérès, M., Satabin, P., Piérard, C. and Guézennec, C. Y.
(2004) “Analysis of heart rate variability after a ranger training course”, Military Medicine, 169(8), 583–587. https://doi.org/10.7205/MILMED.169.8.583 Kolbell, R. M. (1995) “When relaxation is not enough”, in: L. R. Murphy, J. J. Hurell, Jr., S. L. Sauter and G. P. Keita (eds), Job stress interventions, pp. 31–43. https: //doi.org/10.1037/10183-003 Krätzig, G. P., Hembroff, C. C. and Ahlgrim, B. (2021) “Comparison study of attention between training in a simulator vs. live-fire range”, in: D. Schmorrow and C. Fidopiastis (eds) Augmented Cognition. HCII 2021. Lecture Notes in Computer Science, vol. 12776, pp. 178–197. https://doi.org/10.1007/978-3-030-78114-9_13 Makowski, D., Pham, T., Lau, Z. J., Brammer, J. C., Lespinasse, F., Pham,
H., Schölzel, C. and Chen, S. H. A. (2021) “NeuroKit2: A python toolbox for neurophysiological signal processing”, Behavior Research Methods, 53(4), pp. 1689–169. https://doi.org/10.3758/s13428-020-01516-y Marois, A., Salvan, L., Lemaire, N. and Gagnon, J.-F. (2023) “User-centered dashboard for sensors-enabled human state monitoring: Two operational use cases”, in: T. Ahram and C. Falcão (eds) Usability and User Experience. AHFE (2023) International Conference. AHFE Open Access, vol 110. AHFE International, USA. http://doi.org/10.54941/ahfe1003191 Marois, A., Lafond, D., Gagnon, J.-F., Vachon, F. and Cloutier, M.-S. (2018) “Pre-
dicting stress among pedestrian traffic workers using physiological and situational measures”, Proceedings of the Human Factors and Ergonomics Society 2018 Meeting, pp. 1262–1266. http://doi.org/10.1177/1541931218621290 Massood, K., Ahmed, B. and Guiterrez-Osuna, R. (2012) “Consistency and validity of self-reporting scores in stress measurement surveys”, 2012 Annual Interna- tional Conference of the IEEE Engineering in Medicine and Biology Society, pp. 4895–4898. https://doi.org/10.1109/EMBC.2012.6347091
Mishra, V., Sen, S., Chen, G., Hao, T., Rogers, J., Chen, C. H. and Kotz, D. (2020) “Evaluating the reproducibility of physiological stress detection models”, Pro- ceedings of the ACM on interactive, mobile, wearable and ubiquitous technologies, 4(4), 1–29. https://doi.org/10.1145/3432220 Nardelli, M., Valenza, G., Greco, A., Lanata, A. and Scilingo, E. P. (2015) “Recog-
nizing emotions induced by affective sounds through heart rate variability”, IEEE Transactions on Affective Computing, 6(4), 385–394. https://doi.org/10.1109/TA FFC.2015.2432810 Ollander, S., Godin, C., Campagne, A. and Charbonnier, S. (2016) “A comparison of wearable and stationary sensors for stress detection”, in: 2016 IEEE International Conference on systems, man, and Cybernetics (SMC), pp. 004362–004366. https: //doi.org/10.1109/SMC.2016.7844917 Parent, M., Tiwari, A., Albuquerque, I., Gagnon, J. F., Lafond, D., Tremblay, S. and
Falk, T. H. (2019, October). “A multimodal approach to improve the robustness of physiological stress prediction during physical activity”, in: 2019 IEEE Inter- national Conference on Systems, Man and Cybernetics (SMC), pp. 4131–4136. https://doi.org/10.1109/SMC.2019.8914254 Queirós, C., Passos, F., Marques, A. J., da Silva, C. F. and Pereira, A. (2020) “Burnout and stress measurement in police officers: Literature review and study with the operational police stress questionnaire”, Frontiers in Psychology, 11, 587. https: //doi.org/10.3389/fpsyg.2020.00587 Sato, H. and Kawahara, J.-i. (2011) “Selective bias in retrospective self-reports of
negative mood states”, Anxiety, Stress, & Coping, 24(4), pp. 359–367. https://do i.org/10.1080/10615806.2010.543132 Schaefer, H. S., Larson, C. L., Davidson, R. J. and Coan, J. A. (2014) “Brain, body, and cognition: Neural, physiological and self-report correlates of phobic and nor- mative fear”, Biological Psychology, 98, pp. 59–69. https://doi.org/10.1016/j.bi opsycho.2013 van den Bergh, D., van Doorn, J., Marsman, M., Draws, T., van Kesteren, E.-J.,
Derks, K., Dablander, F. et al. (2020) “A tutorial on conducting and inter- preting a Bayesian ANOVA in JASP”, L’Année psychologique, 120, pp. 73–96. https://doi.org/10.3917/anpsy1.201.0073
LISTED IN THE AHFE DIGITAL BOOKSTORE CATALOGUE
Explore the complete digital volume
Neuroergonomics and Cognitive Engineering
Read this individual research paper free through the original publisher, or explore the full digital proceedings book.
ISBN 978-1-964867-02-1
Explore this ISBN in the AHFE Bookstore ↗Listed in the July 2026 bookstore catalogue; search by ISBN to confirm current availability · Digital book purchase optional