Saurabh Sharma, Sonali Aatrai, Rajlakshmi Guha (2024). Impact of Anxiety on Eye Markers: Role of Visual Task Complexity. In: Neuroergonomics and Cognitive Engineering. AHFE Open Access, vol. 126, pp. 134–142. https://doi.org/10.54941/ahfe1004746
Anxiety and visual task difficulty may interact, impose cognitive demands, and affect task performance. Researchers have found that when comparing task performance across people with different levels of anxiety vulnerability, people with somewhat elevated anxiety vulnerability perform worse than people with lower anxiety susceptibility. Furthermore, vulnerability to anxiety is associated with a decreased ability to control the allocation of attention that is reflected while performing tasks. We aim to see the role of visual task complexity as potential mediators in the relation between different levels of anxiety and eye movements and to see whether increasing task complexity has an effect on visualization behaviour. We use eye-movement analysis to observe and analyze how people view and subsequently process visual information. After the screening, the study recruited 31 students (F= 11; M=20) aged between 21 to 35 years (M=28.02, SD=0.62). Exclusion criteria included individuals with visual impairments, with substance disorders and history of neurological disorders. All participants provided consent before participation. STAI-Y2 was used to categorize participants into low, moderate, and high (N=9, N=10, and N= 12). Visual task involved arithmetic problems and determining the accuracy of the answer displayed (true or false). Each level was divided into two subsets, each containing six equations with a combination of numbers, alphabet characters, and spatial symbols (>, <). To heighten task complexity, one subset required participants to respond synchronously using their right index finger for true and left index finger for false, while the other subset required asynchronous responses (left index finger for true, right index finger for false). Relevant information to solve the problems consisted of numbers and spatial symbols, while alphabet characters were considered irrelevant or noise. The First Fixation Duration (FFD), Time to First Fixation (TTFF), Total Visit Duration (TVD), Total Fixation Duration (TFD) were computed after ascertaining the Area of Interests (AOIs). The findings suggest that individuals with high trait anxiety tend to explore or scan irrelevant information more compared to low and moderate trait anxiety levels while performing the task, particularly during more complex visual tasks. Individuals in the low and moderate anxiety groups showed better ability to fixate on relevant information during the same tasks. The study's findings suggest that eye metrics, such as fixation duration and visit duration on relevant and irrelevant information, could serve as objective markers indicating anxiety related attentional differences during task performance. The results are in line with previous research supporting the correlation between anxiety and eye metrics. Our study corroborates with existing literature, which posits that highly anxious individuals may experience impaired attentional control during task performance. The study provides valuable insights into the impact of anxiety on attention and information processing during visual tasks of varying complexity.
Anxiety, a multifaceted emotion characterized by tension, fear, worry, and unease, presents a complex response to perceived or actual threats, pro- foundly affecting individuals’ daily functioning and overall well-being (Amer- ican Psychiatric Association, 2000). Spielberger (1983) delineated anxiety into two forms: Trait Anxiety, reflecting an individual’s inherent predis- position to respond, and State Anxiety, representing the current conscious perception of feelings, often accompanied by physiological arousal. Trait anx- iety manifests as a predisposition to experience anxiety frequently, even in non-threatening circumstances (Spielberger, 1983). Individuals with anxiety tend to exhibit heightened focus on alarming information and a tendency to over-remember ambiguous details (Mathews and MacLeod, 2005). Phys- ically, anxiety is marked by symptoms like restlessness, muscle tension, and sleep disturbances, alongside physiological manifestations such as increased heartbeat and excessive sweating. Moreover, cognitive symptoms, including difficulties in concentration, attention, and memory biases, are commonly observed in individuals with anxiety, significantly impacting their quality of life (Morton et al., 1997). This cognitive dysfunction is particularly pronounced in highly anxious individuals (Aarsland and Kurz, 2010) and affects the fronto-parietal cognitive control network, involving regions of the prefrontal cortex and inferior parietal cortices responsible for executive
Impact of Anxiety on Eye Markers: Role of Visual Task Complexity 135
functions, goal-directed behaviors, and interactions with the limbic system (Barone et al., 2009; Cacioppo et al., 2000; Martens and Gill, 1976).
Anxiety does not exist in isolation but contributes to overall arousal lev- els in individuals (Kester and Kirschner, 2012). Moreover, cognitive tasks impose significant cognitive demands, especially in situations where working memory and information processing are challenged (Chipman et al., 2000; Sweller, 1988). The interplay between anxiety and cognitive task difficulty can influence task performance (Plass and Moreno, 2010) with research indi- cating that individuals with heightened anxiety vulnerability tend to fare worse in performance compared to their less-anxious counterparts (Ellis, 2005; Kuiken et al., 2007; Myles et al., 2020). Additionally, anxiety affects perception of external stimuli, influencing visualization patterns and task per- formance (De Lemos et al., 2008). Recent studies, such as Tsai An Hsian’s research in 2021, have established significant correlations between learners’ task performances, information anxiety, and eye-tracking measurements in online information problem-solving (OIPS) (Tsai and Wu, 2021).
Eye tracking technology, utilized in these studies, provides valuable insights into cognitive processes underlying human behavior by objectively recording (Van Orden et al., 2007; Wang et al., 2015) and analysing visual behavior through monitoring eye movements and determining points of gaze (Schrader et al., 2021). This technology allows for the examination of visual behavior and cognitive processes with precision and accuracy, offering insights into oculomotor and visual task performance through metrics like fixations and saccades (Gehrer et al., 2018).
1. To examine the relationship between different levels of Trait Anxiety (low, moderate and high) and Eye Parameters during the performance of varying task complexity. 2. To determine whether increasing task-complexity has an effect on visual- ization behaviour. 3. To see whether there is any difference in the attentional focus towards relevant and irrelevant information in a given task. 4. To see if there exists any relationship between perceived cognitive load and performance markers.
METHODOLOGY
After the screening, the study recruited 31 students (11 female and 20 male) aged 21 to 35 years (mean 28.02, standard deviation 0.62). Exclusion criteria included individuals with visual impairments without substance abuse and no history of neurological disorders. All participants provided informed consent before participation. STAI-Y2 was used to categorize participants into low, moderate, and high (N = 9, N = 10, and N= 12).
Experimental Design Following the acquisition of informed consent, the subjects proceeded to undertake the State-Trait Anxiety Inventory - Form Y2 (STAI-Y2). The eye movements of the participants were calibrated and recorded using a Tobii
Pro x3-120 eye- tracker, which was positioned on the screen. Concurrently, the audio and video of the subjects were captured for subsequent analysis. The participants are positioned at a distance of 60 cm from the exhibition within a sound proof chamber that is enclosed by a door.
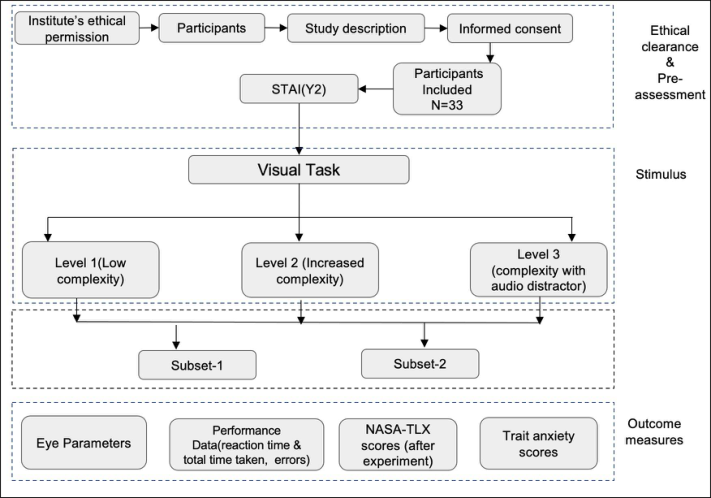
Figure 1: Flow of study.
The experimental design encompassed three progressively complex levels of visual tasks, each consisting of two subsets. Within each subset, partic- ipants were presented with six arithmetic equations comprising numerical values, alphabetical characters, and spatial symbols (e.g., >, <) as you can see in Figure 1. Participants were instructed to sum all numerical values on the left-hand side of the equation, disregarding alphabetical characters, and then compare the resulting sum with the right-hand side to determine its veracity by indicating “true” or “false” using a computer mouse key. The first subset of each level required participants to provide synchronous responses, utiliz- ing their right index finger for “true” and their left index finger for “false.” In contrast, the second subset necessitated asynchronous responses, with par- ticipants using their left index finger for “true” and their right index finger for “false.”
Furthermore, complexity increased not only within each level but also between levels. In Level 1, equations demanded a minimal number of oper- ations with only six characters. In Level 2, participants were tasked with summing only odd numbers on the left-hand side before comparison, with equations now comprising eight characters. Finally, Level 3 mirrored Level 2 instructions but introduced an auditory distractor to further enhance task complexity.
Impact of Anxiety on Eye Markers: Role of Visual Task Complexity 137
Figure 2: Illustrates multiple types of equations frequently used for tasks as a stimulus. Images(a) signify the type of equation used in level 1. In level 2 and 3, a different form of equation (b) is used as the complexity of operations and stimulus increases.
In the current investigation, the researchers regarded numbers and spa- tial symbols as pertinent data for problem-solving, while seeing alphabets as inconsequential or irrelevant. Performance scores were computed based on the parameters of response time, accuracy of responses, and frequency of errors. No specific time constraint was established for responding to the questions. Participants were asked to solve the problems as quickly as they could. The study was approved by the Institute’s Ethics Committee (IIT/SRIC/DEAN/2023).
Tools STAI: The State-Trait Anxiety Inventory (STAI) is a commonly used tool to assess trait and state anxiety. The forms Y-1 (state) and Y-2 (trait) measure the state and trait apprehension, respectively. The internal consistency coefficient of the scale ranges from 0.86 to 0.95, and the reliability coefficient of the two-month test-retest ranges from 0.65 to 0.75. A large amount of evidence supports the concept and simultaneously validity of scales. The present study uses STAI-Y2 (T).
Eye Tracking: An eye-tracking device was utilized in this study to objec- tively and precisely capture and assess visual behavior. Eye tracking enables researchers to see how participant’s eyes move while engaging in various Cog- nitive activities. Eye tracking is a sensor system that can detect a person’s presence and monitor their gaze in real-time. The technology converts eye movements into a stream of data that provides information about pupil dis- position, gaze vector for each eye, and fixation point. Fundamentally, the automation interprets eye movements and converts them into insights that can be used in various applications or as a supplementary input process.
NASA-TLX: It is a validated subjective tool (questionnaire) to measure and analyze the cognitive load of a task or system, the NASA-TLX (NASA Task Load Index) is frequently used. It assesses six sub- aspects—mental demand, physical demand, temporal demand, own assessment of performance, effort, and frustration—it evaluates the user’s mental, physical, and emotional needs. NASA-TLX entails asking the person to rate the mental, bodily, and temporal demands of a task and their level of frustration and performance (Zagermann et al., 2016).
Data Acquisition: STAI-Y2 was scored according to Spielberger’s (1983) scoring protocol, which categorized trait anxiety levels as low, moderate, and high. The cognitive load of each of the three levels of the visual task was
examined using NASA-TLX scores. Eye marker analysis involved feature ex- traction and AOI (Area of Interest) notation. This study aimed to determine whether there are statistically significant differences between the performance parameters (reaction time, correct response, and error), eye parameters (First Fixation Duration, Time to First Fixation, Total Visit Duration and Total Fixation Duration), and trait anxiety scores. Individuals from the high, mod- erate, and low anxiety groups were subjected to Analysis of Variance-One Way to determine whether there were statistically significant differences in their visualization patterns.
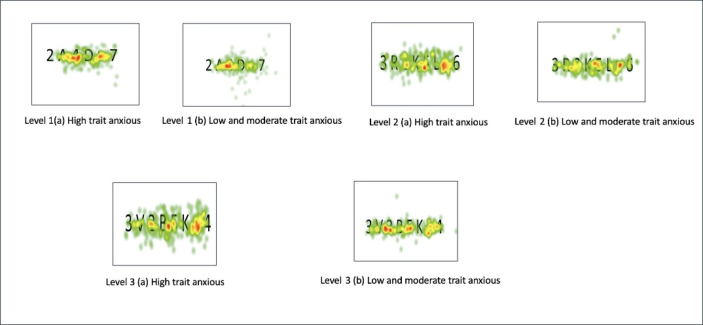
Figure 3: Heat-map plot for high trait anxiety and moderate and low trait anxiety people.
Feature Extraction The following eye parameters were computed by the Area of Interest (AOI) technique using various studies (Nasreen et al., 2022). a. First Fixation Dura- tion (FFD): The time involved in the first fixation in an AOI. b. Time to First Fixation (TTFF): The time taken for the first fixation to occur in an AOI. c. Total Visit Duration (TVD): Sum of all visit duration in an AOI. d. Total Fixation Duration (TFD): Total amount of time taken for all fixations in an AOI (Nasreen et al., 2022).
RESULT AND DISCUSSION
Cognitive Load and Performance Data In the context of a bi-variate correlation analysis, the study investigated the relationship between performance data and trait anxiety across three differ- ent levels of visual tasks and cognitive load. The results revealed a statistically significant correlation between cognitive load and levels 2 and 3 (p < 0.01), indicating that as participants progressed to higher task levels, they encoun- tered increased complexity, necessitating a greater allocation of cognitive resources to solve the problems. In contrast, no significant association was
Impact of Anxiety on Eye Markers: Role of Visual Task Complexity 139
observed between cognitive load and level 1. These findings suggest that par- ticipants perceived the tasks as progressively more challenging, requiring an escalation in their cognitive efforts as they advanced through the levels. This aligns with previous research indicating that assessing cognitive load provides a more comprehensive understanding of performance, encompassing factors such as mental, physical, and temporal demands, as well as self-evaluation of effort and frustration necessary for task completion (Zagermann et al., 2016).
Table 1. The data were analyzed using analysis of variance (ANOVA). The group was divided into three categories based on trait anxiety level (low, moderate, high) to determine the distinction between trait anxiety, task performance, and eye parameter. Significant differences were found among eye parameters & trait anxiety in task performance in levels 1, 2 & 3 (95% CL * & 99% CL**).
Table available in the original PDF paper.
Eye Parameters & Anxiety Mean SD F Ratio Significant 6.46 4.03 TVD Irrelevant Information (Level 2) 6.03 3.37 7.13 0.003** 12.01 4.76 7.25 3.92 TFD Irrelevant information (Level 2) 6.59 3.49 6.1 0.006** 12.32 4.87 25.04 10.17 TTFF Irrelevant information (Level 3) 29.13 12.53 3.36 0.049* 40.00 16.81 3.27 1.6 FFD Irrelevant Information (Level 3) 3.14 1.3 7.43 0.003** 5.37 1.58 6.04 3.11 TFD irrelevant information (level 3) 5.87 2.59 10.3 0.00** 13.33 6.05 6.49 3.28 TVD Irrelevant information (Level 3) 6.19 2.64 9.75 0.001** 13.65 6.15
Trait Anxiety and Eye Movement Markers In this study, all participants successfully completed the three levels of visual tasks. Table 1 presents the results, indicating that individuals with high trait anxiety tended to engage in meticulous examination or validation of irrele- vant information before responding to specific questions, particularly evident in the more complex task levels. Conversely, those in the low and moderate anxiety groups displayed superior ability to concentrate on pertinent infor- mation. This trend is evident in the mean values of various eye metrics for levels 2 and 3, as depicted in Table 1.
For instance, examining the Total Visit Duration (TVD) for irrelevant information at level 2, mean values for the low, moderate, and high anxiety groups were 6.46, 6.03, and 12.01, respectively. Similarly, at level 3, mean values for TVD on irrelevant information were 6.49, 6.19, and 13.65 for the
low, moderate, and high anxiety groups, respectively. Total Fixation Dura- tion (TFD) followed a similar pattern, with mean values at level 2 of 7.25, 6.59, and 12.32 for the low, moderate, and high anxiety groups, and at level 3 of 6.49, 6.19, and 13.65, respectively. These results suggest that individuals in the low and moderate anxiety groups demonstrated greater adaptability to task complexity and maintained focus on pertinent information despite increased complexity.
These findings are consistent with the Attentional Control Theory (ACT), which suggests that highly anxious individuals encounter challenges in atten- tional control during task execution. Previous research also supports these findings, indicating that individuals with higher levels of math anxiety tend to allocate attention to both task-relevant and task-irrelevant distractions, leading to diminished task performance (Nasreen et al., 2022). At Level 1, representing a low-complexity task, no significant differences were observed in the expression of eye metrics across the three anxiety groups regarding rel- evant and irrelevant information. However, at Level 2, which entails higher task complexity, results showed significant differentiation in Total Visit Dura- tion (TVD) and Total Fixation Duration (TFD) among the three trait anxiety groups concerning irrelevant information, but no significant differences were found for eye metrics related to relevant information. In Level 3, where task complexity was further increased by introducing an auditory distrac- tor, significant differences emerged in all four eye parameters (Time to First Fixation, First Fixation Duration, Total Fixation Duration, and Total Visit Duration) among the three anxiety groups regarding irrelevant information in the visual tasks. This suggests that individuals with high trait anxiety spent more time on irrelevant information and encountered difficulty concentrating on important information, especially in tasks with heightened complexity.
These findings corroborate previous research indicating a link between anxiety and attentional control difficulties, wherein high trait anxiety may lead to heightened vigilance for potential threats, diverting attention from goal-oriented processes (Li et al., 2022; Stout et al., 2015). This can impair processing efficiency, consume attentional resources, and impact concentra- tion and performance (Eysenck et al., 2007). The objective eye tracking (ET) markers employed in this study provide empirical validation of the associa- tion between anxiety and eye metrics, including initial fixation, first fixation gaze, and proportion of viewing duration. The study’s outcomes underscore that individuals with high trait anxiety are prone to spending more time on irrelevant information and experiencing difficulty in focusing on relevant information, particularly in tasks with elevated complexity (Basanovic et al., 2023). These findings align with existing research on anxiety and attentional control, reinforcing the relationship between anxiety and attention-related challenges (Mills et al., 2016). The ET markers objectively validate prior research findings, indicating a strong correlation between anxiety and eye metrics, including initial fixation, first fixation gaze, and proportion of viewing duration (Oar et al., 2022).
Impact of Anxiety on Eye Markers: Role of Visual Task Complexity 141
CONCLUSION AND IMPLICATIONS Our results provide evidence in favor of the notion that individuals with high trait anxiety may find it challenging to maintain concentration on visual tasks due to the interference of irrelevant information. This highlights the impor- tance of considering the impact of irrelevant information on the performance of individuals with high trait anxiety. Moreover, the significant eye markers effectively distinguish between low, moderate, and high trait anxiety groups. This suggests that eye tracking has the potential to be a valuable tool for future studies focusing on anxiety disorders. It can offer valuable insights into how individuals with anxiety perceive challenges in visual tasks and the underlying factors contributing to declines in their performance.
REFERENCES
Aarsland, D., & Kurz, M. W. (2010). The epidemiology of dementia associated with Parkinson disease. Journal of the neurological sciences, 289(1–2), 18–22. American Psychiatric Association. (2000). Diagnostic and statistical manual of
mental disorders, text revision (DSM-IV-TR). (No Title). Barone, P., Antonini, A., Colosimo, C., Marconi, R., Morgante, L., Avarello, T. P.,...
& Dotto, P. D. (2009). The PRIAMO study: A multicenter assessment of nonmotor symptoms and their impact on quality of life in Parkinson’s disease. Movement disorders: Official journal of the Movement Disorder Society, 24(11), 1641–1649. Basanovic, J., Todd, J., Van Bockstaele, B., Notebaert, L., Meeten, F., & Clarke, P. J.
(2023). Assessing anxiety-linked impairment in attentional control without eye- tracking: The masked-target antisaccade task. Behavior Research Methods, 55(1), 135–142. Cacioppo, J. T., Berntson, G. G., Sheridan, J. F., & McClintock, M. K. (2000).
Multilevel integrative analyses of human behavior: Social neuroscience and the complementing nature of social and biological approaches. Psychological bulletin, 126(6), 829. Chipman, S. F., Schraagen, J. M., & Shalin, V. L. (2000). Introduction to cognitive task analysis. In Cognitive task analysis (pp. 17–38). Psychology Press. De Lemos, J., Sadeghnia, G. R., O’lafsd’ottir, ’I., & Jensen, O. (2008, August).
Measuring emotions using eye tracking. In Proceedings of measuring behavior (Vol. 226, pp. 225–226). Maastricht, The Netherlands: Noldus. Ellis, R. (2005). Planning and task performance in a second language. Planning and task performance in a second language, 1–320. Eysenck, M. W., Derakshan, N., Santos, R., & Calvo, M. G. (2007). Anxiety and
cognitive performance: attentional control theory. Emotion, 7(2), 336. Gehrer, N. A., Schonenberg, M., Duchowski, A. T., & Krejtz, K. (2018, June).
Implementing innovative gaze analytic methods in clinical psychology: A study on eye movements in antisocial violent offenders. In Proceedings of the 2018 ACM Symposium on Eye Tracking Research & Applications (pp. 1–9). Kester, L., & Kirschner, P. A. (2012). Cognitive tasks and learning. In Encyclopedia of the Sciences of Learning (pp. 619–622). Springer. Kuiken, F., Vedder, I., & Matters, M. (2007). Cognitive task complexity and linguistic
performance in French L2 writing. Investigating tasks in formal language learning, 117–135. Li, T., Quintero, M., Galvan, M., Shanafelt, S., Hasty, L. M., Spangler, D. P.,... & Wang, Z. (2022). The mediating role of attention in the association between math anxiety and math performance: An eye-tracking study. Journal of Educational Psychology.
Martens, R., & Gill, D. L. (1976). State anxiety among successful and unsuccessful competitors who differ in competitive trait anxiety. Research Quarterly. American Alliance for Health, Physical Education and Recreation, 47(4), 698–708. Mathews, A., & MacLeod, C. (2005). Cognitive vulnerability to emotional disorders.
Annu. Rev. Clin. Psychol., 1, 167–195. Mills, B. W., Carter, O. B. J., Rudd, C. J., Claxton, L. A., Ross, N. P., & Strobel, N. A.
(2016). Effects of low-versus high-fidelity simulations on the cognitive burden and performance of entry-level paramedicine students: A mixed-methods compar- ison trial using eye-tracking, continuous heart rate, difficulty rating scales, video observation and interviews. Simulation in Healthcare, 11(1), 10–18. Morton, L. L., Vesco, R., Williams, N. H., & Awender, M. A. (1997). Student teacher anxieties related to class management, pedagogy, evaluation, and staff relations. British Journal of Educational Psychology, 67(1), 69–89 Myles, O., Grafton, B., & MacLeod, C. (2020). Anxiety & inhibition: dissociating
the involvement of state and trait anxiety in inhibitory control deficits observed on the anti-saccade task. Cognition and Emotion, 34(8), 1746–1752. Nasreen, S., Roy, A. K., & Guha, R. (2022, July). Exploring ‘Little-c’Creativity Through Eye-parameters. In 2022 44th Annual International Conference of the IEEE Engineering in Medicine & Biology Society (EMBC) (pp. 1078–1081). IEEE. Oar, E. L., Johnco, C. J., Waters, A. M., Fardouly, J., Forbes, M. K., Magson, N. R.,...
& Rapee, R. M. (2022). Eye-tracking to assess anxiety-related attentional biases among a large sample of preadolescent children. Behaviour research and therapy, 153, 104079. Plass, J., & Moreno, R. Brunken R (2010) Cognitive load theory. Schrader, A., Gebhart, I., Garrison, D., Duchowski, A., Lapadatescu, M., Feng, W.,...
& Petty, D. D. (2021, May). Toward Eye-Tracked Sideline Concussion Assess- ment in eXtended Reality. In ACM Symposium on Eye Tracking Research and Applications (pp. 1–11). Spielberger, C. D. (1983). State-trait anxiety inventory for adults. Stout, D. M., Shackman, A. J., Johnson, J. S., & Larson, C. L. (2015). Worry is associated with impaired gating of threat from working memory. Emotion, 15(1), 6. Sweller, J. (1988). Cognitive load during problem solving: Effects on learning.
Cognitive science, 12(2), 257–285. Tsai, M. J., & Wu, A. H. (2021). Visual search patterns, information selection strategies, and information anxiety for online information problem solving. Computers & Education, 172, 104236. Van Orden, K. F., Viirre, E., & Kobus, D. A. (2007). Augmenting task- centered
design with operator state assessment technologies. In Foundations of Augmented Cognition: Third International Conference, FAC 2007, Held as Part of HCI Inter- national 2007, Beijing, China, July 22–27, 2007. Proceedings 3 (pp. 212–219). Springer Berlin Heidelberg. Wang, H., Crewther, S. G., & Yin, Z. Q. (2015). The role of eye movement driven attention in functional strabismic amblyopia. Journal of Ophthalmology, 2015. Zagermann, J., Pfeil, U., & Reiterer, H. (2016, October). Measuring cognitive
load using eye tracking technology in visual computing. In Proceedings of the sixth workshop on beyond time and errors on novel evaluation methods for visualization (pp. 78–85).
LISTED IN THE AHFE DIGITAL BOOKSTORE CATALOGUE
Explore the complete digital volume
Neuroergonomics and Cognitive Engineering
Read this individual research paper free through the original publisher, or explore the full digital proceedings book.
ISBN 978-1-964867-02-1
Explore this ISBN in the AHFE Bookstore ↗Listed in the July 2026 bookstore catalogue; search by ISBN to confirm current availability · Digital book purchase optional