Andra Mahu, Amandeep Singh, Florian Tambon, Benoit Ouellette, Jean-françois Delisle, Tanya Paul, Foutse Khomh, Alexandre Marois, Philippe Doyon-poulin (2024). Validation of Vigilance Decline Capability in A Simulated Test Environment: A Preliminary Step Towards Neuroadaptive Control. In: Neuroergonomics and Cognitive Engineering. AHFE Open Access, vol. 126, pp. 45–59. https://doi.org/10.54941/ahfe1004737
Vigilance is the ability to sustain attention. It is crucial in tasks like piloting and driving that involve the ability to sustain attention. However, cognitive performance often falters with prolonged tasks, leading to reduced efficiency, slower reactions, and increased error likelihood. Identifying and addressing diminished vigilance is essential for enhancing driving safety. Neuro-physiological indicators have shown promising results to monitor vigilance, paving the way for neuroadaptive control of vigilance. In fact, the collection of vigilance-related physiological markers could allow, using neuroadaptive intelligent systems, a real-time adaption of tasks or the presentation of countermeasures to prevent errors that would ensue from such hypovigilant situations. Before reaching this goal, one must however collect valid data truly representative of hypovigilance which, in turn, can be used to develop prediction models of the vigilant state. This study serves as a proof of concept to assess validity of a testbed to induce and measure vigilance decline through a simulated test environment, validating controlled induction, and evaluating its impact on participants’ performance and subjective experiences. In total, 28 participants (10 females, 18 males) aged 18 to 35 (M = 23.75 years), were recruited. All participants held valid driving licenses and had corrected-to-normal vision. Data collection involved Psychomotor Vigilance Task (PVT), Karolinska Sleepiness Scale (KSS) and the Stanford Sleepiness Scale (SSS) along with neuro-physiological specialized equipment: Enobio 8 EEG, Empatica E4, Polar H10 and Tobii Nano Pro eye tracker. Notably, this study is limited to demonstrating the results of PVT, KSS, and SSS, with the aim of assessing the effectiveness of the test setup. Participants self-reported their loss of vigilance by pressing a marker on the steering wheel. To induce hypovigilance, participants drove an automatic car in a low-traffic, monotonous environment for 60 minutes, featuring empty fields of grass and desert, employing specific in-game procedures. The driving task included instructions for lane-keeping, indicator usage, and maintaining speeds of up to 80 km/h, with no traffic lights or stop signs present. Experiments were conducted before lunch, between 9 am and 12 pm, ensuring maximum participant alertness, with instructions to abstain from caffeine, alcohol, nicotine, and cannabis on the experiment day. Results showed that the mean reaction time (RT) increased from 257.7 ms before driving to 276.8 ms after driving, t = 4.82, p < .0001, d = -0.61 whereas the median RT changed from 246.07 ms to 260.89 ms, t = 3.58, p = 0.0013, d= -0.53 indicating a statistically significant alteration in participant's psychomotor performance. The mean number of minor lapses in attention (RT >500ms) to the PVT increased from 1.11 before driving to 1.67 after driving, but was not statistically significant t = 1.66, p = 0.11, d = -0.28. KSS showed a considerable rise of sleepiness, with a mean of 4.11 (rather alert) before driving increasing to 5.96 (some signs of sleepiness) after driving, t = 5.65, p < .0001, d = -1.04. Similarly, the SSS demonstrated an increase in mean values from 2.57 (able to concentrate) before driving to 3.96 (somewhat foggy) after driving, t = 8.42, p < .0001, d = -1.20, signifying an increased perception of sleepiness following the driving activity. Lastly, the mean time of the first marker press was 17:38 minutes (SD = 9:47 minutes) indicating that the self-reported loss of vigilance occurred during the first 30 minutes of the driving task. The observed increase in PVT reaction time aligns with the declined alertness reported on both the KSS and SSS responses, suggesting a consistent decline in vigilance and alertness post-driving. In conclusion, the study underscores the effectiveness and validity of the simulated test environment in inducing vigilance decline, providing valuable insights into the impact on both objective and subjective measures. At the same time, the research sets the stage for exploring neuroadaptive control strategies, aiming to enhance task performance and safety. Ultimately, this will contribute to the development of a non-invasive artificial intelligence system capable of detecting vigilance states in extreme/challenging environments, e.g. for pilots and drivers.
Vigilance is essential in cognitive performance, especially for tasks demand- ing prolonged attention, such as aviation and driving (Parasuraman, 1979; Warm, 1980). It is critical in dynamic and safety-sensitive situations where inattention can lead to severe consequences (Durmer and Dinges, 2005). The challenges of prolonged cognitive tasks are not limited to reduced operational efficiency; they involve a multifaceted interplay that can cause fatigue, slower reaction times, and a higher likelihood of errors (Campagne et al., 2004; Pattyn et al., 2008). In emergencies, where rapid and corrective decision- making is crucial to prevent harm, the decline in vigilance is especially significant. This network of cognitive dynamics is particularly noticeable in scenarios requiring quick decision-making and corrective actions. Warm and Finomore (2008) highlighted the vital link between vigilance and decision- making, noting that a decline in vigilance impairs sustained attention and adversely affects the cognitive processes necessary for fast and effective decision-making in critical scenarios.
Real-time monitoring of vigilance states is crucial for addressing chal- lenges in various high-stakes environments. Neurophysiological indicators have become invaluable in this effort, providing insights into cognitive states associated with vigilance paving the way for neuroadaptive monitoring (Mackie, 2013; van Weelden et al., 2022). This innovative approach dynam- ically responds to individuals’ neurophysiological signals, allowing real-time adjustments in monitoring, crucial for safety-sensitive situations. Utilizing artificial intelligence (AI) algorithms, neuroadaptive systems can understand and adapt to specific cognitive patterns, ensuring a personalized and accu- rate vigilance assessment. However, the success of neuroadaptive monitoring relies on robust data. Employing a multimodal approach that integrates var- ious measures is essential, enriching the dataset for a nuanced understanding of vigilance states. Rigorous data collection methodologies are crucial to ensuring the model’s effectiveness.
The potential for revolutionizing vigilance assessment lies in integrating neuroadaptive monitoring and high-quality data, offering insights to enhance safety and performance in critical domains.
To design and develop a robust neuroadaptive intelligent system, the foun- dational requirement is the acquisition of valid data that accurately represents vigilance. This data forms the basis for the subsequent development of pre- cise prediction models essential for real-time vigilance detection. A crucial first step is establishing a validated simulated testbed capable of effectively inducing vigilance decline. In this work, we designed an ecologically-valid, controlled test environment to monitor the driver’s vigilance during a driv- ing task, using self-reporting, behavioral, and neurophysiological measures. Having a realistic simulation that can induce loss of vigilance will provide valuable data for applied research in neuroadaptive systems. This paper reports the validation check to confirm the simulation environment induced a vigilance decline.
The rest of the paper is structured as follows. The next section reviews the main vigilance measures relevant to driving. Then, the simulation
Validation of Vigilance Decline Capability in a Simulated Test Environment 47
environment and experimental method are presented, followed by the main results confirming the vigilance decrement. The discussion puts these results in perspective with neuroadaptive systems.
LITERATURE REVIEW
Different approaches have been explored to monitor vigilance states, par- ticularly hypovigilance (Kerick et al., 2013; Marois et al., 2023; Oken et al., 2006). These approaches encompass various measures, including self-reports, behavioral, physiological, and neurological indicators. Self-reporting tools such as the Karolinska Sleepiness Scale (KSS) and Stanford Sleepiness Scale (SSS) capture individual perceptions of drowsiness or vigilance (Dorrian et al., 2008; Luna et al., 2022). KSS and SSS are often used as gold standard to measure vigilance in human studies (Marois et al., 2023).
Behavioral measures assess the impact of vigilance decline over a focal task (Kashevnik et al., 2021). The Psychomotor Vigilance Task (PVT), widely uti- lized for assessing alertness and behavioral vigilance (Dinges et al., 1997), involves measuring cognitive performance by measuring the reaction time to a visual stimulus. The Mackworth Clock Test is another behavioral tech- nique that measures sustained attention by assessing an individual’s ability to detect anomalies in a clock-like pattern (Mackworth, 1948). Furthermore, the NASA Task Load Index (NASA-TLX), initially developed for workload assessment, finds applications in evaluating vigilance demands in complex tasks, providing subjective insights into cognitive processes (Hart, 2006). In the context of driving, missing traffic signals or doing erratic manoeuvers can indicate a hypovigilant and distracted state. For instance, the Lane Change Test (LCT) is employed in driving simulations and can be used to evaluate the ability to make timely and accurate lane changes, which reflects cognitive alertness (Harbluk et al., 2007). These measures are, however, prone to biases and external influences, such as motivation, emotional states (Pessoa, 2009) and other factors that might affect the person’s performance on the primary task.
Neurophysiological and physiological measures present a compelling alternative by investigating fluctuations in brain activity and autonomic responses. Physiological measures involve analysing the central or periph- eral nervous system to estimate sustained attention deployment (Oken et al., 2006; Rush et al., 2019). Parameters such as heart rate variability (HRV) and electrodermal activity sensors offer valuable insights into auto- nomic nervous system responses and physiological arousal (Lutnyk et al., 2023; Regula et al., 2014). Pupillometry i.e., monitoring changes in pupil size, emerges as a nuanced tool providing unique perspectives on cogni- tive load, attention variations, and arousal levels (Granholm et al., 1996; Piquado et al., 2010). Eye-tracking technology and facial expression analy- sis contribute to understanding how vigilance fluctuations manifest in gaze behavior and emotional responses (Biondi et al., 2023; Bitkina et al., 2021; Rahman et al., 2020). Integrating an HD camera system enhances the exploration of cognitive workload and emotional states (Stemberger et al., 2010). Functional near-infrared spectroscopy (fNIRS) allows for the non- invasive assessment of brain activity by measuring changes in oxygenated and
deoxygenated hemoglobin levels, providing real-time insights into cognitive processes (Leon-Carion and Leon-Dominguez, 2012). This imaging tech- nique enriches the understanding of cerebral oxygenation dynamics during tasks demanding sustained attention. The rationale behind these physiolog- ical measures is deeply rooted in the significant implication of the locus coeruleus-norepinephrine (LC-NE) system in attention-related activities. The secretion of norepinephrine (NE) across multiple brain areas influences vig- ilance, attention orienting, arousal, and the sleep–wake cycle (Aston-Jones and Cohen, 2005; Sara and Bouret, 2012). Neurological indicators illumi- nate the intricate dimension of vigilance, providing real-time examination of brain activity and cognitive fluctuations (Graw et al., 2004; Mackie, 2013; Mullen et al., 2015). Electroencephalography (EEG) offers high temporal res- olution of brain activity and has successfully assessed vigilance and cognitive workload (Akin et al., 2008; Zhou et al., 2022).
The literature on various vigilance measures is dispersed across different research approaches, posing challenges in integrating findings. Each measure category has inherent strengths and limitations, but their combined use offers a more nuanced understanding of cognitive states. Subjective measures pro- vide valuable insights into individual perceptions of drowsiness or vigilance, yet ensuring the validity of self-reports is challenging due to susceptibility to individual variations and external influences. Behavioral measures, reflecting observable actions in diverse contexts, contribute to vigilance understanding but face challenges in interpretation, showing variations across individuals and settings, limiting broad applicability. Physiological measures, analysing the central or peripheral nervous system, offer respectively direct and indi- rect insights into autonomic responses and physiological arousal incurred by variations in vigilance. However, physiological responses can be influenced by individual variations, external stimuli, and emotional states, necessitat- ing a context-sensitive and multidimensional approach for comprehensive vigilance assessment. Neurological measures enhance vigilance understand- ing by capturing real-time cognitive processes and emotional responses. Still, challenges arise from the intricate nature of these measures, creating diffi- culties in interpretation and establishing universal benchmarks for vigilance assessment.
In a recent scoping review on psychophysiological indicators of vigilance, Marois et al. (2023) found the gold standard of vigilance measurements to be the subjective questionnaires KSS and SSS along with the PVT behav- ioral test. Most of the studies reviewed found a strong correlation between these gold standards and EEG-derived measures. This review outlines that to comprehensively assess vigilance, an integrated approach is required combining subjective, behavioral, physiological and neurological measures. Neurophysiological measures, offering continuous quantitative data, could serve as useful indices of hypovigilance that could be fused and integrated into neuroadaptive systems relevant for monitoring operators’ vigilance levels.
Validation of Vigilance Decline Capability in a Simulated Test Environment 49
Objective The overarching goal of this study is to contribute to the development of an AI-based neuroadaptive intelligent system designed to detect real- time vigilance states. To this end, we employed a multimodal approach, integrating a comprehensive array of promising behavioral and neurophys- iological measures, including the Karolinska Sleepiness Scale (KSS), Stan- ford Sleepiness Scale (SSS), NASA-TLX, Psychomotor Vigilance Task (PVT), electroencephalography (EEG), electrodermal activity (EDA), electrocardio- graphy (ECG), eye tracking, and facial features. The integration of these measures facilitates the assessment of vigilance states under controlled condi- tions. Besides, relying on both intrusive (EDA, ECG, EEG) and non-intrusive measures (eye tracking, facial analysis, behavioral) allow for the devel- opment of models that could be more easily integrated within different work contexts. It is important to note that the current study specifically assesses the simulated testbed’s ability to induce vigilance decline during prolonged simulated driving. We use PVT, KSS, and SSS to analyse the testbed’s effectiveness in causing vigilance decline by comparing baseline and post-driving responses. This initial phase serves as a foundation for further investigations into the development of a neuroadaptive intelligent system.
METHOD
Participants A total of 32 participants (21 males and 11 females) were recruited for the driving experiment, aged between 18 and 35 years (M = 26.5, SD = 4.9). Eligibility criteria included having a valid driver’s license, nor- mal to corrected vision, absence of cardiovascular disorders or pacemaker usage, and no diagnosis of neurological diseases. Participants underwent a health screening questionnaire to ensure their suitability for the exper- iment. The study obtained approval from the Institutional Review Board [CER-2324-11-D] and all participants signed a consent form before taking part in the study. All experiments were performed before lunch, between 9 a.m. and 12 p.m., when participants were the most alert. Partici- pants were asked to abstain from caffeine, alcohol, nicotine, and cannabis on the day of the experiment. They received a monetary compensation of $40 CAD.
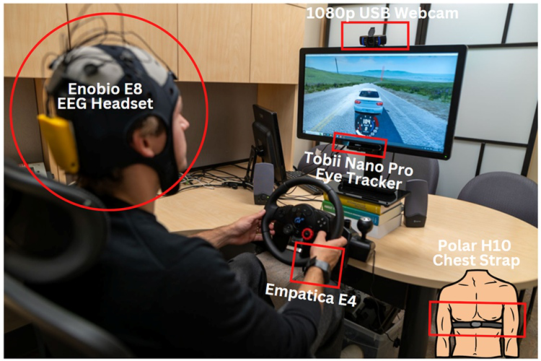
Measures The study adopted a multimodal approach, integrating an extensive range of measures to capture the participant’s subjective, behavioral and neurophysi- ological responses during the driving task. We used the Enobio 8 headset for EEG, Empatica E4 wristband for EDA activity monitoring, Tobii Nano Pro eye tracker for oculometry, Polar H10 chest strap for ECG, and a 1080p USB webcam for facial features analysis (see Figure 1).
Figure 1: Illustration of the experimental set-up with neurophysiological equipment.
We used three gold standard measures (see Marois et al., 2023): KSS on a 9-point scale, SSS on a 7-point scale and PVT. We used the PVT implementa- tion provided by PC-PVT 2.0 (Reifman et al., 2018) that consists of reacting as fast as possible to a stimulus onset for 10 minutes. The main results obtained from the PVT are the mean and median reaction time (RT), mean 1/RT (also called reciprocal response time or response speed in seconds), and the number of minor lapses, which is the number of stimuli answered with RT > 500 ms. This methodological approach ensures a thorough examination of both subjective experiences and objective performance during the simulated driving task, all within the predefined scope of this study. It is important to note that this study presents solely the KSS, SSS and PVT results to validate the experimental task to induce lack of vigilance. Neurophysiological data will be analysed in future work.
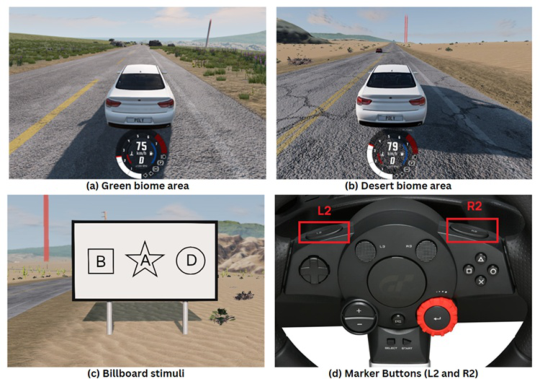
Experimental Procedure Participants were provided with a comprehensive briefing outlining the study’s objectives, the driving task and the utilized measures. Subsequently, they were guided through the placement of the chest strap, the EEG head- set, the EDA wristband, along with a calibration of the eye tracker, ensuring precise positioning. Following equipment preparation, participants under- went a pre-driving assessment, comprising the KSS, SSS, and PVT to establish performance baselines. A 10-minute practice driving session familiarized participants with the task and the controls. The main driving task was con- ducted in BeamNG.tech (BeamNG, 2021), a physics-based driving simulator, featuring a highway with sunny weather conditions, low traffic, and no pedestrians—only cars. Participants navigated the highway for 60 minutes with an exterior field camera view and a speedometer (see Figure 2) while adhering to a speed limit of approximately 80km/h.
Several checkpoints were added on the road serving as visual cues, ensur- ing adherence to the designated route. The highway included two different biomes: a green area and a desert area, both consisting of empty fields of grass
Validation of Vigilance Decline Capability in a Simulated Test Environment 51
and sand as shown in Figure 2 (a) and (b), respectively. The scenario begins in a green biome, transitions into the desert and concludes in the green biome. The intentionally chosen low traffic conditions and limited buildings aimed to create a monotonous driving environment. The desert biome, character- ized by its monotonous scenery, was selected to have the longest duration. A secondary visual attention task involving billboards was implemented to assess vigilance during the driving task. Twenty billboards were dispersed evenly on the path and contained three letters, each enclosed by a shape (see Figure 2 (c)). Participants were instructed to press the R2 button on the steer- ing wheel when the billboard showed the letter “A”inside the star symbol. Ten of the 20 billboards contained the target and their order of appearance were randomized between participants. Additionally, participants indicated their moments of perceived loss of vigilance, boredom, or drowsiness by pressing the vigilance marker L2 button on the steering wheel (see Figure 2 (d)). After 60 minutes, the driving task was ended and participants responded to the PVT, KSS and SSS for the post-drive assessment.
Figure 2: Visualization of (a) green biome; (b) desert biome; (c) billboard stimuli; and (d) marker buttons.
RESULTS
The collected data related to vigilance measures, including KSS, SSS, and PVT, was analysed utilizing various statistical methods to assess the impact of the test setup on vigilance decline. The methods employed included descriptive statistics, paired t-tests, and correlation coefficients.
Data from the 32 participants was analyzed except for the PVT perfor- mance which, due to data loss, comprised only 31 participants. The analysis performed on the self-reports of decline in vigilance revealed that, on aver- age, the first marker press occurred at 18 minutes, suggesting an initial lapse in vigilance within the first half-hour of driving. Notably, over 70% of these first marker presses were clustered during the segment corresponding to the desert biome.
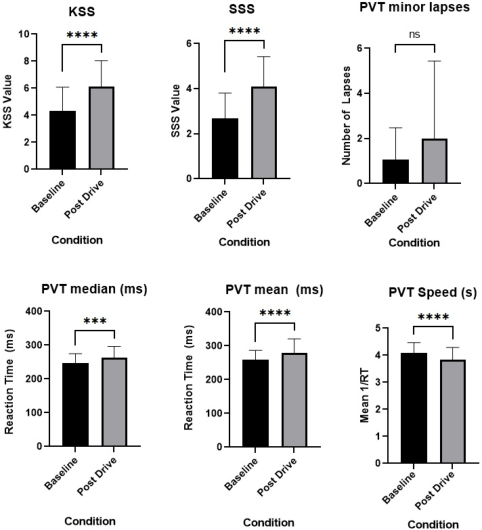
The analysis of subjective sleepiness scores and PVT performance for baseline and post-driving is summarized in Figure 3 and Table 1. The table presents key measures such as mean, standard deviation, 95% confidence interval (CI) lower and upper limits, p-values, Pearson correlation coefficient (r) and Cohen’s d.
Subjective Sleepiness Assessment Participants exhibited a baseline mean KSS level of 4.3 (SD = 1.8), labelled as “rather alert”. The post-driving mean score was of 6.1 (SD = 1.9), labelled as “some signs of sleepiness”. This difference was significant t(31) = 5.4, p <0.0001. Cohen’s d = 0.98, raising a large effect size. The correlation coef- ficient (r = 0.47) indicated a moderately strong positive relationship between baseline and post-driving sleepiness scores.
Similar to the KSS response, the participants reported a baseline mean SSS of 2.7 (SD = 1.1), described as “able to concentrate”, initially suggesting relatively low sleepiness levels. Post-driving, the mean SSS score increased to 4.1 (SD = 1.3), described as “somewhat foggy, let down”. The paired t-test demonstrated a significant difference in subjective sleepiness levels before and after the simulated driving task t(31) = 7.9, p <0.0001, Cohen’s d = 1.15. The substantial effect size emphasized the meaningful increase in perceived sleepi- ness after the simulated driving task. The correlation coefficient (r = 0.67) suggested a moderately strong positive relationship between baseline and post-driving sleepiness scores.
Figure 3: Comparative analysis of sleepiness score and psychomotor performance for baseline and post-driving. Confidence intervals represent the standard deviation. n.s. = non-significant, ***p <0.001, ****p <0.0001.
Validation of Vigilance Decline Capability in a Simulated Test Environment 53
PVT Participants demonstrated mean reaction time of 258 ms (SD = 29) at base- line, increasing to 279 ms (SD = 42) post-drive. The difference was significant t(30) = 5.0, p <0.0001 with a medium effect size, Cohen’s d = 0.61, and showed a strong positive relationship between baseline and post-driving (r = 0.85). The median reaction time was 246 ms (SD = 28) at baseline and increased to 262 ms (SD = 34) post-drive. The difference observed was signif- icant t(30) = 4.2, p <0.001 with a medium effect size (d = 0.50) and depicted a positive correlation between baseline and post-driving with r = 0.79. The analysis of PVT speed revealed a baseline mean speed of 4.1 s-1 (SD = 0.4) that decreased to 3.8 s-1 (SD = 0.4) post-driving. The difference was signifi- cant, t(30) = 4.8, p <0.0001 with effect size d = 0.56, along with a positive correlation between baseline and post-driving (r = 0.80). While the mean number of minor lapses (i.e., RT > 500ms) increased from 1.1 (SD = 1.4) dur- ing baseline to 2.0 (SD = 3.4) post-driving, the difference was not significant t(30) = 1.8, p > .05 with a small effect size (d = 0.36). The correlation coef- ficient (r = 0.54) indicates a moderate positive relationship between baseline and post-driving minor lapses.
Table 1. Paired t-test results for KSS, SSS, and PVT measures.
The study highlighted an early onset of vigilance lapses, with participants reporting the first lapse within the initial 18 minutes of driving. These lapses were predominantly clustered in the desert biome segment. This points to a notable decline in vigilance during the early driving phase under the developed driving environment. Moreover, these lapses suggested a poten- tial linkage between the driving environmental conditions and the lapses in attention. Subjective sleepiness assessment, as indicated by increased KSS and SSS scores post-driving compared to the baseline, emphasized the profound impact of the driving task (monotonous nature, environment, duration, etc.)
on the vigilance level. The paired t-test demonstrated significant differences that led to strengthening the impact of the driving task in declining the vigi- lance. In addition, the substantial effect size (i.e., Cohen’s d) underscored the practical significance of driving tasks in altering subjective sleepiness. The increase in mean and median PVT reaction times post-driving, supported by the paired t-test, drew attention to the impact of driving task on the psychomotor performance among the participants.
Additionally, the decrease in PVT speed, while statistically significant (p <.0001) exhibited a complex interplay of driving-related factors on influ- encing the driving behaviour. It means that there was a significant decrease in response to the PVT stimuli post driving among participants. The Cohen’s d for PVT speed showed a noticeable drop, indicating potential adap- tive changes in driving behavior. This emphasizes a clear deterioration in psychomotor vigilance following the driving task.
The simulation environment that we validated in this study can serve other researchers in their work on vigilance. Methods to induce hypovigilance in previous work involved sleep deprivation (Ahn et al., 2016; Nguyen et al., 2017), prolonged task engagement from 2h to 4h (Naeeri et al., 2019), vary- ing workload demands (Gateau et al., 2015) or monotonous driving (Li et al., 2008). In this study, we showed that a 1-h monotonous drive using a low- cost driving simulator was sufficient to induce a notable lack of vigilance within the first 30 minutes. This setup offered a realistic microworld simu- lation for participants to remain engaged in the task while controlling the environmental factors to induce lack of vigilance – alternating between green and desert biomes – and having a secondary detection task embedded as an accurate world element; see (Cooke and Shope, 2004) for a discussion on the advantages of realistic simulations and microworlds.
The findings of this study serve as an advancement in the initial stage towards developing a neuroadaptive system for detecting vigilance decline to augment driving safety. This research effectively substantiates the efficacy of the designed driving task system in inducing vigilance decline, thus estab- lishing a foundational understanding of its operational effectiveness. This observation is pivotal for the progression of the neuroadaptive system development, ensuring that the driving task is a reliable inducer of vigilance decline. It is acknowledged that a comprehensive understanding of vigilance necessitates a multimodal approach considering neurophysiological mea- sures along with subjective and behavioral measures (cf. Marois et al., 2023). While this study successfully establishes the effectiveness of driving task in inducing vigilance decline, the next phases of research will focus on analysing the various neurophysiological measures collected. This includes utilizing experimental data related to EEG signals, EDA, oculometry, ECG, and facial feature recognition under similar driving conditions. The ulti- mate goal is to use the data to develop prediction models. These models will play a pivotal role in accurately detecting vigilance decline. Such neu- rophysiological prediction models exist, as raised in Marois et al. (2023). Most of them have been specifically developed for driving use cases (see, e.g., Awais et al., 2017; Guo et al., 2016; Leng et al., 2015; Li et al.,
Validation of Vigilance Decline Capability in a Simulated Test Environment 55
2015; Salvati et al., 2021). Yet, most of these models rely on a set of intru- sive sensors, including, for instance, ECG, EEG and EDA. Such measures impose one to wear electrodes, garments or other types of apparel that directly collect signal from the head or the body, which can also be prone to movement artifacts, thus reducing their potential for real-life implemen- tations. Given the variety in neurophysiological markers collected in this study, further work will aim at producing prediction models from all the fused neurophysiological signals, but also to develop models based solely on the nonintrusive sensors used through the extraction of several features related to hypovigilance. Intrusive markers, along with behavioral markers of hypovigilance such as those analyzed in the current study, will serve as ground truth measures to improve the validity and granularity of the vigilance state predictions for real-time applications (e.g., using the Karolinsa Drowsiness Test classifications from the EEG signal, Akerstedt et al., 2010). Such model could then ultimately be integrated into low-intrusion closed-loop attention management systems, deployable in several contexts and capable of provid- ing countermeasures when periods of hypovigilance are detected (see, e.g., St. John et al., 2006).
This study is subject to the following limitations. First, participants were younger, with the oldest participant being at most 35 years old. Replicating the testbed with a larger and more diverse population could provide a more comprehensive understanding of vigilance decline induction. Second, we con- ducted the test in the morning in a controlled environment. Investigating the temporal aspects of driving, particularly the effect of driving in the morn- ing versus the afternoon, may provide better insights into vigilance decline patterns.
CONCLUSION
Our study successfully tested and confirmed the simulated driving testbed’s ability to induce vigilance decline. Through comprehensive subjective assess- ments and psychomotor performance metrics, we observed a significant reduction in vigilance level after the driving task. The testbed promptly trig- gered vigilance lapses within the first 18 minutes, particularly in the desert biome segment. This validation of testbed’s efficacy holds practical impor- tance by paving the way for future investigations into neuroadaptive control strategies. These insights offer promising avenues for refining our under- standing and application of vigilance management, marking a significant step forward in developing a non-invasive intelligent neuroadaptive system capable of detecting vigilance states in extreme and challenging operational situations.
ACKNOWLEDGEMENT
The authors thank all participants who took part in the study. This work was supported by Consortium de recherche et d’innovation en aérospa- tiale au Québec (CRIAQ) and DEpendable & Explainable Learning (DEEL) Québec.
REFERENCES
Ahn, S., Nguyen, T., Jang, H., Kim, J. G., Jun, S. C., 2016. Exploring Neuro- Physiological Correlates of Drivers’ Mental Fatigue Caused by Sleep Deprivation Using Simultaneous EEG, ECG, and fNIRS Data. Frontiers in Human Neuro- science 10. Åkerstedt, T., Gillberg, M., 1990. Subjective and Objective Sleepiness in the Active
Individual. International Journal of Neuroscience 52, 29–37. https://doi.org/10. 3109/00207459008994241 Akerstedt, T., Ingre, M., Kecklund, G., Anund, A., Sandberg, D., Wahde, M., Philip, P., and Kronberg, P. (2010) “Reaction of sleepiness indicators to partial sleep deprivation, time of day and time on task in a driving simulator—The DROWSI project”, Journal of Sleep Research, 19, 298–309. https://doi.org/10.1111/j.1365- 2869.2009.00796.x Akin, M., Kurt, M. B., Sezgin, N., Bayram, M., 2008. Estimating vigilance level
by using EEG and EMG signals. Neural Comput & Applic 17, 227–236. https: //doi.org/10.1007/s00521-007-0117-7 Aston-Jones, G., Cohen, J. D., 2005. An integrative theory of locus coeruleusnorepinephrine function: adaptive gain and optimal performance. Annu Rev Neu- rosci 28, 403–450. https://doi.org/10.1146/annurev.neuro.28.061604.135709 Awais, M., Badruddin, N., and Drieberg, M. (2017) “A hybrid approach to detect
driver drowsiness utilizing physiological signals to improve system performance and wearability”, Sensors, 17, 1991. https://doi.org/10.3390/s17091991 Biondi, F. N., Graf, F., Pillai, P., Balasingam, B., 2023. On validating a generic camera-based blink detection system for cognitive load assessment. Cognitive Computation and Systems 5, 255–264. https://doi.org/10.1049/ccs2.12088 Bitkina, O. Vl., Park, J., Kim, H. K., 2021. The ability of eye-tracking metrics to clas-
sify and predict the perceived driving workload. International Journal of Industrial Ergonomics 86, 103193. https://doi.org/10.1016/j.ergon.2021.103193 Campagne, A., Pebayle, T., Muzet, A., 2004. Correlation between driving errors and vigilance level: influence of the driver’s age. Physiology & Behavior 80, 515–524. https://doi.org/10.1016/j.physbeh.2003.10.004 Cooke, N. J., and Shope, S. M. (2004) “Designing a synthetic task environment”,
in: S. G. Schiflett, L. R. Elliott, E. Salas, and M. D. Coovert (eds) Scaled Worlds: Development, Validation and Applications, pp. 263–278. Ashgate. Dinges, D. F., Pack, F., Williams, K., Gillen, K. A., Powell, J. W., Ott, G. E., Aptowicz, C., Pack, A. I., 1997. Cumulative sleepiness, mood disturbance, and psychomotor vigilance performance decrements during a week of sleep restricted to 4–5 hours per night. Sleep 20, 267–277. Dorrian, J., Lamond, N., Kozuchowski, K., Dawson, D., 2008. The driver vigilance
telemetric control system (DVTCS): investigating sensitivity to experimentally induced sleep loss and fatigue. Behav Res Methods 40, 1016–1025. https://doi. org/10.3758/BRM.40.4.1016 Durmer, J. S., Dinges, D. F., 2005. Neurocognitive Consequences of Sleep Deprivation. Semin Neurol 25, 117–129. https://doi.org/10.1055/s-2005-867080 Ely, E. W., Gautam, S., Margolin, R., Francis, J., May, L., Speroff, T., Truman, B.,
Dittus, R., Bernard, R., Inouye, S. K., 2001. The impact of delirium in the intensive care unit on hospital length of stay. Intensive Care Med 27, 1892–1900. https: //doi.org/10.1007/s00134-001-1132-2 Gateau, T., Durantin, G., Lancelot, F., Scannella, S., Dehais, F., 2015. Real-time state estimation in a flight simulator using fNIRS. PloS one 10, e0121279.
Validation of Vigilance Decline Capability in a Simulated Test Environment 57
Granholm, E., Asarnow, R. F., Sarkin, A. J., Dykes, K. L., 1996. Pupillary responses index cognitive resource limitations. Psychophysiology 33, 457–461. https://doi. org/10.1111/j.1469-8986.1996.tb01071.x Graw, P., Kräuchi, K., Knoblauch, V., Wirz-Justice, A., Cajochen, C., 2004. Circadian
and wake-dependent modulation of fastest and slowest reaction times during the psychomotor vigilance task. Physiology & Behavior 80, 695–701. https://doi.org/ 10.1016/j.physbeh.2003.12.004 Guo, M., Li, S., Wang, L., Chai, M., Chen, F., and Wei, Y. (2016) “Research on the relationship between reaction ability and mental state for online assessment of driving fatigue”, International Journal of Environmental Research and Public Health, 13, 1174. https://doi.org/10.3390/ijerph13121174 Harbluk, J. L., Burns, P. C., Lochner, M., Trbovich, P. L., 2007. Using the Lane-
Change Test (LCT) to Assess Distraction: Tests of Visual-Manual and Speech- Based Operation of Navigation System Interfaces, in: Proceedings of the 4th International Driving Symposium on Human Factors in Driver Assessment, Train- ing, and Vehicle. Presented at the Driving Assessment Conference, University of Iowa, Stevenson, Washington, USA, pp. 16–22. Hart, S. G. (2006). Nasa-Task Load Index (NASA-TLX); 20 Years Later. Proceedings of the Human Factors and Ergonomics Society Annual Meeting, 50(9), 904–908. https://doi.org/10.1177/154193120605000909 Johns, M. W., 1991. A New Method for Measuring Daytime Sleepiness: The Epworth
Sleepiness Scale. Sleep 14, 540–545. https://doi.org/10.1093/sleep/14.6.540 Kashevnik, A., Shchedrin, R., Kaiser, C., Stocker, A., 2021. Driver Distraction Detection Methods: A Literature Review and Framework. IEEE Access 9, 60063–60076. https://doi.org/10.1109/ACCESS.2021.3073599 Kerick, S., Metcalfe, J., Feng, T., Ries, A., McDowell, K., 2013. Review of Fatigue
Management Technologies for Enhanced Military Vehicle Safety and Performance. Leng, L. B., Giin, L. B., and Chung, W.-Y. (2015) “Wearable driver drowsiness detection system based on biomedical and motion sensors”, IEEE Sensors, 2015, 1– 4. https://doi.org/10.1109/ICSENS.2015.7370355 Leon-Carrion, J., Leon-Dominguez, U., 2012. Functional Near-Infrared Spec-
troscopy (fNIRS): Principles and Neuroscientific Applications, in: Bright, P. (Ed.), Neuroimaging - Methods. InTech. https://doi.org/10.5772/23146 Li, M., Fu, J.-W., Lu, B.-L., 2008. Estimating vigilance in driving simulation using probabilistic PCA, in: 2008 30th Annual International Conference of the IEEE Engineering in Medicine and Biology Society. Presented at the 2008 30th Annual International Conference of the IEEE Engineering in Medicine and Biology Soci- ety, IEEE, Vancouver, BC, pp. 5000–5003. https://doi.org/10.1109/IEMBS.2008. 4650337 Li, G., Lee, B.-L., and Chung, W.-Y. (2015) “Smartwatch-based wearable EEG system
for driver drowsiness detection”, IEEE Sensors Journal, 15, 7169–7180. https: //doi.org/10.1109/JSEN.2015.2473679 Luna, F. G., Barttfeld, P., Martín-Arévalo, E., Lupiáñez, J., 2022. Cognitive load mitigates the executive but not the arousal vigilance decrement. Consciousness and Cognition 98, 103263. https://doi.org/10.1016/j.concog.2021.103263 Lutnyk, L., Rudi, D., Schinazi, V. R., Kiefer, P., Raubal, M., 2023. The effect of flight
phase on electrodermal activity and gaze behavior: A simulator study. Applied Ergonomics 109, 103989. https://doi.org/10.1016/j.apergo.2023.103989 Mackie, R., 2013. Vigilance: Theory, Operational Performance, and Physiological Correlates. Springer Science & Business Media.
Marois, A., Kopf, M., Fortin, M., Huot-Lavoie, M., Martel, A., Boyd, J. G., Gagnon, J.-F., Archambault, P. M., 2023. Psychophysiological models of hypovigilance detection: A scoping review. Psychophysiology 60, e14370. https://doi.org/10. 1111/psyp.14370 Mullen, T. R., Kothe, C. A. E., Chi, Y. M., Ojeda, A., Kerth, T., Makeig, S., Jung, T.-P.,
Cauwenberghs, G., 2015. Real-time neuroimaging and cognitive monitoring using wearable dry EEG. IEEE Transactions on Biomedical Engineering 62, 2553–2567. https://doi.org/10.1109/TBME.2015.2481482 Mackworth, N. H. (1948). The Breakdown of Vigilance during Prolonged Visual Search. Quarterly Journal of Experimental Psychology, 1(1), 6–21. https://doi.or g/10.1080/17470214808416738 Naeeri, S., Mandal, S., Kang, Z., 2019. Analyzing pilots’ fatigue for prolonged flight
missions: Multimodal analysis approach using vigilance test and eye tracking. Proceedings of the Human Factors and Ergonomics Society Annual Meeting 63, 111–115. https://doi.org/10.1177/1071181319631092 Nguyen, T., Ahn, S., Jang, H., Jun, S. C., Kim, J. G., 2017. Utilization of a combined EEG/NIRS system to predict driver drowsiness. Sci Rep 7, 43933. https://doi.org/ 10.1038/srep43933 Oken, B. S., Salinsky, M. C., Elsas, S. M., 2006. Vigilance, alertness, or sus-
tained attention: physiological basis and measurement. Clin Neurophysiol 117, 1885–1901. https://doi.org/10.1016/j.clinph.2006.01.017 Parasuraman, R., 1979. Memory Load and Event Rate Control Sensitivity Decrements in Sustained Attention. Science 205, 924–927. https://doi.org/10.1126/scie nce.472714 Pattyn, N., Neyt, X., Henderickx, D., Soetens, E., 2008. Psychophysiological inves-
tigation of vigilance decrement: Boredom or cognitive fatigue? Physiology & Behavior 93, 369–378. https://doi.org/10.1016/j.physbeh.2007.09.016 Pessoa, L., 2009. How do emotion and motivation direct executive control? Trends in Cognitive Sciences 13, 160–166. https://doi.org/10.1016/j.tics.2009.01.006 Piquado, T., Isaacowitz, D., Wingfield, A., 2010. Pupillometry as a Measure of
Cognitive Effort in Younger and Older Adults. Psychophysiology 47, 560–569. https://doi.org/10.1111/j.1469-8986.2009.00947.x Rahman, H., Ahmed, M. U., Barua, S., Begum, S., 2020. Non-contact-based driver’s cognitive load classification using physiological and vehicular parameters. Biomedical Signal Processing and Control 55, 101634. https://doi.org/10.1016/j. bspc.2019.101634 Regula, M., Socha, V., Kutílek, P., Socha, L., Hána, K., Hanáková, L., Szabo, S.,
2014. Study of heart rate as the main stress indicator in aircraft pilots, in: Proceed- ings of the 16th International Conference on Mechatronics - Mechatronika 2014. Presented at the Proceedings of the 16th International Conference on Mechatron- ics - Mechatronika 2014, pp. 639–643. https://doi.org/10.1109/MECHATRONI KA.2014.7018334 Reid, G. B., Nygren, T. E., 1988. The Subjective Workload Assessment Technique: A Scaling Procedure for Measuring Mental Workload, in: Hancock, P. A., Meshkati, N. (Eds.), Advances in Psychology, Human Mental Workload. North-Holland, pp. 185–218. https://doi.org/10.1016/S0166-4115(08)62387-0 Reifman, J., Kumar, K., Khitrov, M. Y., Liu, J., Ramakrishnan, S., 2018. PC-PVT 2.0:
An updated platform for psychomotor vigilance task testing, analysis, prediction, and visualization. Journal of Neuroscience Methods 304, 39–45. https://doi.org/ 10.1016/j.jneumeth.2018.04.007
Validation of Vigilance Decline Capability in a Simulated Test Environment 59
Rush, B., Celi, L. A., Stone, D. J., 2019. Applying machine learning to continuously monitored physiological data. J Clin Monit Comput 33, 887–893. https://doi.or g/10.1007/s10877-018-0219-z Salvati, L., d’Amore, M., Fiorentino, A., Pellegrino, A., Sena, P., and Villecco, F.
(2021) “On-road detection of driver fatigue and drowsiness during medium- distance journeys”, Entropy, 23, 135. https://doi.org/10.3390/e23020135 Sara, S. J., Bouret, S., 2012. Orienting and Reorienting: The Locus Coeruleus Mediates Cognition through Arousal. Neuron 76, 130–141. https://doi.org/10.1016/j. neuron.2012.09.011 Stemberger, J., Allison, R. S., Schnell, T., 2010. Thermal Imaging as a Way to Clas-
sify Cognitive Workload, in: 2010 Canadian Conference on Computer and Robot Vision. Presented at the 2010 Canadian Conference on Computer and Robot Vision, pp. 231–238. https://doi.org/10.1109/CRV.2010.37 St. John, M., Risser, M. R., and Kobus, D. A. (2006) “Toward a usable closed-loop attention management system: Predicting vigilance from minimal contact head, eye, and EEG measures”, Proceedings of the Second International Conference on Augmented Cognition. San Francisco: ACI. van Weelden, E., Alimardani, M., Wiltshire, T. J., Louwerse, M. M., 2022. Avia-
tion and neurophysiology: A systematic review. Applied Ergonomics 105, 103838. https://doi.org/10.1016/j.apergo.2022.103838 Warm, J. S., 1980. The Psychophysics of Vigilance. Proceedings of the Human Factors Society Annual Meeting 24, 605–605. https://doi.org/10.1177/ 1071181380024001155 Warm, J. S., Finomore, G. M. and V. S. F., 2008. Vigilance, Workload, and Stress, in: Performance Under Stress. CRC Press. Zhou, Y., Huang, S., Xu, Z., Wang, P., Wu, X., Zhang, D., 2022. Cognitive
Workload Recognition Using EEG Signals and Machine Learning: A Review. IEEE Transactions on Cognitive and Developmental Systems 14, 799–818. https://doi.org/10.1109/TCDS.2021.3090217
LISTED IN THE AHFE DIGITAL BOOKSTORE CATALOGUE
Explore the complete digital volume
Neuroergonomics and Cognitive Engineering
Read this individual research paper free through the original publisher, or explore the full digital proceedings book.
ISBN 978-1-964867-02-1
Explore this ISBN in the AHFE Bookstore ↗Listed in the July 2026 bookstore catalogue; search by ISBN to confirm current availability · Digital book purchase optional