Xinran Liu, Li Xu (2023). The impact of the complexity of the interactive interface of e-commerce apps on user satisfaction and efficiency. In: Human Interaction & Emerging Technologies (IHIET 2023): Artificial Intelligence & Future Applications. AHFE Open Access, vol. 111, pp. 478–487. https://doi.org/10.54941/ahfe1004054
Objective With the rapid development of e-commerce, more and more people have begun to use e-commerce apps for online shopping. However, with the continuous expansion of e-commerce App functions, its interactive interface is becoming increasingly complex. This could affect user satisfaction and shopping efficiency, but the issue must be thoroughly studied. Therefore, this study explores the impact of the complexity of e-commerce apps' interactive interfaces on user satisfaction and efficiency. Methods A questionnaire survey was conducted in this study on the aspects of function and content, navigation bar, controls and elements, layout and design, device compatibility, and their satisfaction scores were collected. A total of 89 valid questionnaires were collected from Chinese users. Then SPSS was used for data analysis.Results The results show that the complexity of the interactive interface of e-commerce apps significantly impacts user satisfaction and efficiency. There is a negative relationship between the complexity of the interactive interface and shopping satisfaction and a negative relationship between the complexity and shopping efficiency. In addition, users pay more attention to product information's presentation and recommendation function when shopping. Hence, they must pay more attention to these aspects when designing e-commerce apps. Conclusion and Revelation This study confirmed the influence of the complexity of the e-commerce App interface on user satisfaction and efficiency. Our results suggest that simplified versions of e-commerce apps can improve shopping efficiency. These results suggest that e-commerce App developers need to balance shopping efficiency and user satisfaction in interactive interface design and make customized designs according to the needs of their target user groups.Keywords: Interactive interface complexity, user satisfaction, shopping efficiency
With the popularity of the mobile Internet, e-commerce apps have become one of the main ways for people to shop. The interactive interface of e-commerce apps is also virtual for users to interact with apps. A well-designed interface, whether in selecting content subject matter or appl- ying design elements, can enable users to quickly and effectively access the required information and obtain emotional satisfaction (Zhang, S. and Xu, L., 2022). However, as the functions of e-commerce apps continue to expand,
The Impact of the Complexity of the Interactive Interface of E-Commerce Apps 479
their user interfaces become more complex. Although e-commerce apps pro- vide users with a convenient shopping experience, the complexity of the interactive interface often affects users’ shopping satisfaction and efficiency. However, this problem has yet to be thoroughly studied. Therefore, this paper aims to explore the impact of the complexity of the interactive interface of e-commerce apps on user satisfaction and efficiency and put forward relevant suggestions.
REVIEW OF RELEVANT RESEARCH Interactive Interface Design
The interactive interface is the communication medium between users and products. The behavior and feedback information of users reflects the intera- ctive relationship between products and users. The existing interactive inter- face realizes the interaction and communication between people and products through a two-dimensional electronic screen. This two-dimensional electro- nic screen also realizes the function of information transmission through the interaction between users and products (Li, X., 2020).
Secondly, the interactive interface, also known as the user interface, is the output result of the user input command. The user interface of e-commerce apps is the primary medium for the interaction between people and mobile phones. The design of the interaction interface affects the interaction efficie- ncy and, thus, the user experience. A complex mobile phone interface requires users to spend much time operating (Hyowon Lee et al., 2017), while an optimized mobile phone interface requires less time to complete the same operation. Good interactive interface design works must be able to move users’ hearts and meet their psychological needs.
Existing Research on the Definition and Impact of User Interface Complexity In the current research, some scholars have interpreted and analyzed the com- plexity of user interfaces to some extent. A literature search found that in recent years, most literature introducing web design and website optimization mentioned that web pages should be simple rather than complex. A simple web style has a more visual impact effect and can better convey information (Xu, M., 2009) (Zhou, L., 2007). Jiang Wei said that the complexity of the commodity display page is the richness of the elements on the page, that is, the total index size of the element type and quantity(Jiang, W. 2012). If the value is significant, it indicates that the page’s content is complex and detailed, such as listing all the commodity functions; If the value is small, it means that the page’s content is concise and the information is concentrated. For example, only the product’s main attributes are listed. Moreover, visitors’ reception and interpretation of information may also have different effects due to different ways of presenting commodity information, affecting consumers’ satisfaction and thus having different influences on purchasing decisions. In addition, Marshan McLuhan proposed in 1964 that the binding effect of media comes from its form rather than the content of the information itself (McLuhan M. 1964).
480 Liu and Xu
Therefore, with the development of interactive technology, the product performance brought by user experience will become the focus of attention. The design of an interactive interface is no longer just the appearance design and some simple, functional design.
RESEARCH DESIGN Research Problem
In order to study the influence of the complexity of the interactive interface of e-commerce apps on user satisfaction and efficiency, we investigated the frequency of users using e-commerce apps, the satisfaction of users on the complexity of the interface of e-commerce apps currently used, and the shop- ping efficiency. Besides, the factors that affect users’ shopping satisfaction and efficiency are investigated from five aspects: function and content, navigation bar, page and layout, elements and controls, and device compatibility.
Research Method In the research method, it is necessary to define the specific research program and implementation process. For this study, the following two methods are adopted:
x Questionnaire: Questionnaires about user interface complexity, user satisfaction, and efficiency are designed to investigate and study e-commerce App users.
y SPSS data analysis: The research results were analyzed and displayed through statistical analysis and data visualization.
Research Hypothesis This study assumes that the complexity of the interactive interface of e-commerce apps will impact user satisfaction and efficiency. Specifically, the complexity of the interactive interface of e-commerce apps is negatively correlated with user satisfaction. That is, the more complex the interface is, the lower the user satisfaction is. The complexity of the interactive inter- face of e-commerce apps is negatively correlated with the shopping efficiency of users; that is, the more complex the interface is, the lower the shopping efficiency of users.
At the same time, this study also assumes that users’ experience and profi- ciency in using e-commerce apps will also influence the degree of complexity of interactive interfaces on satisfaction and efficiency. Specifically, users with higher experience and proficiency can better deal with complex interactive interfaces to reduce the negative impact of the complexity of interactive interfaces on satisfaction and efficiency.
DATA COLLECTION AND ANALYSIS Descriptive Statistical Analysis
Eighty-nine valid questionnaires were collected in this survey, including 26 males and 63 females, among which users aged 18–35 accounted for about
The Impact of the Complexity of the Interactive Interface of E-Commerce Apps 481
93%, and students accounted for about 55% (Table 1–Table 3). According to the questionnaire survey, all respondents who fill in the questionnaire have used e-commerce apps and use them frequently. About 94% use e-commerce apps more than twice a week (Table 4–Table 5). Then, SPSS will be further used for the collected questionnaire data’s correlation and linear regression analysis.
Table 1. The age ratio of surveyed users.
Table available in the original PDF paper.
Frequency Percentage Effective percentage
Cumulative percentage Effective 18-25 years old 63 70.8 70.8 70.8 Under 18 years old 1 1.1 1.1 71.9 26-35 years old 19 21.3 21.3 93.3 36-45 years old 1 1.1 1.1 94.4 Over 45 years old 5 5.6 5.6 100.0 Total 89 100.0 100.0
Table 2. Gender proportion of surveyed users.
Table available in the original PDF paper.
Frequency Percentage Effective percentage Cumulative percentage Effective Male 26 29.2 29.2 29.2 Female 63 70.8 70.8 100.0 Total 89 100.0 100.0
Table 3. Occupation proportion of survey users.
Table available in the original PDF paper.
Frequency Percentage Effective percentage
Cumulative percentage
10 11.2 11.2 100.0
Effective Teacher 2 2.2 2.2 2.2 Ordinary white-collar worker 14 15.7 15.7 18.0 Other 11 12.4 12.4 30.3 Retirees 3 3.4 3.4 33.7 Student 49 55.1 55.1 88.8 Staff of government, private and foreign enterprises Total 89 100.0 100.0
Table 4. Investigates whether users have used e-commerce apps.
Table 5. Surveys the frequency proportion of weekly shopping by e-commerce apps.
Table available in the original PDF paper.
Frequency Percentage Effective percentage
Cumulative percentage
17 19.1 19.1 57.3
Effective One or two times 5 5.6 5.6 5.6 3-4 times 9 10.1 10.1 15.7 Use every day 20 22.5 22.5 38.2 Open it in your spare time and place orders with passion Use it when you need it 38 42.7 42.7 100.0 Total 89 100.0 100.0
482 Liu and Xu
Correlation Analysis Correlation analysis is to study the correlation between two quantitative data, and correlation analysis is to study whether there is a relationship. There are two kinds of correlation coefficient calculation; one is the Pearson correla- tion coefficient (default), and The other is called the Spearman correlation coefficient (which is very rarely used). In this study, the Pearson correlation coefficient was used to indicate the strength of the correlation.
According to the below table (Table 6), it is found that there is a correla- tion between the interface complexity of the e-commerce apps recently used by users and user satisfaction and efficiency. Specific analysis shows that: the correlation coefficient between the complexity of the interactive inter- face of the recently used e-commerce APP and the shopping efficiency of the recently used e-commerce APP is −0.489, and p < 0.01, thus indicating that the most recently used e-commerce APP. There is a very significant nega- tive correlation between the complexity of the APP’s interactive interface and the shopping efficiency of the recently used e-commerce APP (Hauke J and Kossowski T. 2011). The correlation coefficient value between the comple- xity of the interactive interface of the recently used e-commerce APP and the shopping satisfaction of the recently used e-commerce APP is −0.342, and p < 0.01, thus indicating the interaction of the recently used e-commerce APP (Arndt S et al. 1999). There is also a significant negative correlation between the complexity of the interface and the shopping satisfaction of the recently used e-commerce APP (Zhang, H., Xu, J., 2009).
Table 6. Correlation between the complexity of the interactive interface of the e-commerce App recently used by the user and the shopping efficiency and satisfaction of the user.
Table available in the original PDF paper.
Shopping efficiency of recently used e-commerce apps
Shopping satisfaction of recently used e-commerce apps
The complexity of the interactive interface of the recently used e-commerce APP
1
The complexity of the interactive interface of the recently used e-commerce APP
.489** - 1
Shopping efficiency of recently used e-commerce apps
.342** - .684** 1
Shopping satisfaction of recently used e-commerce apps **. Correlation is significant at the 0.01 level (two-tailed).
Linear Regression Analysis Regression analysis is to study the influence relationship between quan- titative data (Sun D., 2000). Regression analysis is essential to study the influence relationship between X (independent variable, usually quantita- tive data) and Y (dependent variable, quantitative data) (A. Colin and
The Impact of the Complexity of the Interactive Interface of E-Commerce Apps 483
Pravin K. 2005). Correlation does not necessarily mean regression Influence relationship (William H. Green 1998).
Linear Regression Analysis of Interaction Interface Complexity and Shopping Efficiency According to the results of the below table (Table 7), the adjusted R-squared value is 0.230, which means that the shopping efficiency of the e- commerce apps recently used by users is 23% likely to be influenced by the recently used e-commerce apps and influenced by the complexity of the interface.
According to the results of the below table (Table 8), it can be seen that the calculated significance value is close to 0, p < 0.01, so there is a very signifi- cant correlation between the user’s shopping efficiency and the complexity of the interactive interface of the e-commerce app sexual. Moreover, the B value is −0.456, indicating that the relationship between the two has a relatively apparent negative correlation.
Linear Regression Analysis of Interaction Interface Complexity and Satisfaction According to the results of the below table (Table 9), the adjusted R-squared value is 0.106, which means that the satisfaction of the e-commerce apps recently used by users is 10.6% likely to be influenced by the recently used e-commerce apps and influenced by the complexity of the interface.
Table 7. Summary of the model between the complexity of the interactive interface of the e-commerce App recently used by the user and the shopping efficiency of the userb.
Table available in the original PDF paper.
Durbin Watson Model R R square Adjusted R square Standard Estimated Error 1 .489a .239 .230 .827 1.533
a. Predictor variable: (constant), the complexity of the interaction interface of the most recently used e-commerce APP b. Dependent variable: shopping efficiency of recently used e-commerce APP
Table 8. The coefficient a between the complexity of the interactive interface of the e-commerce App recently used by the user and the shopping efficiency of the usera.
Table available in the original PDF paper.
Collinearity statistics
Model Unnormalized coefficient Standardized coefficient B Standard error Beta t Significant Tolerance VIF
−.456 .087 −.489 −5.229 .000 1.000 1.000
1 (Constant) 4.827 .276 17.512 .000 The complexity of the interactive interface of the recently used e-commerce APP a. Dependent variable: shopping efficiency of recently used e-commerce APP
484 Liu and Xu
Table 9. Summary of the model between the complexity of the interactive interface of the e-commerce App recently used by the user and the user satisfactionb.
Table available in the original PDF paper.
Durbin Watson Model R R square Adjusted R square Standard Estimated Error 1 .342a .117 .106 .902 1.624
a. Predictor variable: (constant), the complexity of the interaction interface of the most recently used e-commerce APP b. Dependent variable: shopping satisfaction of recently used e-commerce APP
Table 10. The coefficient a between the complexity of the interactive interface of the e-commerce App recently used by the user and the user satisfactiona.
Table available in the original PDF paper.
Collinearity statistics
Model Unnormalized coefficient Standardized coefficient B Standard error Beta t Significant Tolerance B
-.322 .095 -.342 -3.389 .001 1.000 1.000
1 (Constant) 4.427 .301 14.718 .000 The complexity of the interactive interface of the recently used e-commerce APP a. Dependent variable: shopping satisfaction of recently used e-commerce APP
According to the results of the above table (Table 10), the calculated signi- ficance value is about 0.01, p < 0.05, so there is a significant correlation between user satisfaction and the complexity of the interactive interface of e-commerce apps. Moreover, the B value is −0.322, indicating a relatively apparent negative correlation.
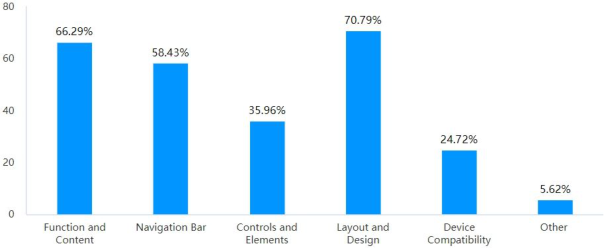
Other Data Analysis Through the analysis of other data, we found that about 87% of users believe that the complexity of the e-commerce app interface will affect their shopping efficiency and satisfaction to a certain extent (Table 11), among which layout and design are the most important influencing factors for users, accoun- ting for about 71%, followed by functions and content and navigation bar, accounting for about 67% and 58% respectively (Figure 1). In addition, our research found that if the interactive interface of e-commerce apps is sim- plified, about 84% of users will increase their interest in using such apps (Table 12). This provides new reference data and direction for future App interface design.
Table 11. Will the complexity of the interactive interface of e-commerce app affect the user’s shopping efficiency and satisfaction ratio.
Table available in the original PDF paper.
Frequency Percentage Effective percentage Cumulative percentage Efficient No 12 13.5 13.5 13.5 Yes 77 86.5 86.5 100.0 Total 89 100.0 100.0
The Impact of the Complexity of the Interactive Interface of E-Commerce Apps 485
Figure 1: Factors affecting user satisfaction and productivity.Table 12. If the interactive interface of e-commerce APP is simplified, will it increase the proportion of users’ interest in using such APP.
Table available in the original PDF paper.
Frequency Percentage Effective percentage Cumulative percentage Efficient No 9 10.1 10.1 10.1 Other 4 4.5 4.5 14.6 Yes 76 85.4 85.4 100.0 Total 89 100.0 100.0
DISCUSSION AND CONCLUSION Discuss the Findings
The survey results show that the complexity of the interactive interface of e-commerce apps significantly impacts user satisfaction and efficiency. Most users think the interaction interface of e-commerce apps could be more straightforward. At the same time, about 87% of users said that the intera- ction interface of e-commerce apps needs to be simplified, which will reduce their satisfaction. About 48 percent of users said the complex interface of e-commerce apps would make them feel less efficient in shopping.
In addition, the results of the survey also show that the function and con- tent, layout, and design are the main factors that most users think to cause the complexity of the page, accounting for about 66% and 71%, respecti- vely; At the same time, more than half of users think that the navigation bar of some e-commerce apps is a little complicated. In addition, about 85 percent of respondents said that simplifying the interface of e-commerce apps would increase their interest in using such apps.
Put Forward Improvement Measures The results of this survey show that the complexity of the interactive interface of e-commerce apps significantly impacts users’ use efficiency and satisfa- ction. Therefore, this also shows that users’ needs should be fully considered when designing the interactive interface of e-commerce apps. The principle of simplicity and friendliness should be followed to improve the user experience.
486 Liu and Xu
Here are some suggestions to improve the user experience and satisfaction of e-commerce apps: xSimplify the shopping process: When designing the shopping process, try to reduce the number of processes the user must complete so that each process is as straightforward as possible to avoid some tedious operations. For example, all the purchasing processes are concentrated on one page, and all the choices and steps are clear at a glance.
yUser interface should be more friendly: When designing e-commerce apps, users’ habits and needs should be considered, and complex and difficult-to-understand design elements should be avoided. For example, use easy-to-understand elements such as ICONS and labels that are easy for users to understand and use.
zCollect user feedback regularly: To continuously optimize the user expe- rience of e-commerce apps, users’ needs, and opinions should be reviewed regularly, and the experience that needs to be optimized and improved should be timely filtered.
Conclusion
The results of this study show that the complexity of the interactive inter- face of e-commerce apps has a significant impact on user satisfaction and efficiency; that is, there is a negative relationship between the complexity of the interactive interface and shopping satisfaction, and it also has a negative relationship with shopping efficiency. Specifically, when the complexity of the interactive interface of e-commerce apps increases, user satisfaction will decrease, and user efficiency will also be affected. This means overly complex interactive interfaces should be avoided when designing e-commerce apps to improve user satisfaction and efficiency.
Limitations and Future Research This study confirmed the impact of the complexity of e-commerce apps’ interactive interfaces on user satisfaction and efficiency. Our results suggest that simplified versions of e-commerce apps can improve shopping efficie- ncy. These results suggest that e-commerce App developers need to balance shopping efficiency and user satisfaction in interactive interface design and make customized designs according to the needs of their target user groups. However, the limitation of this study is that the sample size is small, only part of the e-commerce apps are involved, and the number of users participating in the survey needs to be larger, so the generalization of the conclusion may be limited. Future studies can further expand the number of samples, involve more e-commerce apps, and use more evaluation methods and data analysis methods to analyze the obtained data to further explore the influence of the complexity of the interactive interface on user satisfaction and efficiency.
In addition, the research objects of this study are almost teenagers and stu- dents, so it cannot be ruled out that the influence of the experience and skill level of these people in using e-commerce apps is on the experimental results. Therefore, in the future, different complexity levels of interactive interfaces should be considered for different types of users.
The Impact of the Complexity of the Interactive Interface of E-Commerce Apps 487
REFERENCES
Arndt S, Turvey C, Andreasen N C. (1999) Correlating and predicting psychiatric symptom ratings: Spearmans r versus Kendalls tau correlation. Journal of Psychiatric Research, Volume 33 No. 2 pp. 97–104. Cameron (A. Colin) and Trivedi (Pravin K.). (2005) Microeconometrics; Methods
and Applications, Cambridge and New York: Cambridge University Press. Hauke J, Kossowski T. (2011) Comparison of Values of Pearson’s and Spearman’s Correlation Coefficients on the Same Sets of Data. Quaestiones Geographicae, Volume 30 No. 2 pp. 87–93. Hyowon Lee, Alan Smeaton, Noel Murphy, Sean Marlow. (2017) User Interface
Design for a Web-based Image Processing and Analysis System. Jiang, W., (2012) Research on the Web Page Complexity Preference of Consumers with Different Cognitive Styles, Hefei University of Technology. Li, X., (2020) Research on Emotional Factors in Interface Design, WESTERN
LEATHER Volume 42 No. 27 pp. 116–122. McLuhan M. (1964) Understanding Media: The Extensions of Man. New York: McGraw—Hill. Sun D., (2000) Selection of the Linear Regression Model According to the Parameter
Estimation[J]. Wuhan University Journal of Natural Sciences, Volume 5 No. 4 pp. 400–405. William H. Green, (1998) Econometric Analysis, Beijing: China Social Sciences Press. Xu, M., (2009) Talking about the Basic Requirements of Website Style Design, Journal of Tianjin Radio and Television University, Volume 13 No. 1 pp. 59–62. Zhang, H., Xu, J., (2009) Modern Psychological and Educational Statistics 3rd
Edition, Beijing Normal University Press. Zhang, S., Xu, L., (2022) The application of semiotics in the design of humancomputer interaction interface, SCREEN PRINITING Volume 14, pp. 44–47. Zhou, L., (2007) Reflections on the Design of Commercial Shopping Websites in the
Internet Era, China Association for Science and Technology, Harmonious Develo- pment of Energy Conservation and Environmental Protection——Proceedings of the 2007 China Association for Science and Technology Annual Conference (2), pp. 830–832.
Read this individual research paper free through the original publisher, or explore the full digital proceedings book.
ISBN 978-1-958651-87-2
Explore this ISBN in the AHFE Bookstore ↗Listed in the July 2026 bookstore catalogue; search by ISBN to confirm current availability · Digital book purchase optional