Ahamed Altaboli, Ruwida Muttardi, Hager Alahmar, Hana Aliskandarani, Ala Alshaikhi (2023). Anthropometric Evaluation of University Classroom Furniture. In: Physical Ergonomics and Human Factors. AHFE Open Access, vol. 103, pp. 100–108. https://doi.org/10.54941/ahfe1003040
The objective of this study is to evaluate four types of university classroom furniture. The methods of evaluation included the individual comparisons equations method and the percentile values method; both are anthropometric methods. The third method is a questionnaire-based subjective evaluation method aiming at studying students’ satisfaction. The evaluated furniture dimensions were seat height, seat depth, seat width, backrest height, desk height and underneath desk height. The measured anthropometric dimensions were stature, hip breadth, elbow rest height, shoulder height, knee height, popliteal height and buttock-popliteal length. They were collected from 80 students (half males, aged between 20 to 39 years). The individual comparisons method showed relatively lower percentages of match between the furniture dimensions and student anthropometry. While, the percentile values method showed relatively high percentages of accommodation. Results of the questionnaire showed that the majority of students were satisfied with their preferred designs.
School and university students spend long hours sitting on classroom furni- ture while performing their everyday learning-related tasks, such as reading, writing, etc. A poorly designed furniture may force students to sit in restri- cted and uncomfortable postures. This may lead to dissatisfaction and stress that affects students’ performance negatively and may lead to musculoske- letal problems in the long run. Classroom furniture designs that confirm with related students anthropometrics should reduce such problems, help to achieve comfort and improve students’ performance (Parcells, Stommel and Hubbard, 1999; Agha, 2010; Parvez, Rahman and Tasnim, 2019; Obinna, Sunday and Babatunde, 2021).
The main objective of this study is to collect the related anthropometric data for students at the Industrial and Manufacturing Systems Engineering department at University of Benghazi, and use it to evaluate the existing class- room furniture designs. The objectives also include the study of students’ satisfaction with the existing classroom designs.
Anthropometric Evaluation of University Classroom Furniture 101
Three methods of evaluation were used to achieve the study objectives. The first two are the individual comparisons equations method and the percen- tile values method; both are anthropometric evaluation methods that utilize students’ anthropometric data to evaluate the furniture designs. The third method is a questionnaire-based subjective evaluation method, involving the use of a questionnaire to study students’ level of satisfaction and comfort with the furniture designs.
METHOD
The Classroom Furniture Four types of classroom furniture designs were evaluated, two designs consist of tablet armchair desks (designs 1 and 2), in which the desktop is attached to the chair with a metal frame book storage beneath the chair. The other two designs (designs 3 and 4) consist of separated chairs and tables.
Six dimensions of the classroom furniture were evaluated; namely seat height, seat depth, seat width, backrest height, desk height and under desk height. Measurements of these six dimensions for the four designs are shown in Table 1.
Anthropometric Measurements The study included collecting anthropometric dimensions for 80 students (half males, aged between 20 to 39 years). They were randomly selected out from 326 students enrolled in the department at the time of conducting the study.
Seven anthropometric dimensions were measured: stature, hip breadth sitting, elbow height sitting, shoulder height sitting, knee height, popliteal height and buttock-popliteal length. Measurements were taken at a lab using measurement tapes. The measurements were taken according to procedures described in (Bridger, 2018; Pheasant and Haslegrave, 2018). All measu- rements were taken on the sitting position (except stature) with students wearing light cloths and no shoes.
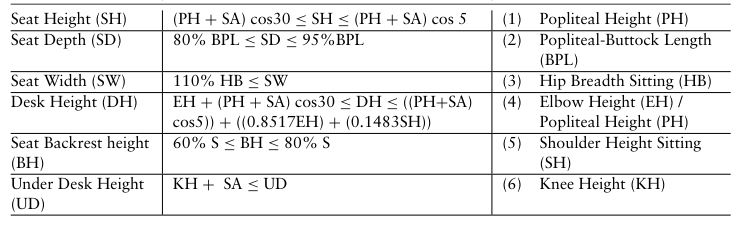
Evaluation Methods Individual Comparisons Equations Six equations were used to test the mismatch between anthropometric measu- res of the students and the dimensions of furniture. These questions are given
Table 1. Measurements of the dimensions of the existing furniture designs (in cm).
in Table 2. These equations are the most widely used method for anthropome- tric evaluating of classroom furniture as reported in the literature (Parcells, Stommel and Hubbard, 1999; Gouvali and Boudolos, 2006; Agha, 2010; Castellucci, Arezes and Viviani, 2010; Macedo et al., 2015; Yanto, Lu and Lu, 2017; Parvez, Rahman and Tasnim, 2019; Obinna, Sunday and Babatunde, 2021). Each equation produces, individually for each student, a range in which the furniture dimension in question is considered suitable for this student. This range is determined for each student per each furniture dimension by using the related equation to calculate either acceptable two limits (upper and lower), or one acceptable limit (upper or lower). The furniture dimen- sion in question is considered suitable for the student if it falls within the calculated range. It is considered inappropriate if it falls outside the range.
As an example, consider using equation (1) in evaluating a fixed seat height of 44.5 cm. Suppose that the popliteal height (PH) of a student is 42 cm and shoes allowance (SA) is 2 cm, then the lower acceptable limit is ((42+2) COS 30 = 37.6 cm) and the upper acceptable limit is ((42+2) COS 5 = 43.3 cm). Comparing this range (37.6-43.3) with the fixed seat height of 44.5 cm; one sees that it falls outside of the range and it is larger than the upper limit (44.5 > 43.3), indicating that the seat height is not suitable for this student (it is high for them).
Percentile Values A percentile value of an anthropometric dimension represents the percentage of the population with a body dimension of a certain size or smaller (Lee et al., 2017). The mean and standard deviation of the relevant anthropometric dimension were used to determine the corresponding percentile values for the furniture dimensions and percentages of accommodation of the populations. Similar procedures were used in (Yanto, Lu and Lu, 2017; Parvez, Rahman and Tasnim, 2019).
Students Satisfaction A questionnaire was designed and used to study students’ satisfaction and comfort with the four existing furniture designs. The questionnaire consists
Anthropometric Evaluation of University Classroom Furniture 103
of nine questions; eight about preference and satisfaction and one about discomfort.
The questionnaire first asks each participated student to indicate which furniture design they preferred, then, it asks the students to indicate if they were satisfied/dissatisfied with their preferred design. In case of dissatisfa- ction, the student was asked to identify with which specific design feature they were dissatisfied (e.g. seat height is high or low).
Students discomfort with the preferred design was determined using a Nor- dic questionnaire body map (Kuorinka et al., 1987) with twelve body regions outlined in the map (head, neck, shoulders, chest, elbows, low back, forearms, wrists/hands, thighs, knees, legs and feet).
RESULTS
Results of Anthropometric Measurements
Table 3 gives means (M) and standard deviations (SD) of the collected anthropometric data.
Results of Individual Comparisons Equations The percentages of match between the classroom furniture dimensions and the students’ anthropometry for each design are shown in Table 4. The results are summarized as percentages of match or mismatch (above the upper acceptable limit and/or below the lower acceptable limit).
From numbers in Table 4, the only case where a 100% match was found is with under desk height in design (4). Relatively higher percentages of match were also found with backrest height in designs 1 and 4. Likewise, relatively higher percentages of match were found with seat width in design 2 and desk height in designs 2 and 3. In all the other cases relatively lower percentage (less than 70%) of match were found.
Results of Percentile Values First, the normality of students’ anthropometric data was checked by using histograms; no considerable deviations from the normal distribution were found.
Table 3. Summary of anthropometric measurements (in cm).
Table 5 contains calculations of the corresponding percentile values for the existing furniture dimensions of the four designs and hypothetical percenta- ges of accommodation of the populations. The mean and standard deviation of the relevant anthropometric dimension -after adding the allowance – were used in the calculations.
As an example, from Table 1, the value of the seat height dimension for design 1 is 37 cm, and from Table 3, the mean of the popliteal height is 47.1 cm and the standard deviation is 3.9 cm. Adding the value of the shoes allo- wance of 2 cm to the mean (modified mean = 49.1 cm), then utilizing the normal distribution probability density function, the result is a percentile of 0.10 %. Since seat height is an upper limit dimension (Lee et al., 2017) that designed based on a lower percentile, the corresponding hypothetical percentage of accommodation is (1-0.0010)*100 = 99.9. This was repeated for all the other dimensions. Percentages of accommodation for seat depth and backrest height were calculated based on lower percentiles since they are upper limit dimensions. Seat width, desk height and under desk height are lower limit dimensions and higher percentiles were used in calculating their percentages of accommodation.
The numbers in the Table 5 show relatively high percentages of accom- modation for most dimensions across all designs. However, still some cases of relatively low percentages of accommodation were found (especially in design 2 and design 3).
Anthropometric Evaluation of University Classroom Furniture 105
Table 5. Corresponding percentiles and percentages of accommodation for the existing furniture dimensions.
Under desk Knee height Percentile 53.44 97.57 72.92 99.93 Percentage of accommodation
Table 6 shows a comparison between the results of the individual compa- risons equations method and the percentile values method. The table lists the percentages of the match of each furniture dimension in each design (given in Table 4) and the percentage of accommodation of each furniture dimen- sion in each design (given in Table 5). In general, there is some consistency between the results of the two methods. There was noticeable compatibi- lity between the results of both methods for seat width, backrest height and under desk height. However, for seat height, seat depth and desk height no clear compatibility could be seen.
The reason why the two method were not completely compatible might be due to the fact that the percentile values method deals with the whole population and assumes that the data collected from the sample is a valid representation of the population. In addition, it uses fixed dimension of the furniture and assumes that all the population with a relevant anthropometric dimension less than (or greater than; depending on type of the dimension) the furniture dimension are accommodated by it. The individual comparison equations method, on the other hand, deals only with the individuals in the collected sample and uses a limited range for comparison for each individual for each dimension.
Results of Students Satisfaction This section discusses the results of the questionnaire used to study stu- dents’ satisfaction and comfort with the existing furniture designs. Table 7 summarizes the questionnaire results regarding students’ satisfaction. These
Table 6. Comparison between the percentages of the match and the percentage of accommodation of each furniture dimension in each design.
Table 7. Summary of questionnaire results regarding students’ preference and satisfaction (as percentages (%) of responses for each item).
Table available in the original PDF paper.
Item Design All
1 2 3 4
The mostly sit on design 2.5 11 42 44.5 - The preferred design 8.75 2.5 8.75 58.75 - Sitting hours per day (on the preferred design) < 2 28.6 0 0 10.6 8.8 2-3 42.9 50.0 42.9 40.4 40 3-4 14.3 50.0 57.1 44.7 47.5 > 4 14.3 0 0 4.3 3.8 Satisfaction with the preferred design 42.9 100 71.4 78.7 72.5 Dissatisfaction with the preferred design 57.1 0 28.6 21.3 27.5 Dissatisfaction is due to:-
Desk height is high 20 50 20 27.3 Desk height is low 10 50 60 50 Seat height is high 10 9.1 Seat height is low 10 50 40 27.3 Backrest is high 20 50 20 22.7 Backrest is low 50 30 22.7 Seat width is narrow 10 4.5 Seat depth is long 20 9.1 Seat depth is short 10 50 10 13.6
results show that design 4 is the mostly sit on and preferred one with percen- tages of (44.5 % and 58.75 %) respectively. Results also show that 47.5 % of the students sit on their preferred design between three to four hours per day.
The results also indicate that the overall satisfaction of the students with the preferred designs is 72.5 % and that dissatisfaction is mostly due to the low desk height with 50%.
Anthropometric Evaluation of University Classroom Furniture 107
Table 8. Summary of questionnaire results regarding students’ physical discomfort (as percentages (%) of responses for each item).
Table available in the original PDF paper.
Item Design All
1 2 3 4
Discomfort with the preferred design 57.1 28.6 21.3 27.3 Discomfort is felt in :- Neck 33.3 45.5 36 Shoulder (right) 33.3 18.2 16 Shoulder (left) 9.1 8 Elbow (right) 9.1 4 Forearm (right) 4 Lower back 80 100 81.8 84 Knee (right) 20 8 Leg (left) 20 4
The questionnaire results regarding students’ physical discomfort with the furniture designs are summarized in Table 8. Students were asked to show- with the help of a Nordic questionnaire body map- in what body region discomfort was felt.
The questionnaire results show that discomfort was felt in eight body regi- ons (from the twelve regions outlined on the body map). The highest overall percentages were recorded in the low back (84 %) and the neck (36 %).
CONCLUSION
The objective of this study is to evaluate four designs of the classroom furni- ture at the Industrial and Manufacturing System Engineering Department at University of Benghazi. Three types of evaluation criteria were utilized; they are the individual comparisons equations, the percentile values and students satisfaction.
The results of the individual comparisons equations gave relatively low percentages of matches in most furniture dimensions. The percentile values method gave relatively high percentages of accommodations for most dimen- sions.
Nonetheless, some noticeable compatibility was found between the results of the two methods.
Results of the subjective evaluation questionnaire regarding students’ sati- sfaction and comfort with the existing furniture designs showed that design 4 is the most sit on and preferred by students. Results also indicated that the majority of students were satisfied with their preferred designs and that dissatisfaction was mostly due to that the desk height was low.
Based on findings of this study, it is recommended that design 3 and design 4 or a combination from both (chair from 3 and table from 4 or vice versa) should be used for the time being. However, to obtain complete percenta- ges of match and accommodation, this study suggests the design and use of fully adjustable dimensions classroom furniture. A less desirable, but proba- bly more practical solution is to design and use improved fixed dimensions
classroom furniture. The data collected and results of this study could be used as basis for designing such furniture.
REFERENCES
Agha, S. R. (2010) ‘School furniture match to students’ anthropometry in the Gaza Strip’, Ergonomics, 53(3), pp. 344–354. doi: 10.1080/00140130903398366. Bridger, R. (2018) Introduction to human factors and ergonomics. Fourth edition.
Boca Raton FL: CRC Press Taylor & Francis Group. Castellucci, H. I., Arezes, P. M. and Viviani, C. A. (2010) ‘Mismatch between classroom furniture and anthropometric measures in Chilean schools’, Applied Ergonomics, 41(4), pp. 563–568. doi: 10.1016/j.apergo.2009.12.001. Gouvali, M. K. and Boudolos, K. (2006) ‘Match between school furniture dimen-
sions and children’s anthropometry’, Applied Ergonomics, 37(6), pp. 765–773. doi: 10.1016/j.apergo.2005.11.009. Kuorinka, I. et al. (1987) ‘Standardised Nordic questionnaires for the analysis of musculoskeletal symptoms’, Applied Ergonomics, 18(3), pp. 233–237. doi: 10.1016/0003-6870(87)90010-X. Lee, J. D. et al. (2017) Designing for People: An Introduction to Human Factors Engineering. CreateSpace Independent Publishing Platform. Available at: https://books.google.com.ly/books?id=8gCTswEACAAJ. Macedo, A. C. et al. (2015) ‘Match between classroom dimensions and stu-
dents’ anthropometry: Re-equipment according to european educational furniture standard’, Human Factors, 57(1), pp. 48–60. doi: 10.1177/0018720814533991. Obinna, F. P., Sunday, A. A. and Babatunde, O. (2021) ‘Ergonomic assessment and health implications of classroom furniture designs in secondary schools: a case study’, Theoretical Issues in Ergonomics Science, 22(1), pp. 1–14. doi: 10.1080/1463922X.2020.1753259. Parcells, C., Stommel, M. and Hubbard, R. P. (1999) ‘Mismatch of classroom furni-
ture and student body dimensions: Empirical findings and health implications’, Journal of Adolescent Health, 24(4), pp. 265–273. doi: 10.1016/S1054-139X (98)00113-X. Parvez, M. S., Rahman, A. and Tasnim, N. (2019) ‘Ergonomic misma- tch between students anthropometry and university classroom furniture’, Theoretical Issues in Ergonomics Science, 20(5), pp. 603–631. doi: 10.1080/1463922X.2019.1617909. Pheasant, S. and Haslegrave, C. M. (2018) Bodyspace, Bodyspace. CRC Press. doi: 10.1201/9781315375212. Yanto, Lu, C. W. and Lu, J. M. (2017) ‘Evaluation of the Indonesian National Stan-
dard for elementary school furniture based on children’s anthropometry’, Applied Ergonomics, 62, pp. 168–181. doi: 10.1016/j.apergo.2017.03.004.
LISTED IN THE AHFE DIGITAL BOOKSTORE CATALOGUE
Explore the complete digital volume
Physical Ergonomics and Human Factors
Read this individual research paper free through the original publisher, or explore the full digital proceedings book.
ISBN 978-1-958651-79-7
Explore this ISBN in the AHFE Bookstore ↗Listed in the July 2026 bookstore catalogue; search by ISBN to confirm current availability · Digital book purchase optional