Almudena Palacios, Francesc Ochando, Jorge Camba, Manuel Contero (2022). The influence of the visualization modality on consumer perception: A case study on household products. In: Human Factors in Communication of Design. AHFE Open Access, vol. 49, pp. 160–166. https://doi.org/10.54941/ahfe1002050
Recent advances in visualization technologies have changed how products are presented to consumers. Sophisticated digital media modalities are gradually replacing traditional formats, but certain product features are difficult to evaluate, which may result in significant perceptual differences. In this paper, we report the results of a within-subjects study in which a group of 40 volunteers evaluated three different designs of a common household product (i.e. a coffee maker) presented in three different visual media: photographs, a non-immersive virtual environment, and an augmented reality experience. Our results show that the presentation medium has a significant effect on product evaluation, and that the semantic scales in Jordan’s socio-logical pleasure category are the most affected by the change of medium.
Advances in e-commerce (Wang et al., 2020) and computing technology have changed how products are presented. Digital artifacts are replacing traditio- nal means of product presentation, even in physical stores (Jiang & Benbasat, 2007). In virtual environments, online retailers are increasingly using adva- nced visualization technologies to enhance the shopping experience of the customer (Kim et al., 2020). For example, 360-degree product representa- tions allow consumers to view the product from various angles, and some companies are introducing augmented reality (AR) technology experiences in their catalogs. However, certain product features are not easy to evaluate. Consumers cannot feel or touch the products, which can be an obstacle for products that require physical interaction (Verhagen et al., 2016) and may lead to perceptual differences.
In the last two decades, researchers have investigated the influence of the presentation medium on product perception (Söderman, 2005), (Artacho- Ramírez et al., 2008), (Chu & Kao, 2020; Felip et al., 2019), and some authors have applied technology such as eye-tracking to understand how certain aspects of a product’s design are perceived (Rojas et al., 2015).
The Influence of the Visualization Modality on Consumer Perception: A Case Study 161
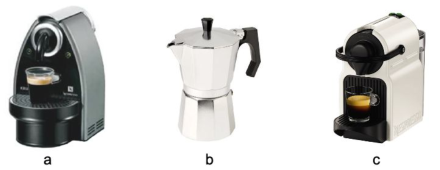
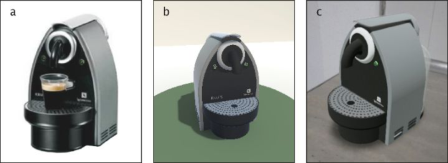
Figure 1: Coffee makers: Nespresso Essenza(a), Moka pot (b) and Nespresso Inissia (c).Figure 2: Presentations of the Nespresso Essenza coffee maker: IMG (a), N-IVE (b), and AR (c).
However, few studies have included AR in the analysis of perceptual diffe- rences when evaluating a product across different media (Agost et al., 2021; Smantak & Mi, 2017), and none have employed Jordan’s pleasure categories (Jordan, 2002) to support the results or semantic differentials for product evaluation.
In this paper, we examine the influence of the presentation media on the evaluation of three different designs of a common household product. We selected a coffee maker as a representative product that many users are familiar with. Coffee makers present more complex functionality than other products used in similar studies (Galán et al., 2021) and high aesthetic and emotional values. The following hypotheses were postulated: H1, the pre- sentation medium influences product evaluation; and H2, the presentation medium influences the purchase decision.
METHODS AND MATERIALS To validate the proposed hypotheses, a within-subjects experiment was desi- gned where each subject evaluated three coffee maker designs: Nespresso Essenza, Moka Pot, and Nespresso Inissia, as shown in Figure 1. A seman- tic differential (Osgood et al., 1957) was used for the evaluation. Users also rated how much they liked each product and the level of confidence in their responses on a scale of 1 - 5. Finally, they were asked to state their purchasing intentions. The products were presented in the following media: Photo- graphs of the physical product (IMG condition) from different viewpoints (Figure 2.a); a 3D model (N-IVE condition) of the product displayed on a table in a virtual environment that could be manipulated using the computer mouse and keyboard (Figure 2.b); and an augmented reality (AR condition)
experience for a mobile phone (Figure 2.c). No interaction with the product was allowed.
The evaluation scale was composed of 8 bipolar pairs of adjectives clas- sified by Jordan’s pleasure categories and used a 7-point Likert-type scale for each semantic differential scale with a neutral value of 0, and 3 as the maximum value at each end. The scales were: Large size – Small size (1), Mini- malist – Overelaborated (2), Classic – Modern (3), Unappealing – Appealing (4), Practical – Impractical (5), Difficult to use – Ease to use (6), Expensive – Inexpensive (7) and Unsustainable – Sustainable (8).
STUDY A total of 40 volunteers participated in the experimental phase (15 women and 25 men with a mean age of 31.38 years old). 62.5% reported to have no previous experience with AR, 27.5% had some experience with AR, and 10% had significant experience with AR. Due to Covid-19 restrictions, some interviews were performed virtually. Basic demographic information was col- lected from participants including gender, age, and previous experience with AR technologies. Next, the three products were presented one at a time and participants were asked to evaluate them. The order of presentation of each product and the presentation method were randomized on every iteration to minimize their influence on the evaluation. The products were visible to participants while completing the evaluations.
RESULTS
To test our hypotheses, an inferential statistical analysis was performed. None of the data sets were normally distributed (the sample size <50, so a Shapiro-Wilk test was applied), so parametric tests were conside- red unsuitable. Instead, the Aligned Rank Transform procedure was used (Higgins et al., 1990) to obtain more robust results. Next, a series of repeated measures one-factor ANOVAs and post-hoc tests (with Bonferroni adju- stments) were performed on each dataset. For the purchase decision, we used Cochran’s Q and McNemar tests.
According to our ANOVA tests, not all the bipolar pairs showed dif- ferences, but some aspects of the product were affected by the change of media. For the Moka Pot, differences were found for four bipolar pairs of adjectives: “Large size – Small size” (F(2,76)=3.40, p=.039), “Classic – Modern” (F(2,76)=20.92, p<.001), “Unappealing – Appealing” (F(2,76)=38.18, p<.001) and “Inexpensive – Expensive” (F(2,76)=17.66, p<.001). These differences were found between N-IVE – AR for “Large size – Small size”(p=.023), between all means for “Classic – Modern”(pIMG – N-IVE =.003, pIMG – AR=.007, pN-IVE – AR <.001) and between IMG – AR and N- IVE – AR for “Unappealing – Appealing” and “Expensive – Inexpensive” (p<.001 for each case).
Differences were also found for the Nespresso Inissia model for the adjectives “Large size – Small size” (F(2,76)=8.26, p=.001), “Overe- laborated – Minimalist” (F(2,76)=6.15, p=.003), “Classic – Modern”
The Influence of the Visualization Modality on Consumer Perception: A Case Study 163
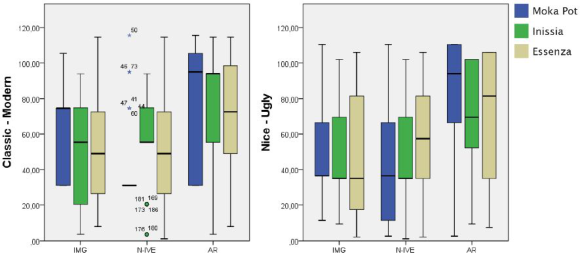
Figure 3: Box plots for “Classic - Modern” and “Appealing –Unappealing”.
(F(2,76)=11.36, p<.001) and “Unappealing – Appealing” (F(2,76)=11.82, p<.001). These differences were found between IMG – AR and N-IVE – AR for “Large size – Small size” (pIMG – AR =.016, pN-IVE – AR <.001), “Classic – Modern” (pIMG – AR<.001, pN-IVE – AR=.007) and “Unappealing – Appe- aling” (pIMG – AR=.001, pN-IVE – AR <.001), and between IMG – AR for “Overelaborated – Minimalist” (p=.003).
Finally, for the Nespresso Essenza model, differences were found for “Ove- relaborated – Minimalist” (F(2,76)=1.54, p=.009), “Classic – Modern” (F(2,76)=12.89, p<.001), “Unappealing – Appealing” (F(2,76)=00.00, p=.001) and “Difficult to use – Easy to use” (F(2,76)=6.46, p=.003). These differences were found for “Overelaborated – Minimalist” between IMG – N-IVE (p=.038), between IMG – AR and N-IVE – AR for “Classic - Modern” (pIMG – AR<.001, pN-IVE – AR=.001), and between IMG – N-IVE and IMG – AR for “Unappealing – Appealing”(pIMG – N-IVE=.018, pIMG – AR=.001) and “Difficult to use – Easy to use” (pIMG – N-IVE=.008, pIMG – AR=.045).
Our analysis showed that the overall evaluation of the physical pro- duct was affected by the visual medium used to present it: Moka Pot (F(2,76)=49.35, p<.001), Nespresso Inissia (F(2,76)=21.38, p<.001), Nespresso Essenza (F(2,76)=29.13, p<.001). The level of confidence in the response was also affected by the medium for all the coffee makers: Moka Pot (F(2,76)=22.50, p<.001), Nespresso Inissia (F(2,76)=18.47, p<.001), Nespresso Essenza (F(2,76)=19.04, p<.001). Finally, the purchase decision was also affected by the change of media: Moka Pot (χ2(2) = 32.00, p<.001), Nespresso Inissia (χ2(2) = 8.00, p<.018), Nespresso Essenza (χ2(2) = 9.00, p<.011).
DISCUSSION
In H1, we postulated that the visual presentation media can influence the evaluation of a physical product, which was confirmed by our statistical analysis. Differences were found for “Classic - Modern” and “Appealing- Unappealing” for all three designs (see Figure 3). Although in related litera- ture, differences are usually found in Jordan’s physical-physiological pleasure category, in this study differences were identified in the sociological pleasure category (Galán et al., 2021). Additionally, all coffee makers tend to appear
Table 1. Descriptive statistics for the semantic scales.
Table available in the original PDF paper.
Scale Moka Pot Nespresso Inissia Nespresso Essenza IMG N-IVE AR IMG N-IVE AR IMG N-IVE AR
larger in N-IVE, which was expected as the size of the screen can affect the evaluation of the product. Nevertheless, they appeared more minimalistic in AR and more overloaded in IMG. This result could be explained by the higher level of detail shown in IMG compared to the other media. Finally, all the coffee pots were perceived as more modern in AR and less practical in N-IVE (see Table 1). Based on these results, we confirm our hypothesis H1.
Hypothesis H2 was postulated considering that AR provides the most information to the user and IMG the least. Some studies suggest that in order to make a purchase decision, consumers need access to as much product infor- mation as possible (O’Keefe & McEachern, 1998). Therefore, our data set could be affected by the change of medium. While 2D media provides enough information to evaluate a product, 3D representations offer more informa- tion to the user (Ant Ozok & Komlodi, 2009), allowing them to observe its appearance and features more directly (Liu, 2017). Cochran’s Q test found differences between media for this dataset and the purchase decision obtai- ned higher mean scores in AR for all coffee makers. AR was the medium in which the user showed most confidence in the response, which could have had a positive influence on the purchase decision. The lowest scores were obtained for IMG, except for the Moka Pot, which obtained the lowest scores in N-IVE. The low levels of confidence in the response in IMG may explain this result. Some authors have stated that the presentation medium may not be the only factor that influences product evaluation (Perez Mata et al., 2017). Product geometry may also be a significant contributing factor in the overall product perception. Based on our results, we confirmed our second hypothesis H2.
CONCLUSION
Today, sophisticated visual modalities coexist with more traditional media. To ensure the success of a product, it is important to understand the perceptual differences that may occur when it is presented to consumers in
The Influence of the Visualization Modality on Consumer Perception: A Case Study 165
a particular medium. In the case of coffee makers, the aesthetic attributes are the most affected by the change of medium. AR scored the highest in almost all the categories we tested, including the overall evaluation of the product, purchase decision, and the user’s level of confidence in the response. In addition, the products were perceived as larger in N-IVE, more minimalist in AR, more overloaded in IMG, more modern in AR, and less practical in N-IVE.
We acknowledge the limitations of our study, such as the limited experi- ence of some participants with AR technologies as well as the analysis of a single product typology. Although we believe our study can be extrapolated to similar products of the same typology, additional tests with other types of products are recommended to draw more generalizable conclusions. Our results are relevant for designers as well as professionals at the point of sale, and they shed light onto the importance of conducting this type of perceptual studies prior to product launches to ensure success.
ACKNOWLEDGEMENT: This research work has been supported by the Spanish Ministry of Education and Vocational Training under a FPU fellowship (FPU19/03878).
REFERENCES Agost, M.-J., Vergara, M., & Bayarri, V. (2021). The Use of New Presentation Technologies in Electronic Sales Environments and Their Influence on Product Perception. In S. Yamamoto & H. Mori (Eds.), Human Interface and the Mana- gement of Information. Information Presentation and Visualization (pp. 3–15). Springer Cham. https://doi.org/10.1007/978-3-030-78321-1 Agost, M. J. (2020). Analysis of perceptions according to the technique of product
display. comparative among 360o rotation, virtual and augmented reality. 24th International Congress on Project Management and Engineering. Ant Ozok, A., & Komlodi, A. (2009). Better in 3D? an empirical investigation of user satisfaction and preferences concerning two-dimensional and three-dimensional product representations in business-to-consumer e-commerce. International Jour- nal of Human-Computer Interaction, 25(4), 243–281. https://doi.org/10.1080/ 10447310802546724 Artacho-Ramírez, M. A., Diego-Mas, J. A., & Alcaide-Marzal, J. (2008). Influence
of the mode of graphical representation on the perception of product aesthetic and emotional features: An exploratory study. International Journal of Industrial Ergonomics, 38(11–12), 942–952. https://doi.org/10.1016/j.ergon.2008.02.020 Chu, C. H., & Kao, E. T. (2020). A comparative study of design evaluation with virtual prototypes versus a physical product. Applied Sciences (Switzerland), 10(14). https://doi.org/10.3390/app10144723 Felip, F., Galán, J., García-García, C., & Mulet, E. (2019). Influence of presentation
means on industrial product evaluations with potential users: a first study by com- paring tangible virtual reality and presenting a product in a real setting. Virtual Reality, 24(3), 439–451. https://doi.org/10.1007/s10055-019-00406-9 Galán, J., García-García, C., Felip, F., & Contero, M. (2021). Does a presentation Media Influence the Evaluation of Consumer Products? A Comparative Study to Evaluate Virtual Reality, Virtual Reality with Passive Haptics and a Real Setting. International Journal of Interactive Multimedia and Artificial Intelligence, 6(6), 196. https://doi.org/10.9781/ijimai.2021.01.001 Higgins, J. J., Blair, R. C., & Tashtoush, S. (1990). The Aligned Rank Transform Pro-
cedure. Conference on Applied Statistics in Agriculture. https://doi.org/10.4148/ 2475-7772.1443
Jiang, Z., & Benbasat, I. (2007). Investigating the influence of the functional mechanisms of online product presentations. Information Systems Research, 18(4), 454–470. https://doi.org/10.1287/isre.1070.0124 Jordan, P. W. (2002). Designing pleasurable products: An introduction to the new
human factors. CRC press. Kim, S., Baek, T. H., & Yoon, S. (2020). The effect of 360-degree rotatable product images on purchase intention. Journal of Retailing and Consumer Services, 55(September 2019), 102062. https://doi.org/10.1016/j.jretconser.2020.102062 Liu, S. (2017). The Effect of On-line Product Presentation : A Comparative Study
between 3D and General Product Presentation. Journal of Industrial Distribution & Business, 8(5), 15–21. https://doi.org/10.13106/ijidb.2017.vol8.no5.15 O’Keefe, R. M., & McEachern, T. (1998). Web-based Customer Decision Support Systems. Communications of the ACM, 41(3), 71–78. https://doi.org/10.1145/ 272287.272300 Osgood, C. E., Suci, G. J., & Tannenbaum, P. H. (1957). The measurement of the
meaning. Champaign, IL: University of Illinois press. Perez Mata, M., Ahmed-Kristensen, S., Brockhoff, P. B., & Yanagisawa, H. (2017).
Investigating the influence of product perception and geometric features. Resea- rch in Engineering Design, 28(3), 357–379. https://doi.org/10.1007/s00163-016- 0244-1 Samantak, R., & Mi, C. Y. (2017). Employing design representations for userfeedback in the product design lifecycle. 21st International Con- ference on Engineering Design, ICED 2017, 4(DS87-4), 563–572. https://www.scopus.com/inward/record.uri?eid=2-s2.0-85029741860&part nerID=40&md5=5906c0959bf5c5e07aac5679cd1ee29f Söderman, M. (2005). Virtual reality in product evaluations with potential customers: An exploratory study comparing virtual reality with conventional product representations. Journal of Engineering Design, 16(3), 311–328. https://doi.org/ 10.1080/09544820500128967 Verhagen, T., Vonkeman, C., & Van Dolen, W. (2016). Making Online Products
More Tangible: The Effect of Product Presentation Formats on Product Eva- luations. Cyberpsychology, Behavior, and Social Networking, 19(7), 460–464. https://doi.org/10.1089/cyber.2015.0520 Wang, Y., Jia, F., Schoenherr, T., Gong, Y., & Chen, L. (2020). Cross-border ecommerce firms as supply chain integrators: The management of three flows. Industrial Marketing Management, 89, 72–88. https://doi.org/10.1016/j.indmar man.2019.09.004
LISTED IN THE AHFE DIGITAL BOOKSTORE CATALOGUE
Explore the complete digital volume
Human Factors in Communication of Design
Read this individual research paper free through the original publisher, or explore the full digital proceedings book.
ISBN 978-1-958651-25-4
Explore this ISBN in the AHFE Bookstore ↗Listed in the July 2026 bookstore catalogue; search by ISBN to confirm current availability · Digital book purchase optional