Anna Firsova, Tao Xi (2022). Communication of sustainability through the wine label design: an experimental study. In: Human Factors in Communication of Design. AHFE Open Access, vol. 49, pp. 8–17. https://doi.org/10.54941/ahfe1002030
The wine culture itself is a very old and complex system that includes nature, territory, culture, tradition and human factor. The main mean of communication between the wine consumer and the producer himself is the wine label. It was in the 17th Century that, for the first time, a wine producer called decided to specify the origin of his wine on the bottle. Nevertheless, the wine label became a fundamental element of wine only in the end of 19th century during the industrial revolution, when a real consumes market was born.Nowadays we must take into consideration the fact that different countries produce wine for different markets, bringing different symbology and cultural meaning to their labels. After underlining how the wine packaging can convey cultural and symbolical meanings, it is then easy to agree that it is also possible to communicate the importance of ecological sustainability through a bottle of wine. Some elements of the packaging may explicitly refer to ecological sustainability, such as the BIO (biological) certificates that a cellar can obtain by respecting some specific standards. In this case the producer will apply this mark to the bottle in order to assure the consumer on the sustainability of the wine he is about to drink.In other cases, the communication of ecological sustainability can be more subtle and can be found in different components of the bottle: the cork, the label, the glass itself. The materials choice is in fact extremely important, because it can communicate a lot about the producer’s point of view.Nevertheless, what most probably will catch the eye of the consumer is the label. The label is like a white canvass and there the producer has the chance to convey all of his credo in ways that can be more or less explicit. The symbology plays a fundamental role in the labels’ design, and many are the already established visual codes which are used.Eco-labels are meant to minimise the information gap that might exist between the producers of eco-products and the consumers. This can be pursued by providing information about a product's environmentally responsible attributes.Generally, attributes such as social and environmental performance are aspects of a product that consumers can hardly identify. An important help often come from eco-labels, which can induce informed purchasing choices by environmentally responsible consumers.The purpose of this study is to investigate how the wine packaging design can be improved in order to enhance the ecological message and to increasingly involve the final consumer.The main objective of this research is to examine the role of wine packaging in making sustainable choices and investigate what is the impact of using sustainable materials in the wine packaging. In particular, within the framework of this research, it will be interesting to investigate if the label design, and sustainability-related elements on it, can have a major influence on the consumer’s choice making.The target group of the experiment is represented by wine shops and supermarkets customers of legal drinking age (21+). The participants declared to buy wine one or more times in a week.An on-line questionnaire was designed in order to explore the perception of consumers toward awareness of sustainability. The second phase of the experiment is to understand the consumers’ wine choices applying a Discrete Choice Experiment (DCE). DCEs allow researchers to catch consumers’ stated preferences from hypothetical choice situations using a combination of product attributes. In order to choose the attributes for the discrete choice experiment, a qualitative analysis was conducted together with the focus groups. Analysing the outcomes, it was possible to point out 5 main attributes. The economical aspect plays an important role when purchasing a wine bottle, for this reason, at least 2 bottles from the same group classification but belonging to different price ranges should be used in the experiment. For the experiment a total amount of 10 bottles is used on the DCE and then analysed.This experiment helps to understand and analyse the critical elements that condition the choice making process and understand how to educate wine consumers to sustainability, simply through the label design.Many actions can be taken, starting from the information that a label provides and the tools that should be used in order to more efficiently convey the message to the final consumer.
The wine culture itself is a very old and complex system that includes nature, territory, culture, tradition and human factor. The main mean of communication between the wine consumer and the producer himself is the wine label.
Nowadays we must take into consideration the fact that different coun- tries produce wine for different markets, bringing different symbology and cultural meaning to their labels. After underlining how the wine packaging can convey cultural and symbolical meanings, it is then easy to agree that it is also possible to communicate the importance of ecological sustainability through a bottle of wine. Nevertheless, what most probably will catch the eye of the consumer is the label. The label is like a white canvass and there the producer has the chance to convey all of his credo in ways that can be more or less explicit. The symbology plays a fundamental role in the labels’ design, and many are the already established visual codes which are used.
Eco-labels are meant to minimise the information gap that might exist between the producers of eco-products and the consumers. This can be pur- sued by providing information about a product’s environmentally responsible attributes. Generally, attributes such as social and environmental performa- nce are aspects of a product that consumers can hardly identify. An important
Communication of Sustainability Through the Wine Label Design 9
Figure 1: Attribute selection.
Figure available in the original PDF paper.
help often come from designers and eco-labels, which can induce informed purchasing choices by environmentally responsible consumers.
METHODS
Method and Experiment Framework The main research method consists of a discrete choice experiment. Attributes of the wine labels needed to be identified prior the beginning of the choice experiment. In order to identify these attributes a focus group was created and a qualitative analysis was conducted. The framework of the attribute selection is demonstrated on the Figure 1.
The chosen attributes identified as follow: eco-certification mark (A1) , any specific /additional information on the label (A2.1), text message about sustainable production (A2.2), specific design referred to nature (A3), spe- cial graphic elements (foil, braille, etc) (A4), famous producer (A5). These attributes will be next used in the following Desecrate choice experiment as the main criteria to evaluate the most efficient communication of sustai- nability. The attributes will be mixed to create a combinations of elements of design as well as labels single elements. The identified attributes were therefore used to conduct the experiment through an online survey system (www.surveysparrow.com): consumers were shown images of different wine bottle labels and asked some questions, including to choose between 2 or more of these labels.
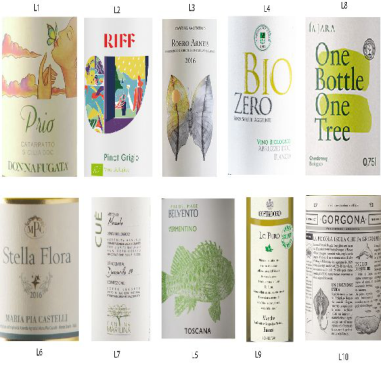
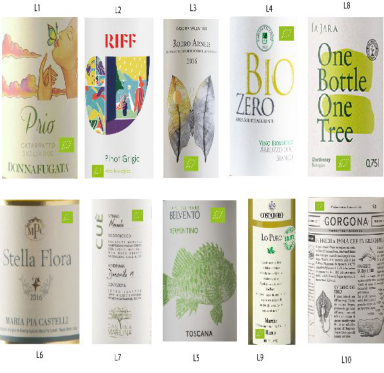
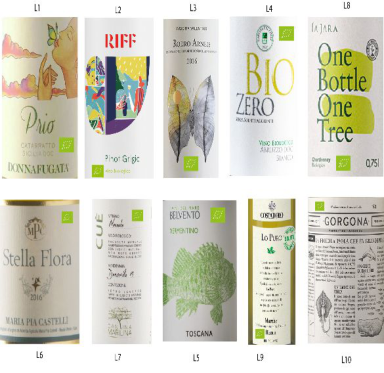
In the experiment 2 separate groups were created: Group A and Group B. A total of 10 labels were chosen and given to the previously recruited partici- pants. While the 10 labels were the same for both groups, the European Bio Certificate (Figure 4) was applied to all of the labels of group B. Each experi- ment participant completed seven online discrete choice tasks and answered an online survey. See Figure 2 and Figure 3. In each choice task, the respon- dent was asked to imagine that he or she was attending a regular dinner with family or friends and needed to choose a bottle of wine to bring along for the occasion that is not particularly special.
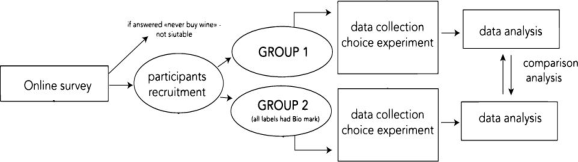
The price of each bottle of wine was not exactly specified. The survey’s questions followed the discrete choice exercise, so as to not bias the discrete choice responses. As survey questions were focused on the existing behavi- ours rather than attitudes, we feel it unlikely that participation in the discrete choice exercise caused bias in our survey results. Full experiment framework is demonstrated on Figure 5.
Pre - Experimental On-line Survey An on-line questionnaire was designed in order to explore the perception of consumers toward awareness of sustainability. The questionnaire is based on
10 Firsova and Tao
Figure 2: Labels.Figure 3: Labels+Bio-certification mark.Figure 4: Biological certification mark in Europe.
previous research in sustainable wine labelling (Giovanni Sogaria. 2016) and includes four blocks: The first block of the survey focusses on wine consum- ption and purchase habits. It will help to understand the overall consumer’s knowledge and concerns about sustainability. The second block includes 6 items to measure variables such as beliefs towards sustainable-labelled wine. This block is necessary in order to understand the actual involvement of the participants in sustainability. The third block includes questions to under- stand the participants’ awareness towards environmental issues. Finally, the
Communication of Sustainability Through the Wine Label Design 11
Figure 5: Experiment framework.
last general block is needed to provide the demographic and socio-economic characteristics of the participants.
Participants over 18 years old (the legal age for drinking wine in Italy) were recruited using social network platforms such as Facebook. A total of 42 participants took the survey. Assessing the frequency of purchasing wine among the participants was fundamental, as subjects who declared to never purchase wine were precluded from continuing the experiment.
For the evaluation of the answers given by the participants only the valid percent was considered. In order to classify the answers that were given, a Likert scale was used, where the minimum score 1,00 corresponded to the answer ≪Strongly disagree≫and the maximum score 5,00 corresponded to the answer ≪Strongly disagree≫. When asked about their level of awareness of the environmental issues, among all of the participants (71%) showed that they are fully aware of the environmental issues, 18.4% answered to be aware of these issues, while 5.3% were not aware and 5.3 % showed an even lower awareness level.
In order to get a deeper analysis of the thoughts of the participants on the environmental matter, they were asked to express their opinion about the impact of sustainable products on the protection of the environment. Also in this case, to answer the question ≪Purchasing sustainable products does not really do much to help the environment≫a reverse Likert scale was used. 30.8% of the participants strongly disagreed with this statement, 23.1% disa- greed, 17.9% answered neutrally, while 10.3% agreed and 17.9% strongly agreed. Overall, analysing the first block of questions which let us understand the participants’ awareness level and behaviour toward sustainable choices, a Descriptive Statistics Analysis was ran with the SPSS software.
The resulting Mean value of most questions belonging to the first block is above 4.1, showcasing a general sensibility of the environmental issues and, in general, their willingness to change their behaviour see Table 1.
Nevertheless, it is noticeable that the participants do not believe very much that purchasing sustainable products can do much to help to protect the envi- ronment. The third block of questions mainly refers to the perception of sustainability that the interviewed participants have about wine labels. 25% of the participants strongly agreed with the affirmation that if it is a sustai- nable wine it must have a Bio mark on the label, 19.44% agreed, 11.11% answered neutrally, while 22.22% disagreed and 22.22% strongly disagreed. As the result we can see that 44.4% of all the participants do not consider a Bio-certification as a must for a sustainable wine.
Descriptive Statistics N Minimum Maximum Mean Std. Deviation
36 1.00 5.00 3.0278 1.53969
If it is a sustainable wine it must have a sign Bio on the label
38 1.00 5.00 2.7105 1.43146
Sustainable wine labelling certification is a guarantee of high product quality
37 1.00 5.00 3.0811 1.53439
Sustainable wine labelling certification is a guarantee of the origin of raw materials
38 1.00 5.00 3.1842 1.62506
Sustainable wine must have eco-certification mark
38 1.00 5.00 4.2368 1.12548
I could be interested in buying a bottle of wine with a sustainable label (showing environmental economic and social aspects)
39 1.00 5.00 3.1795 1.41183
Sustainable wine labelling certification is a tool of marketing and has no big value Valid N (listwise) 34
The participants where then asked to express their agreement with the affirmation that sustainable wine labelling certifications are a guarantee of high quality products. In this case 26.32% of them strongly disagreed, 23.68% disagreed, 18.42% answered neutrally, while 15.79% agreed and 15.79% strongly agreed see. Summarising the data we see 49.8% of disagre- ement and 30.15% of agreement decisions. The logic of answers is similar
Communication of Sustainability Through the Wine Label Design 13
to the previous question. The majority of the participants do not consider Bio-certificated products as necessarily a good quality product see Table 2.
Running the descriptive statistics analysis we can compare and analyse full data. Mean demonstrates the level of agreements with the statements tow- ards sustainability and eco-certifications. Following the analyses we see that most participants are aware of environmental issues and are environmentally oriented, therefore the trust in sustainable certification marks is relatively low. Although higher amount of participants is ready to buy a bottle with sustainable label that shows environmental, economics or social aspects. This demonstrates that the if the label will display any of this aspects will be more attractive. The following experiment will show an interesting outcome of this observation.
MAIN EXPERIMENT AND DATA COLLECTION The total number of 40 participants was randomly divided into two equal groups of 20 participants. Both groups were asked to complete a short survey online. The total amount of questions asked is 9. All of the questions of the survey were designed in order to create a possibility to make a choice between two or more options. In this stage of the experiment only images comparison is used. The questions follow below.
Q1 The participant was asked to choose only one label among the 10 provided. The goal of this question was to immediately identify the most eye- catching label, without specifically referring to sustainability. The outcomes of the first questions are demonstrated on the Tables 3 and Table 4. Condu- cting the frequency analyses we can see interesting difference between two groups. While Group 1 * Original labels* had no evident favourite among the labels (the most attractive labels are L6, L3, L4, L8 with an average 20% for each respond), Group 2, choosing between all the labels with added Bio- certification mark (see Fig.3), more frequently would buy the Label 3, with a probability of 25%.
Q2 In question 2, the participant was asked to choose between Label 1 and Label 7. While Label 1’s producer is a well structured winery, renow- ned for producing large quantities of Bio wine, Label 7’s winery is a smaller one. It is interesting to notice that on Label 1 there are no explicit messages about sustainability, while on Label 7 several information regarding both the packaging and the wine are reported.
Q3 Question 3, like Question 2, refers to Label 1 and Label 7. The aim of this question is to understand which producer, according to the participant, is the most involved in sustainable matters.
Q4 In question 4, the participant was asked to choose between Label 8 and Label 4. Both labels present strong links to sustainability. Therefore, the goal of this question was to find out which of the two labels was more likely to be chosen as trustworthy.
Q5 In question 5, the participant was asked to choose between Label 3 and Label 9. Label 3’s design presents natural graphic elements without explicitly referring to sustainability. On the other hand, Label 9 includes many verbal
information about sustainable practices. The goal of this question was to understand which kind of elements would gain the participant’s trust.
Q6 In question 6, the participant was asked to choose between Label 10 and Label 6. None label links directly to sustainability, while Label 10 pre- sents illustrations of animals and information about the flora and fauna of the producing area. The goal of this question was to understand which kind of elements would gain the participant’s trust.
Q7 Question 7, refers to Label 10 and Label 6. The goal of this question is to understand which producer, according to the participant, is the most involved in sustainable matters.
Q8 The participants were asked to choose only the one label, among the 10 available, that better expresses an involvement in sustainability. At this point of the questionary, the participants already got familiar with most part of the labels and therefore, they could make a more rational choice. See Tables 5 and 6.
Q9 The participant is asked to choose only the one label, among the 10 available, whose link to sustainability is the least evident. At this point of the questionary, the participant already got familiar with most part of the labels and therefore, he/she could make a more rational choice. See Tables 7 and 8.
Communication of Sustainability Through the Wine Label Design 15
Table 5. Q8 More effective sustainability communication. Original labels. Group 1.
After analysing the received responses we reach the conclusion that the label which better communicates sustainability is the label with a clear text mes- sage. In this experiment, we can notice that the absolute majority of the responders in both groups has chosen the label 8 as the label that better com- municates sustainability. This choice was made by 35% of responders in the first group and 50% of responders in the second group (see the Tables 3 and 4). Although the label 8 was chosen as the best at communicating sustainabi- lity, yet, it is not the general preferred choice. In Question 1 the participants were asked to choose the wine label based on which they would purchase
16 Firsova and Tao
Table 8. Q9 Less effective sustainability communication. Group 2 (Bio mark).
wine. Only 20% of the group 1’s responders have chosen to buy the Label 8, and 20% of the participant in the group 2, which was the second choice after L3 with 25% of responses in group 2. According to the responses in both groups we can see that the Label 8 actually would be chosen at that same frequency level as the label 3. The difference between these two labels is that label 3 has a design that is apparently attractive, and label 8 brings the message about sustainability, even though the communication language is different from the mother language of the responders. All the responders are Italians while the message is in English (One bottle One tree). The important fact is that unattractive design with a lot of text may be associated with sustai- nability and may bring the message to the final consumer, but also might not be chosen to buy. As we can see Label 7 was not chosen by any participant in group 1 to buy a bottle, but at the same time it received 25% of responses about the label which communicates better sustainability. The risk of such label with a lot of information is to be misunderstood and not be chosen in the end because the design is not enough attractive, as for instance the label 9. The absolute winner in non communicating the sustainable message is the label 6. This is a classical label with no signs of sustainable production, still would be bought by 20% of the responders in the group 1 and 5% in group 2. It is interesting to observe that by adding the BIO-certification on this classical label it was reduced the probability to be chosen.
CONCLUSION
This experiment has showed very interesting results on this stage of the rese- arch, however, the results are not enough to make a final statement regarding all elements with influence in choice making decision. Although, we can clearly notice that by adding eco-certification marks to all labels we could change the choice of participants.
Even though the green message can be made clearer through the designer’s work on the label, it is not certain that the consumer will decide to purch- ase the eco-friendly bottle. It should be kept in mind that the most efficient way to promote the ecological message and gain the consumers’ favour is to
Communication of Sustainability Through the Wine Label Design 17
design packagings that are both a clear expression of sustainability and are aesthetically appealing to them.
REFERENCES
Anderson, R. C., & Hansen, E. N. (2004). The impact of environmental certification on preferences for wood furniture: A conjoint analysis approach. Forest Products Journal, 54(3), 42–50. A. Annunziata, L. Agnoli, R. Vecchio, S. Charters, A. Mariani Health warnings
on wine labels: a discrete choice analysis of Italian and French Generation Y consumers Wine Economics and Policy (2019), 10.1016/j.wep.2019.03.001 A. Krishna, L. Cian, N.Z. Aydıno˘glu, Sensory aspects of package design Journal of Retailing, 93 (1) (2017). Banerjee, A., & Solomon, B. D. (2003). Eco-labeling for energy efficiency and
sustainability: A meta-evaluation of US programs. Energy Policy, 31, 109–123. Bruwer J., et al., Asia Pacific Journal of marketing and logistic, 2015, U.S. wine consumer preferences for bottle characteristics, back label extrinsic cues and wine composition: A conjoint analysis. G. Ares, B. Piqueras-Fiszman, P. Varela, R.M. Marco, A.M. Lopez, S. Fiszman Food
labels: Do consumers perceive what semiotics want to convey? Food Quality and Preference, 22 (7) (2011), pp. 689–698. Harbaugh, R., Maxwell, J., & Roussillon, B. (2011). Label confusion: The Groucho effect of uncertain standards. Management Science, 57, 1512–1527. Higgins L. M., et al., Wine economics and policy, 2014, Technological change in the
wine market? The role of QR codes and wine apps in consumer wine purchase. Katie Hockstein, Wine Consumption and Trends Among Millennials, source: New World Report https://www.thenewworldreport.com Leire, C., & Thidell, A. (2005). Product-related environmental information to guide
consumer purchases—A review and analysis of research on perceptions, under- standing and use among Nordic consumers. Journal of Cleaner Production, 13, 1061–1070. Libation Frontiers: A Deep Dive into the World Wine Industry, source: https://www.toptal.com/finance/market-sizing/wine-industry [20.10.2021] Mueller S., et al., Food quality and preference, 2010, Message on a bottle: the relative influence of wine back label information on wine choice. M. P. Gonzalez, S. Thorhsbury, and D. Twede, Packaging as a tool for product
development: Communicating value to consumers, Journal of Food Distribution Research, 38 (1), 61–66, 2007. Statistical reports, Wines and Vines, 2018 http://www.oiv.int/public/medias/6782/oiv- 2019-statistical-report-on-world-vitiviniculture.pdf [15.09.2021] Teisl, M., Roe, B., & Hicks, R. (2002). Can eco-labels tune a market? Evidence from
dolphin-safe labeling. Journal of Environmental Economics and Management, 43, 339–359.
LISTED IN THE AHFE DIGITAL BOOKSTORE CATALOGUE
Explore the complete digital volume
Human Factors in Communication of Design
Read this individual research paper free through the original publisher, or explore the full digital proceedings book.
ISBN 978-1-958651-25-4
Explore this ISBN in the AHFE Bookstore ↗Listed in the July 2026 bookstore catalogue; search by ISBN to confirm current availability · Digital book purchase optional