Bruno M. Razza, Luis Carlos Paschoarelli, Heliana M. Santos, Lauane O. Andrade (2022). The Multisensory Experience: A Case Study with Five Different Products. In: Advances in Ergonomics In Design, Usability & Special Populations: Part III. AHFE Open Access, vol. 20. https://doi.org/10.54941/ahfe1001307
The human perception arises from an inner sense intrinsically dependent on the sensitive channels. Vision is considered the dominating sense in humans, while hearing, touch, taste, smell, kinesthetic sense and balance are complementary in most cases, with numerous exceptions. Until now, most studies suggest that the greater the number of sensory modalities stimulated at the same time, the richer the experience will be. As a result, the increase in the number of sensory modalities presented in a virtual environment can help people feel immersed and also help to improve the memory of existing objects in the virtual environment (Schifferstein and Spenser, 2008). This study aimed to evaluate the influence of multisensory integration in the user experience with different categories of products. Participants were 60 volunteer subjects of both genders and all users of these products; they evaluated 25 different products in three levels of multisensory integration: vision, vision+touch and multisensory. Results indicated that intrinsic characteristics of each product were responsible for the emergence of differences between multisensory phases, and the relationship between usability and visual aesthetics were less evident in the process. More specific studies are necessary to recognize more accurately the relationship between product characteristics and user perception.
The sensitive input has been traditionally studied separately due mainly to anatomic differences of the sensory organs and the way the sensory information is processed. However, these senses are highly integrated in the brain in order to provide a more complete perception of our surroundings, in a phenomenon called multisensory integration (Wallace, 2004; Schütte, 2005, Fenko, 2010, Vergara, 2011).
Vision is considered the primary sense in humans, while auditory, tactile, gustative, olfactory, balance and kinesthetic are complementary in most cases (Schütte, 2002 and 2005). In general, the first contact with a product is visually; depending on the interest of the user, he/she may intensify the experience with the product broadening his/her sensorial perception by touching, hearing, smelling, manipulating or even tasting the product (Picard, 1997; Schütte, 2008). Recent studies have investigated the importance of other sensory modalities in the use of products (Schifferstein and Cleiren, 2005; Schifferstein and Desmet, 2007), such as the tactile influence on consumption (Spence and Gallace, 2011; McCabe and Nowlis, 2003) decision and preferences (Peck and Childers, 2003), and the impact of the touch and kinesthetic sense on product usage (Fogtmann et al., 2008). Schifferstein and Spenser (2008) address the important role of the sensory senses in user experiences with products, stating that the experience will be based on the total perception of all the senses available, and it can happen conscious or unconsciously. Spence and Gallace (2011) alert to the fact that multisensory integration have a great impact on sales and one bigger challenge to companies is to manage online commerce of particular products such as clothes, for example, due to lack of interactions with other senses. McCable and Nowlis (2003) have shown that for some portable electronics such as mp3 players, smartphones, tables, etc. touching is also a very important sense in buying decisions. We reinforce this argument citing Syzbillo and Jacoby (1974) affirmation that the intrinsic qualities of the products such as color, shape, smell or texture can be more important in determining the quality of the product than extrinsic characteristics, such as price, brand, promotion or store image.
In many user experience studies products are usually evaluated using visual domain and then subjective records are obtained by means of the semantic differential (SD) test (Hsu et al., 2000; Chuang and Ma, 2001; Petiot and Yannou, 2004; Mondragón et al., 2005; Cheng and Chang, 2009). Some studies focus on certain elements of the visual stimuli like form (Chang and Wu, 2009), color (Hsiao et al., 2008), emotion (Schifferstein, 2006; Herz and Schooler, 2002) or fidelity of the prototype (Sauer and Sonderegger, 2009; Sauer et al., 2010), but they are exclusively based on visual domain to construct the semantic space with SD forms. Only in certain cases is the examination extended to other senses (Schütte and Eklund, 2005). Some studies compare different modalities of visual perception (Artacho-Ramírez et al., 2008; Sauer and Sonderegger, 2009), but few studies have included the sense of touch (Barnes et al., 2004; Choi and Jun, 2007; Wellings et al., 2008, 2010). Schifferstein and Cleiren (2005) and Schifferstein and Desmet (2007) investigated the isolation of senses in product usage and brought some light in comprehending the contribution of each sense to the total perception. Nagamachi (2002), in a article about implication of the Kansei Engineering (roughly described as an ergonomic method for manipulating emotional attributes of the products), points out that in studies regarding human perception is important to include all senses and the importance of each sense will depend on the context of use. Studies in this field indicate that the omission of sight is responsible for the greater degree of information loss in the interaction with the product, since it is the predominant channel (Schifferstein and Cleiren, 2005; Schifferstein and Desmet, 2007). It was also proven that touch and kinesthetic sense gain greater importance as interaction time increases and can be leveled in importance with vision (Fenko et al., 2010). It is presumed that this sensorial perception is dependent on the user experience with the product and its functional and aesthetic characteristics critically influence this relationship.
Recently, Vergara et al. (2011) investigated the influence of multisensory integration with hammers and proved that at least for this product the multisensory integration alters significantly some aspects of product perception. Campos et al. (2012) investigated the same aspect with pruning shears and concluded that the variables related to the usage were more affected by the lack of senses than other attributes of these products. The results of these two studies stress the influence of multisensory integration on the perception of products. However, both studies used hand tools as object and it is known that this category of product leads to determined type of interaction. Moreover, the characteristics and attributes of hand tools are task oriented and have specific design goals. Thus, this study had as a goal to analyze the influence of multisensory integration in products commonly used in daily activities.
MATERIAL AND METHODS User sample
The participants were 60 volunteer subjects of both genders. Their age ranged from 18 to 54 years and they were all users of the products. The subjects were divided into groups of 12 individuals who assessed 5 products in one category.
Product sample Twenty-five products commonly found in domestic or work places were evaluated, namely 5 coffeemakers, 5 screw- drivers, 5 vegetable peelers, 5 staplers and 5 paper punches. Images of these products can be seen in Table 1.
Table 1. Product sample.
Table available in the original PDF paper.
Coffeemakers
Screw-drivers
Vegetable peelers
Staplers
Paper punches
Procedure Individual perception was collected using the Semantic Differential in an 11-point Likert scale, considering symbolic and usability aspects. The evaluation of the products was divided into three levels of multisensory integration. In the first level, the subjects evaluated the products through high resolution photographs (visual sense). In the second level users were asked to touch and manipulate the products, without really use them and then the evaluation was performed (visual and touch senses). For the third level the subjects were asked to perform predetermined tasks with each product and again their perception were recorded (multisensory). The trials were spaced in days to avoid remembering previous answers.
The results were analyzed with Factorial Analysis in order to extract the main factors that represent the semantic space of these products. The levels of multisensory integration were treated as dependent variables and analyzed with Wilcoxon’s test. All analysis were performed with StatSoft Statistica R7.
RESULTS AND DISCUSSION
Factor Analysis (FA) with Varimax rotation was used to verify the semantic behavior of the variables in each product. The eigenvalue of 1.0 was used for all analysis. Tables 1 to 5 show the results of FA for the five products of the sample. The higher correlations values (above 0.7) were highlighted in bold and the medium correlation values (above 0.5) were underlined. The table shows the percentage of total variance and the percentage contribution of each factor for the total variance. In right side, is presented a box with a summary of the factors grouping.
Table 1 presents the results of the factor analysis for the coffeemakers. Three factors were encountered representing 69.69% of total variance. According to Laros (2005), variance above 60% is indicative of a good quality of the factors obtained. They were named 1) general quality; 2) easiness of use; and 3) heaviness and cleanliness.
Table 1. Factor analysis for coffeemakers.
Table available in the original PDF paper.
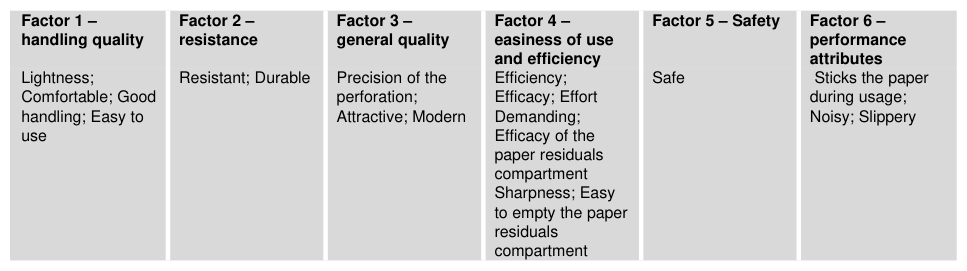
Variables Factor 1 Factor 2 Factor 3 Good appearance 0.771081 0.374233 0.105320 Factor 1 – General quality Efficient 0.749538 0.339227 0.005935 Good appearance; Efficient; Good quality; Resistant; Safe; Easy to remove the powder compartment; Easy to remove the jar
Good quality 0.873843 0.186789 0.137986 Heavy 0.022539 -0.024748 0.859167 Resistant 0.843956 -0.025854 0.205317 Safe 0.869367 0.105708 0.106333 Easy to clean the powder compartment 0.552337 0.234194 0.506234 Factor 2 – Easiness of use Easy to clean the jar 0.315457 0.269232 0.666302 Easy to use; Quick preparation of the coffee; Easy to clean the body of the product; Easy to dose water/powder Easy to clean the body of the product 0.439286 0.618427 0.323370 Easy to dose water/powder 0.214442 0.677481 0.199230 Easy to remove the powder compartment 0.621050 0.270884 0.492480 Easy to remove the jar 0.558799 0.460107 0.111797 Factor 3 – Heaviness and cleanliness Easy to use 0.410698 0.725425 0.029413 Heavy; Easy to clean the jar; Easy to clean the powder compartment; Quick preparation of the coffee -0.053580 0.758359 0.011704 % of total variance 50.81567 11.44167 7.43262 Total variance 69.69%
Table 2 presents the results of the FA for the screwdrivers. Three factors were obtained representing 69.82% of total variance and they were denominated as: 1) Performance quality; 2) Handling aspects; and 3) Texture. Factor 1 grouped most of the variables which means that they were all correlated. The variable avoid electricity was not correlated with any factor.
Table 2. Factor analysis for screwdrivers.
Table available in the original PDF paper.
Variables Factor 1 Factor 2 Factor 3 Slippery -0.083456 0.716625 0.195880 Factor 1 – Performance quality Good texture 0.101975 0.147067 0.715924 Good finishing; Resistance of the tip; Professional appearance; Good quality; Resistance to break; Good size; Comfortable; Modern; Good appearance; Good fitting with the screw.
Good finishing 0.675110 0.249720 0.293075 Resistance of the tip 0.880487 0.210733 0.057598 Professional appearance 0.874813 0.181484 0.144000 Lightness 0.342647 0.724955 -0.063919 Good quality 0.845411 0.110035 0.246443 Resistance to break 0.765881 0.315760 0.144292 Factor 2 – Handling aspects Good size 0.810544 0.176629 0.307647 Slippery; Lightness; Comfortable 0.855840 0.019468 0.232060 Modern 0.897222 0.066081 0.219449 Avoid electricity 0.429681 -0.161644 0.419178 Factor 3 – Texture Good appearance 0.849971 0.037902 0.209025 Good texture Good fitting with the screw 0.820659 -0.148279 0.126490 % of total variance 53.27675 9.05964 7.47808 Total variance 69.82%
Table 3 presents the FA results for vegetable peelers. Four factors were identified representing 65.75% of total variance. They were named as: 1) Comfort and easiness; 2) Visual quality; 3) Fragility and cleanliness; and 4) Performance. Some variables were not even moderately correlated to any factor and were not used in further analysis, as follows: durable; resistant; and safe.
Table 4 presents the FA results for staplers. Six factors were encountered representing 77.76% of the total variance. The factors were named as: 1) Safety; 2) Visual quality; 3) Easiness of use; 4) Performance; 5) Corrosion resistance; 6) Structure.
Variables Factor 1 Factor 2 Factor 3 Factor 4 Factor 5 Factor 6 Heavy 0.258274 0.136360 0.496307 0.019086 0.074905 0.659371 Robust 0.422709 0.282356 0.150792 0.130919 0.057254 0.667193 Good structure -0.030059 -0.130030 0.783908 -0.066405 0.320127 0.116961 Durable 0.002358 0.416013 -0.190941 0.046548 -0.157739 -0.647860 Resistant to corrosion -0.518338 0.230798 0.014296 0.024874 -0.600195 -0.404273 Avoid the staple to stick 0.438280 0.060702 0.403773 -0.008395 0.640901 -0.007008 Easy to switch the stapling type 0.374272 -0.134921 0.603266 0.307863 -0.290235 0.387127 Easy to use 0.139834 0.005117 0.879838 0.052874 -0.007465 0.098242 Easy to refill 0.814493 0.018118 -0.093946 0.248649 0.225910 0.047287 Safe to use 0.900536 -0.021242 0.132118 -0.031491 -0.041172 0.086791 Safe to refill 0.925179 -0.014506 0.134411 -0.128071 0.060653 0.103049 Safe to switch the stapling type 0.725924 0.122796 0.169229 0.148938 0.231208 0.242834 Stable 0.022263 -0.182327 -0.007494 0.909504 -0.053208 0.055993 Comfortable -0.027348 0.794823 -0.154892 -0.172195 0.177579 0.075961 Modern -0.048338 0.860065 -0.111479 0.049435 0.000262 0.017490 Finishing 0.105175 0.392282 0.041226 0.632375 0.510274 0.075862 Good appearance 0.132992 0.682484 0.347333 -0.203213 -0.339665 -0.054631 Efficient -0.093792 -0.164712 0.301460 0.545188 -0.025563 -0.435524 % of total variance 32.62361 16.50881 9.32969 7.29037 9.32969 7.29037 Total variance 77.76% Factor 1 – Safety Factor 2 – Visual quality
Table 5 presents the FA results for paper punches. Six factors were identified representing 74.75% of the total variance. The factors were named as 1) handling quality; 2) resistance; 3) general quality; 4) easiness of use and efficiency; 5) safety and 6) performance attributes.
The semantic profile identified varies considerably with the type o product. Some factor grouped variables with distinctive meanings. For example, variables related to appearance or aesthetics were correlated with performance aspects of the products, as for coffeemaker factor 1, screwdriver factor 1 and paper punches factor 3. For vegetable peelers, appearance attributes were isolated in one factor which indicates that the user noticed the aesthetic of the peeler as independent of performance or easiness attributes.
Another approach was to observe the influence of multisensory integration on the perception of the products. The Wilcoxon’s test (P ≤ 0.05) was applied in the comparison of the levels. In order to facilitate the presentation of the results due to the size of the sample, only the percentage of statistically significant differences found in the comparison of levels are shown.
On average, the multisensory integration causes changes in 35.4% of the scores of product evaluations. The results of this analysis are shown in Tables 6 to 10. In these tables, it is presented the percentage of significant changes that occurred by level comparison and in the right column (in grey) is presented the percentage of changes by product. For this latter measure was considered any change in the evaluation of the product independently on what level it was observed.
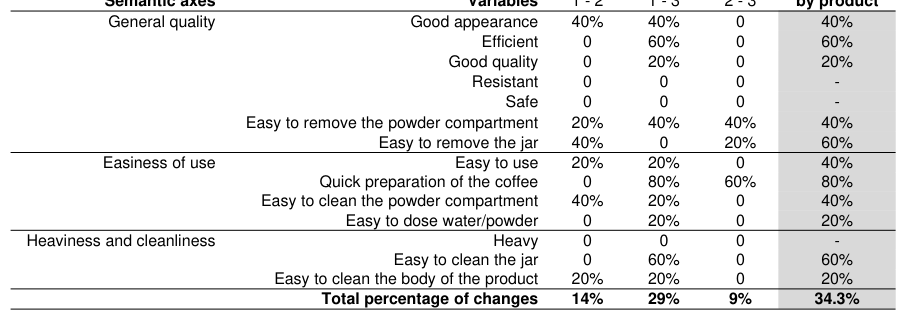
Table 6 presents the results for coffeemakers. Most of the changes occurred in the comparison of level 1 to level 3, that is, the visual evaluation in opposition to the post-use evaluation. The aspects of these products that have been more influenced by the multisensory integration were efficiency, easiness of use and easiness to open the jar. It is understandable that the users had to effectively use the product to have a more precise opinion about these mentioned aspects of the coffeemaker. However, other aspects that are also related to usage as ‘resistant, safe and heavy’ have not been influenced significantly by multisensory integration. The statistical tests due to sample size can only detect strong differences and then might have not been able to identify small changes (Cohen, 1992). Another possible answer is that users might have been able to predict these aspects only with the visual sense.
Table 6. Significant changes in variables scores due to multisensory integration on coffeemakers.
Percentage of changes by level comparison
Semantic axes Variables
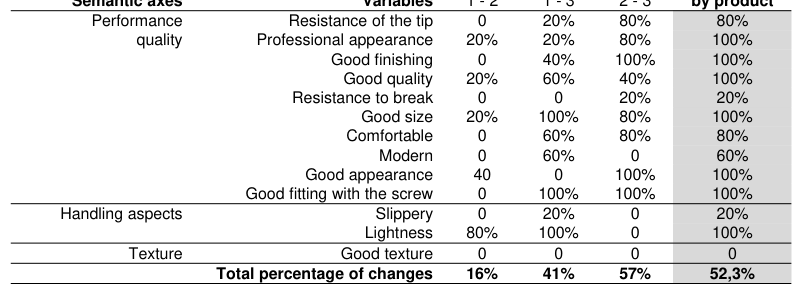
In Table 7 are presented the results of multisensory integration for screwdrivers. Of all products, the screwdriver scores have presented the bigger percentage of changes. For this product, the majority of changes were obtained in the comparison of level 2 to level 3, that is, the manipulation in opposition to post use evaluation. Since it is essentially a hand tool, it is presumable that the users had to actually use or at least manipulate the screwdrivers to evaluate it properly.
Table 7. Significant changes in variables scores due to multisensory integration on screwdrivers.
Percentage of changes by level comparison
Semantic axes Variables
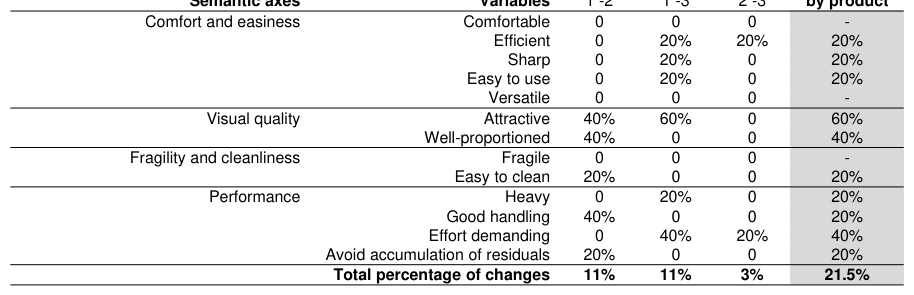
In Table 8 are presented the results of multisensory integration for vegetable peelers. These products showed the minor percentage of changes for all products. One possible explanation for this behavior is that all subjects recruited are users of this product and their previous experience might have lead to a better predictability of the variables. The semantic axe called Visual Quality, grouping the variables Attractive and well-proportioned, showed bigger changes with the multisensory integration than any other product attribute. It is an unexpected result since these aspects are traditionally related to the visual domain. One possible explanation is due to the contribution of other senses to compose the total perception of aesthetic, as stated by Grohmann et al. (2007). The authors studied the influence of tactile stimuli on consumer’s perception of textile products and concluded that when touched, products can be better evaluated if they present good finishing or can be considered much worse if the tactile sense is not pleased.
Table 8. Significant changes in variables scores due to multisensory integration on vegetable peelers.
Percentage of changes by level comparison Percentage of changes by product Semantic axes Variables 1 -2 1 -3 2 -3 Comfort and easiness Comfortable 0 0 0 - Efficient 0 20% 20% 20% Sharp 0 20% 0 20% Easy to use 0 20% 0 20% Versatile 0 0 0 - Visual quality Attractive 40% 60% 0 60% Well-proportioned 40% 0 0 40% Fragility and cleanliness Fragile 0 0 0 - Easy to clean 20% 0 0 20% Performance Heavy 0 20% 0 20% Good handling 40% 0 0 20% Effort demanding 0 40% 20% 40% Avoid accumulation of residuals 20% 0 0 20% Total percentage of changes 11% 11% 3% 21.5%
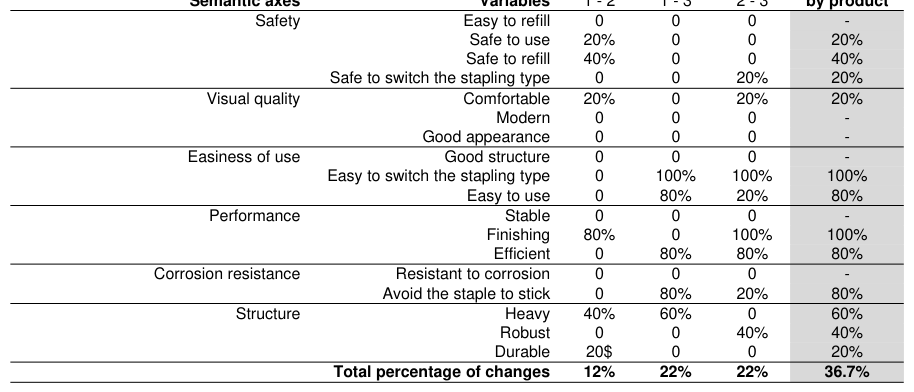
Performance related aspects of the staplers have been greatly affected by the increase in sensitive senses (Table 9). The comparison of levels 1 to 3 and 2 to 3 were equal, resulting in 22% of changes. In all products, the easiness to switch the stapling type differed with the increase in sense modalities, indicating that the design of the product cannot give clues to the user to predict the usability of this particular function. The same result was found to the attribute finishing, which is closely related to the sense of touch and thus is more difficult to be assessed only with the visual domain. In opposition, attributes related to safety and visual quality were less affected by multisensory integration.
Table 9. Significant changes in variables scores due to multisensory integration on staplers.
Percentage of changes by level comparison
Semantic axes Variables
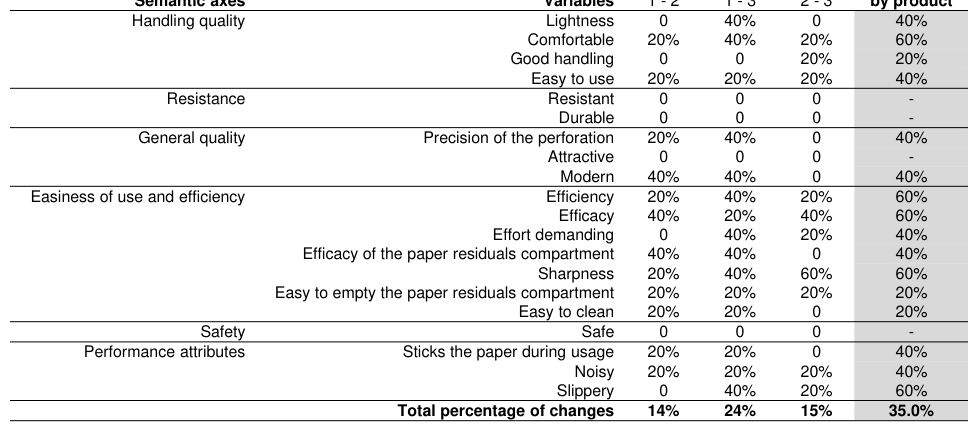
Thirty-five percent of the paper punches attributes investigated was affected by the multisensory integration (Table 10). Most of the significant differences occurred in the comparison of level 1 and level 3(visual to multisensory).
The semantic axe denominated Resistance did not show statistical differences between trials. Again, one possible explanation is that users might have predicted these variables with the visual sense. The same result can be observed for the attractiveness of the paper punches. Other performance related attributes have changes for at least one product at one level.
Table 10. Significant changes in variables scores due to multisensory integration on paper punches.
Percentage of changes by level comparison
Semantic axes Variables
In general, the augment of sensory modalities changes the user’s perception of 35.4% of the cases evaluated in this study. Most of the significant changes were obtained in the comparison of level 1 (visual) and level 3(multisensory), with one exception: the screwdriver. One possible explanation is that the cumulative changes were more significant in the comparison of level 1 to 3. Other comparison might have shown differences although this study was not able to identify.
It has been demonstrated that multisensory integration varies with the type of product. All products composing the sample of this studies presented high level of manual interaction with the user, demanding the use of at least the vision, touch and kinetics. Products with different levels of interaction such as television or table lamps can present different results.
CONCLUSIONS
Our results indicate that, in several ways, the multisensory integration affects the perception of the product and it counts for about one third misjudgment if only the visual channel is used. This is a very high percentage considering the amount of products sold every day in online stores or catalogues. Advances in augmented reality technology and interaction design are trying to create a more realistic shopping experience but still there is much to do in this field.
Another concern is the amount of studies in emotional design or user experience basing their results on online protocols to construct arguments concerning many aspects of user’s perception. One example is the Kansei Engineering, with recent studies investing on the development of algorithms to better construct the assumption upon which the method is based. Further studies need to investigate the influence of multisensory integration on the construction of the semantic space of the Kansei Engineering.
Other aspects related to the user’s perception were not considered in this study, such as user’s characteristics or extrinsic aspects of the product, such as brand or user’s preferences. However, it is not clear how these factors can be related to multisensory integration.
ACKNOWLEDGEMENTS
Special thanks to students of the Discipline Ergonomics in Design 3 (Design, UEM, 2011) for the assistance in collecting data.
REFERENCES
Artacho-Ramírez, M. A., Diego-Mas, J. A., Alcaide-Marzal, J., (2008). Influence of the mode of graphical representation on the perception of product aesthetic and emotional features: an exploratory study. International Journal of Industrial Ergonomics, 38 (11e12); 942-952. Barnes, C.J., Childs, T.H.C., Henson, B., Southee, C.H., (2004). Surface finish and touch: a case study in a new human factors
tribology. Wear, 257 (7e8): 740-750. Campos, L. F. A.; Lanutti, J. N. L.; Mattos, L. M. M.; Pereira, D. D.; Inokutti, H. S.; Paschoarelli, L. C. (2012) Perception of products by different levels of integration: a study with pruning shears. In: M. M. Soares & F. Rebelo (Eds.), Advances in Usability Evaluation – Part I, (428-436). Chang, C-C., Wu, J-C., (2009). The underlying factors dominating categorical perception of product form of mobile phones.
International Journal of Industrial Ergonomics, 39 (5): 667-680. Cheng, H-Y., Chang, Y-M., (2009). Extraction of product form features critical to determining consumers’ perceptions of product image using a numerical definition-based systematic approach. International Journal of Industrial Ergonomics, 39 (1): 133-145. Choi, K., Jun, C., (2007). A systematic approach to the Kansei factors of tactile sense regarding the surface roughness. Applied
Ergonomics, 38 (1): 53-63. Chuang, M. C., Ma, Y-C. (2001). Expressing the expected product images in product design of micro-electronic products.
International Journal of Industrial Ergonomics, 27 (4): 233-245. Fenko, A., Schifferstein, H.N.J., Hekkert, P., 2010. Shifts in sensory dominance between various stages of user-product interactions. Applied Ergonomics, 41 (1): 34-40. Fogtmann; M. H.; Fritsch, J.; Kortbek, K. J. (2008) Kinesthetic Interaction - Revealing the Bodily Potential in Interaction Design.
In: OZCHI '08. Proceedings of the 20th Australasian Conference on Computer-Human Interaction: Designing for Habitus and Habitat, v. 8, pp. 89-96; New York: ACM. Herz, R. S.; Schooler, J. W. (2002). A naturalistic study of autobiographical memories evoked by olfactory and visual cues: Testing the Proustian hypothesis. American Journal of Psychology, 115: 21-32. Hsiao, S.-W., Chiu, F.-Y., Chen, C.S., (2008). Applying aesthetics measurement to product design. International Journal of
Industrial Ergonomics, 38 (11e12): 910-920. Hsu, S.H., Chuang, M.C., Chang, C.C. (2000). A semantic differential study of designers’ and users’ product form perception.
International Journal of Industrial Ergonomics, 25 (4): 375-391. McCabe, D. B.; Nowlis, S. M. (2003). The effect of examining actual products or product descriptions on consumer preference.
Journal of Consumer Psychology, 13: 431-439. Mondragón, S., Company, P., Vergara, M., (2005). Semantic differential applied to user-centred machine tool design.
International Journal of Industrial Ergonomics, 35 (11): 1021-1029. NAGAMACHI, M. (2002) Kansei engineering as a powerful consumer-oriented technology for product development. Applied Ergonomics, 33: 289–294. Petiot, J.F., Yannou, B., (2004). Measuring consumer perceptions for a better comprehension, specification and assessment of
products semantics. International Journal of Industrial Ergonomics, 33 (6): 507-525. Picard, R. Affective Computing. Massachusetts Institute of Technology, 1997. Sauer, J., Seibel, K., Rüttinger, B. (2010). The influence of user expertise and prototype fidelity in usability tests. Applied Ergonomics, 41 (1): 130-140. Sauer, J., Sonderegger, A., (2009). The influence of prototype fidelity and aesthetics of design in usability tests: effects on user
behaviour, subjective evaluation and emotion. Applied Ergonomics, 40 (4): 670-677. Schifferstein, H. N. J.; Cleiren, M. P. H. D. (2005) Capturing product experiences: a split-modality approach. Acta Psychologica, 118: 293–318. Schifferstein, H. N. J. (2006). The relative importance of sensory modalities in product usage: a study of self-reports. Acta
Psychology, 121: 41–64. Schifferstein, H. N. J.; Desmet, P. M. A. (2007). The effect of sensory impairments on product experience and personal wellbeing. Ergonomics, 50: 2026–2048.
Schütte, S. (2002) Designing feelings into products. Integrating kansei engineering methodology in product development. Thesis.
Linköping, Sweden: Linköping Studies in Science and Technology, Department of Mechanical Engineering. Schütte, S. (2005) Engineering Emotional Values in Product Design - Kansei Engineering in Development. Dissertation.
Linköping, Sweden: Linköping Studies in Science and Technology, Department of Mechanical Engineering. Schütte, S., Eklund, J. (2005). Design of rocker switches for work-vehicles-an application of Kansei engineering. Applied Ergonomics, 36 (5): 557-567. Schütte, S.; Eklund, J. (2005) Design of rocker switches for work-vehicles – an application of Kansei Engineering. Applied
Ergonomics, 36: 557-567. Schütte, S.; Eklund, J.; Ishihara, S.; Nagamachi, M. (2008). Affective meaning: the Kansei Engineering approach, pp. 477-494.
In: Schifferstein, H.; Hekkert, P. (Eds) Product Experience. New York: Elsevier. Spence, C.; Gallace, A. (2011) Multisensory Design: Reaching Out to Touch the Consumer. Psychology & Marketing, 28 (3): 267–308. Szybillo, G. J., & Jacoby, J. (1974). Intrinsic versus extrinsic cues as determinants of perceived product quality. Journal of
Applied Psychology, 59: 74–78. Vergara, M.; Mondragón, S.; Sancho-Bru, J.L.; Company, P., Agost, M.J. (2011) Perception of products by progressive multisensory integration. A study on hammers. Applied Ergonomics, 42: 652-664. Wallace, M.T. (2004). The development of multisensory processes. Cognitive Processes, 5: 69–83. Wellings, T., Williams, M., Tennant, C., (2010). Understanding customers’ holistic perception of switches in automotive human-
machine interfaces. Applied Ergonomics, 41 (1): 8-17. Wellings, T., Williams, M.A., Pitts, M., (2008). Customer perception of switch-feel in luxury sports utility vehicles. Food Qual.
Prefer. 19 (8): 737-746.
LISTED IN THE AHFE DIGITAL BOOKSTORE CATALOGUE
Explore the complete digital volume
Advances in Ergonomics In Design, Usability & Special Populations: Part III
Read this individual research paper free through the original publisher, or explore the full digital proceedings book.
ISBN 978-1-4951-2108-1
Explore this ISBN in the AHFE Bookstore ↗Listed in the July 2026 bookstore catalogue; search by ISBN to confirm current availability · Digital book purchase optional