Qilong Feng, Ameersing Luximon, Balasankar Ganesan, Chee Kooi Chan (2018). Foot Dynamic Model for Investigate Foot Motion During Walking. In: Advances in Physical Ergonomics and Human Factors: Part II. AHFE Open Access, vol. 2. https://doi.org/10.54941/ahfe100074
Understanding dynamic foot is essential for foot health, footwear design and construction. This study was designed to investigate foot deformation during walking. A pilot experiment using motion capture system was conducted to record the landmark motion. The data showed the foot motion including landmark trajectories and the foot changes with time. In addition, the relative landmark position was further analyzed. The result showed the changes of foot landmarks. Application of this study will be useful for modeling dynamic foot shape, foot evaluation and footwear design.
The human foot is a complex anatomical structure composed of 26 bones, 33 joints and other structures. The function of the foot is to transmit force to the ground, so the whole body could be stable (Dawe and Davis, 2011). Large deformation from the neutral posture of a foot can place excessive stress giving rise to discomfort and pain (Luximon and Goonetilleke, 2004). The structure of foot also has an important role in locomotion (Gefen et al., 2000), and so the foot shape changes is an important area of foot and footwear research. Understanding the role of different structures contributing to normal gait would help the research into foot dysfunction (Dawe and Davis, 2011).
Foot problems in motion The research related to foot shape and deformation is essential to understand foot injuries during foot motion. Morio et al. (2009) found that shoes restricted the natural barefoot motion. In the overview of Simonsen and Alkjaer (2012), the problems of normal human walking had been identified. Their result indicated that people walking with flexed knee joints beyond the normal range causes higher knee joint extensor moments, which may result in injuries. Since people take between 10,000 and 20,000 walking steps per day, the knee joint degeneration found in some individuals is highly possible with the increased bone-on-bone force in the knee joint.
Motion analysis
Human motion analysis has attracted attention from various fields, especially among computer vision researchers (Wang et al., 2003). Davis et al. (1991) utilized a video-based data collection strategy, with passive retro-reflective markers to collect motion data from subjects. The motion capture system can be divided into marker-based optical ones and markerless optical ones (Sigal, 2012). Compared to markerless ones, the marker-based optical motion capture can provide more accurate changes in the joint angles. Marker-based optical motion capture systems are widely used in research. Leardini et al. (2007) used it for developing protocol of children gait analysis. Carson et al. (2001) used motion capture for evaluation on human kinematic analysis for multi-segment foot model. Horiuchi et al. (2006) has used motion capture for the development of human step measurement. Other methods for motion analysis include digital radiographic fluoroscopy (DRF) (Gefen et al., 2000) and camera method. During the six sequential characteristic sub-phases including (1) initial-contact, (2) heel strike, (3) midstance, (4) forefoot-contact, (5) push-off and (6) toe-off, X-ray recorded skeletal and soft tissue motion, so as to locate the foot joints and bones (Gefen et al., 2000). Kimura et al. (2005) used a collection of 60 landmarks on the human body as reference. These included 14 points on the feet (7 separately landmarks on each foot). In addition, researchers have provided information of foot shape deformation. Kimura et al. (2005) used eight sets of IEEE1394 cameras to capture the foot girth and the shape of selected cross-sections at different frame while walking.
Modeling technique The modeling of human motion involves static model and dynamic model. Luximon (2007) used foot profiles and outlines to adjust a ‘standard’ 3D foot model to create individualized static foot shape. Researchers investigating foot shape and its changes include two-dimensional finite element model (FEM) (Nakamura, 1981) and the three- dimensional finite element model (Cheung and Zhang, 2005). Cheung and Zhang (2005) developed an FEM for insole design. Yu (2008) researched into a model of female foot wearing high heel shoes to evaluate the shoe design. With the use of motion capture, Jenkyn and Nicol (2007) researched into the model of forefoot motion for clinical gait analysis, providing the axis of joint, range of motion angles, and comparison between subject and between current findings and former research results. Nester et al. (2007) compared the walking measurement using both bone pin and surface marker of motion capture, and form the experimental foot model to find the differences between two methods.
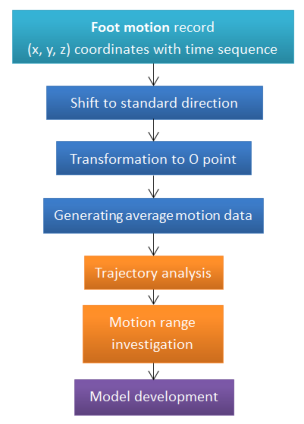
FRAMEWORK AND METHODOLOGY The analysis of foot motion data was generated using the XYZ coordinate listed as time sequence. The investigation is divided into two sections. This procedure is shown in Figure 1 and described in details.
Figure 1. The flowchart of investigation of foot motion
Data transformation and selection The output data was in form of XYZ coordinate based on time sequence. To present the clear motion within one gait cycle, the data (x, y, z) between two heel strikes would be selected. Based on the relation between time and coordinate change, the heel strike occurs before the heel part keeps static in stance phase. With the selected data of one gait cycle, all the same landmark in several trials was shifted to the parallel direction. Then translation was applied to each trial so that they could overlap with the others. The whole gait cycle is regarded as 100% of the lasting time. In other words, the time at first heel strike was t0, and the location data was at the point (x0, y0, z0). The shifted and transformed coordinate become xs=(x-x0) and ys=(y-y0). z indicates the height above ground, including the height of the platform (zs=z-Hplatform ). So the standardized time (ts) is given by ts= (t0/tmax)* 100%, tmax is the time for one gait cycle in sec. The data analysis was then done with the transformed data.
Investigation into the normal walking motion The normal walking gait cycle was generated using the new shifted data. From 0 to 100% of the gait cycle, the coordinate values of all the landmarks in time sequence were displayed within one graph. Since the frequency of the motion capture system is 60 Hz, the coordinate values data could be presented with short intervals. The graph shows the trajectory of walking path. In the equation of landmark trajectories, only three elements (X, Y, Z) were used. The equation can be obtained in form of F=f (xs, ys, zs, ts).
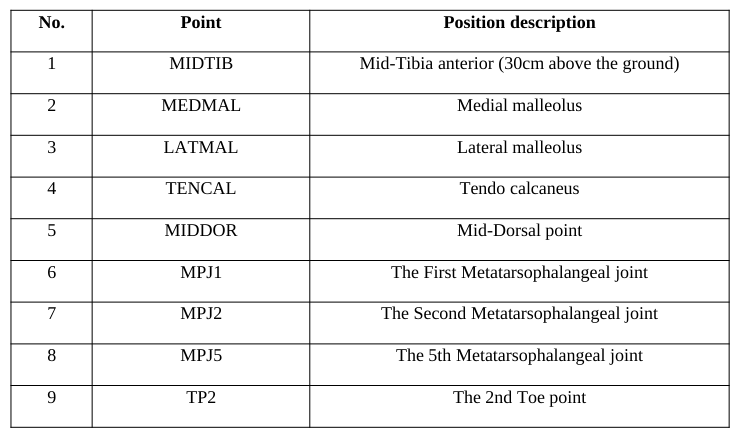
The graphs of the relationship between time and the coordinate axis (X-Axis, Y-Axis, and Z-Axis) show the motion of each foot landmarks. In addition, the landmark position in the 3D space can be evaluated at any time t i. ti is between 0 to 100% of ts, a selected point in the gait cycle. The landmark is represented as pi, where i = 1, 2, 3, …, n (landmark number listed in Table. 1).
Table 1: Descriptions of landmarks on foot surface No. Point Position description
EXPERIMENT Participant information
A female subject without any foot disease and deformity was invited to participate in this study and she was asked to sign on the consent form first. In the information form, her age, weight, and height were recorded. The participant was aged 26 years old. She had a height of 157cm, and a body weight of 50kg. The feet of participant were cleaned and disinfected with an antiseptic germicide tissue. After participants dried their feet, the length, width and girth of both feet were measured using the Brannock device and a tape.
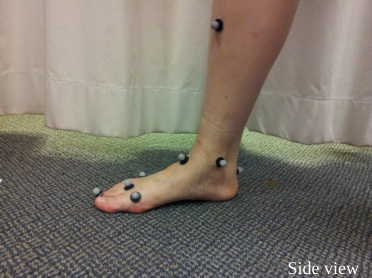
Defining the location of foot landmarks There were 9 points marked on the foot (Figure 2): 4 landmarks on the forefoot, 1 landmark on the mid-foot, 3 landmarks on the hind foot, and 1 landmark on the shank. The markers were selected with reference of the featured points of the foot: second toe, metatarsophalangeal joints, mid tarsal joints, talus, and shank. Table 1 provides the detailed information of the marks and its position on the foot.
1
1
1
5
8
3 2 5
4 2
9
4 3
6 7
5 6 7
6 7 8
8 9
9
Front view Side view Side view
Figure 2. Landmarks with retro-reflective markers on foot surface
The landmarks were identified by palpating the bony prominence of joint and tuberosity of the bones. References included the metatarsophalangeal joints, and the tarso-metatarsal joints. The forefoot part was presented with four points on the metatarsophalangeal joints and the toe, showing the edge of the foot. Points at the mid-dorsal indicated the edge of the upper surface. The landmarks on the tendo calcaneal, medial malleolus and lateral malleolus are together forming the hind foot area. Tip of the calcaneal point helps to acknowledge the hind foot motion. Also, one point was added to the shin of the tibia, and it is located 30 cm above from the ground level of the foot.
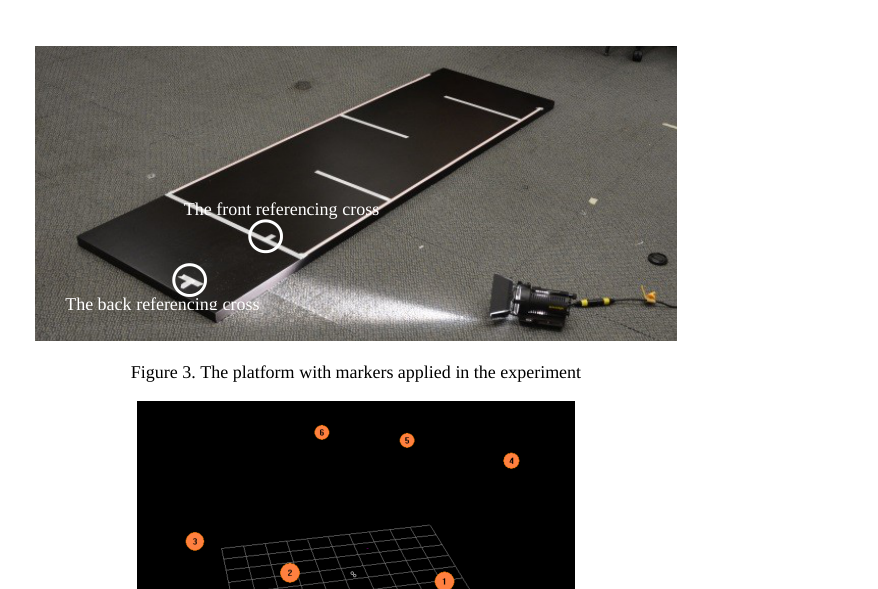
Equipment preparation and experiment environment VICON motion capture system (Oxford Metrics Limited, Oxford, United Kingdom) was used to capture the dynamic foot. This motion capture system could recognize the movement of retro-reflective markers attached to the foot surface. The 14 retro-reflective markers were attached to the foot with double-adhesive tape, and 0.5cm space between the marker and the surface of foot. A firm platform with enough length was used as the walking path. On the platform markers (Figure 3) were set based on the step length for instruction and reference. Referencing markers included standing position, starting line, step length allowance and finishing line. This VICON motion capture system consists of 6 cameras, which were used to record motion during walking time. Figure 4 shows the position of the camera in the experiment setup.
The front referencing cross
The back referencing cross
Figure 3. The platform with markers applied in the experiment
Figure available in the original PDF paper.
Figure 4. Camera locations for recording foot motion
Foot motion and landmark recording The motion-capture system (Vicon system) records the marker moving depending on the reflection of light. So, around the recording area of 6 cameras no other reflecting objects were allowed to appear. Participants were required to place at the standing position with instruction of cross markers. As shown in Figure 3, the second toe (TP2) of participant was required to point at the front referencing cross, and the hind foot marker (TENCAL) was pointing to the center of the back referencing cross. The platform was marked with lines and crosses to increase repeatability, for the reason that data may vary depending on different foot standing location.
The cameras started to capture the motion of retro-reflective markers and the participant was requested to walk. Participant walked three steps and then stepped down the platform. The motion of the foot can be observed as coordinates of landmarks in time sequence. In the three steps, data were selected between the first heel strike and the second one, in reference of the definition of a gait cycle.
RESULT AND DISCUSSION
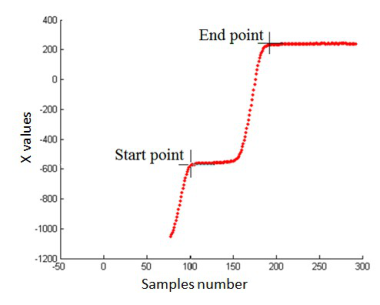
In this study, the investigation of foot motion during walking is developed in a trial experiment. The motion capture system could provide the motion data of landmarks for analysis. In this trial experiment a total of 9 times of trial walking were recorded. Landmarks were attached only on the right foot of the participant, and the information of left foot (length, width, and girth measurement) was saved as reference. The overall data recorded in the walking motion was integrated together based on time sequence. The periodical variation showed the start and end of one gait cycle. Figure 5 shows the overall trajectory of the walking motion for one landmark (TENCAL). This is an important landmark for determining the instance of heel strike. The x-axis is the samples number (samples are taken at 60 Hz) and the y-axis is the X-coordinate values.
Figure 5. The trajectory of TENCAL and one gait cycle selection
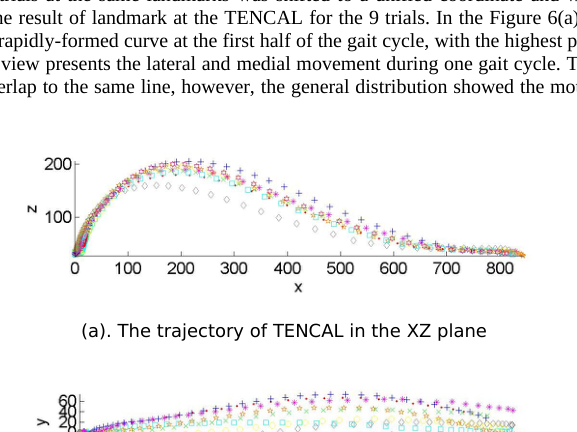
First, the data of nine trials at the same landmarks was shifted to a unified coordinate and with the same starting point. Figure 6 gives the result of landmark at the TENCAL for the 9 trials. In the Figure 6(a) the side view of the heel motion presents a rapidly-formed curve at the first half of the gait cycle, with the highest point up to 200mm. In the Figure 6(b) the top view presents the lateral and medial movement during one gait cycle. The individual motion in each trial did not overlap to the same line, however, the general distribution showed the motion range of the foot swing.
(a). The trajectory of TENCAL in the XZ plane
(b). The trajectory of TENCAL in the XY plane
Figure 6. The trajectory of TENCAL
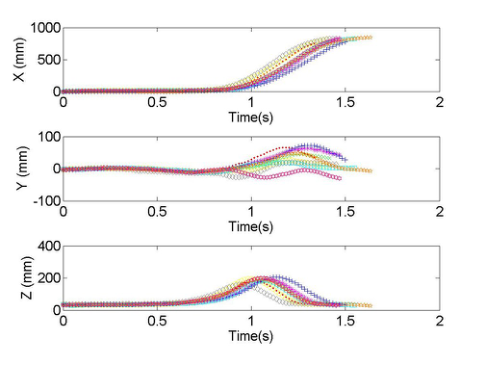
To compare the relative motion in time sequence, an integrated graph showing the relation between time and axis (X, Y, Z) was drawn and displayed in Figure 7. From the first graph (time and X change) the foot movement speed is presented. It showed that the first part of the gait cycle (about 60%) the X coordinate did not increase, indicating that there was no movement. In the following 40% part of the gait cycle, the X-coordinate value increased rapidly till 800mm, showing that foot motion in the X axis occurred in the swing phase. This is consistent with normal gait cycle.
In figure 7, Y-axis change with time indicates the lateral and medial motion of the foot during the gait cycle. The graph shows large variations between repetitions. In addition, time and Z-axis relation showed the time of foot lifting and its highest point. The general path provided the information that foot moves to the highest point at around 75% of the gait cycle. After that, the foot move toward the ground to have another heel strike.
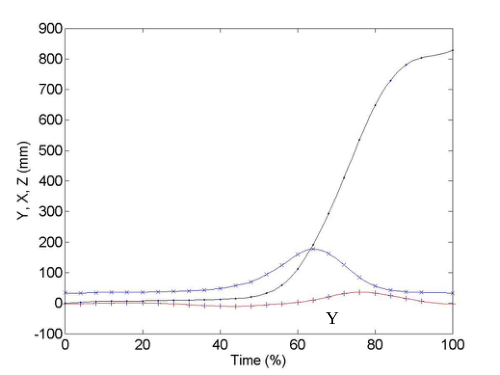
Figure 7. The motion of TENCAL landmark in X, Y, Z axis based on time sequence The different repeated gait was standardized to 100%. Then, based on the motion result in X, Y, Z axis in time sequence, an average path was drawn to present the standard motion (Figure 8). In the figure the changes of the X, Y, Z values occurred at nearly the same time and the three coordinate values formed the motion in three-dimensional space. It can be observed that the length of one foot step is around 800mm, and the height is 200mm at the highest point. At the first half of the gait cycle, the landmark on the heel did not move too much, because during this period of time the foot was at its stance phase on the ground. In this investigation of the foot motion during walking, the trial experiment gave some result including coordinate positions and time sequence mapping. The trajectories provide the information of foot motion. In this study, we have presented only one landmark, but we have computed the result for all the 9. Detailed observation of these trajectories can be used for further modeling of motion paths and 3D foot shape deformations.
X
Z
Y
Figure 8. The average motion of TENCAL landmark in X, Y, Z axis based on time sequence
CONCLUSIONS
In this study, a trial of investigation of foot motion during walking is developed and analyzed. With the application of motion capture system, foot motion at representative landmarks provided coordinate information in time sequence. Both the trajectories of selected landmarks within one gait cycle were evaluated. Further analysis of the data is essential to build accurate model for dynamics foot shape.
ACKNOWLEDGEMENTS
This study was supported by RGC General Research Fund (B-Q26V). The authors also acknowledge the supports from the Hong Kong polytechnic University.
REFERENCES
Carson, M.C., Harrington, M.E., Thompson, N., O’Connor, J.J., Theologis, T.N. (2001), “Kinematic analysis of a multi-segment foot model for research and clinical application: a repeatability analysis”, Journal of Biomechanics, Volume 34. Cheung, J.T., Zhang, M. (2005), “A 3-dimensional finite element model of the human foot and ankle for insole design”, Archives
of Physical Medicine and Rehabilitation, Volume 86. Davis, R.B., Ounpuu, S., Tyburski, D., Gage, J.R. (1991), “A gait analysis data collection and reduction technique”, Human Movement Science, Volume 10. Dawe, E.J.C., Davis, J. (2011), “Anatomy and biomechanics of the foot and ankle”, Mini-symposium: the foot and ankle,
Orthopaedics and trauma, Volume 25, No. 4. Gefen, A., Itzchak, M.Y., Arcan, M. (2000), “Biomechanical analysis of the three-dimensional foot structure during gait: a basic tool for clinical applications”, Journal of biomechanical engineering, Volume 122. Horiuchi, T., Kanehara, M., Kagami, S., Ehara, Y. (2006), “A probabilistic walk path model focused on foot landing points and
human step measurement system”, IEEE International Conference on Systems, Man, and Cybernetics, Taiwan. Jenkyn, T.R., Nicol, A.C. (2007), “A multi-segment kinematic model of the foot with a novel definition of forefoot motion for use in clinical gait analysis during walking”, Journal of Biomechanics, Volume 40. Kimura, M., Mochimaru, M., Kouchi, M. (2005), “3D cross-sectional shape measurement of the foot while walking”,
Proceedings of the 7th Symposium on Footwear Biomechanics, International Society of Biomechanics. Leardini, A., Sawacha, Z., Paollini, G., Ingrosso, S., Nativo, R., Benedetti, M.G. (2007), “A new anatomically based protocol for gait analysis in children”, Gait and Posture, Volume 26. Luximon, A., Goonetilleke, R.S. (2004), “Foot shape modeling”, Human factors, Volume 46, No. 2. Luximon, A., Goonetilleke,
R.S., Zhang, M. (2007), “3D foot shape generation from 2D information”, Ergonomics, Volume 48, No. 6. Morio, C., Lake, M.J., Gueguen, N., Rao, G., Baly, L. (2009), “The influence of footwear on foot motion during walking and running”, Journal of biomechanics, No. 42. Nakamura, S., Crowninshield, R.D., Cooper, R.R. (1981), “An analysis of soft tissue loading in the foot: a preliminary report”,
Bulletin of prosthetics research, Volume 10. Nester, C., Jones, R.K., Liu, A., Howard, D., Lundberg, A., Arndt, A., Lundgren, P., Stacoff, A., Wolf, P. (2007), “Foot kinematics during walking measured using bone and surface mounted markers”, Journal of Biomechanics, Volume 40. Sigal, L. (2012), “Lecture of motion capture”, Human motion modeling and analysis. Simonsen, E.B., Alkjær, T. (2012), “The variability problem of normal human walking”, Medical engineering and physics,
Volume 34. Wang, L., Hu, W., Tan, T.N. (2003), “Recent developments in human motion analysis”, Pattern Recognition, Volume 36. Yu, J., Cheung, J.T.M., Fan, Y., Zhang, Y., Leung, A. K.L., Zhang, M. (2008), “Development of a finite element model of female foot for high-heel shoe design”, Clinical Biomechanics, Volume 23.
LISTED IN THE AHFE DIGITAL BOOKSTORE CATALOGUE
Explore the complete digital volume
Advances in Physical Ergonomics and Human Factors: Part II
Read this individual research paper free through the original publisher, or explore the full digital proceedings book.
ISBN 978-1-4951-2105-0
Explore this ISBN in the AHFE Bookstore ↗Listed in the July 2026 bookstore catalogue; search by ISBN to confirm current availability · Digital book purchase optional