Robert Gutierrez, Joe Hart, Laura Barnes, Mehdi Boukhechba (2022). Using Inertial Measurement Units (IMU) and Comparative Trajectory Analysis for Modeling Micro-level Human Motion Dysfunction. In: Human Factors and Wearable Technologies. AHFE Open Access, vol. 29, pp. 29–35. https://doi.org/10.54941/ahfe1001471
Ubiquitous sensing from smartphones and wearable devices has proven to be useful for applications ranging from sports to modern medicine. The aim of this paper is to propose a visualization framework to illustrate the points in time when a query trajectory is deviating the most from a reference trajectory. Validation is performed through the use of a novel post ACL reconstruction dataset. Validation is performed through wearable sensing data collected from 11 patients recovering from ACL reconstruction and 10 healthy participants. Results provide promising insights about how this method can be used to visualize anomalies in motion trajectories and to detect abnormal motion patterns.
Modeling motion trajectory is important in a variety of applications such as sports performance analysis, gaming, animation, and healthcare. Though cost and the adoption of new technologies are barriers to entry for most heal- thcare applications, low-cost wearable inertial measurement units (IMUs) have proven to be an ideal solution for tracking motion (Auepanwiriyakul et al., 2020). Healthcare practitioners can leverage this technology through progress-based applications such as motor function analysis and rehabilita- tion. However, despite emerging support for the effectiveness of IMU enabled mobile health applications, there is little emphasis on developing new visua- lizations for IMU motion trajectory (Bortone et al., 2018; Porciuncula et al., 2018). Erbaugh noted that visual feedback plays a pivotal role in one’s abi- lity to make correct movements. In the case of range of motion (ROM) assessment, visualization empowers both the doctor and patient to be more informed on one’s motion that would otherwise be lost in a single quantita- tive number (Erbaugh, 1985). Therefore, by visualizing the motion trajectory, quantitative measures of motion can be evaluated while also assessing the quality of that movement.
Specifically, identifying the points in time when a patient’s motion is devi- ating from an accepted reference trajectory can aid in understanding fatigue, ROM limitations, and various movement qualities relevant to the exercise. Then, by leveraging analytical modeling, we can derive quantitative measures on the quality of movement to capture activity performance. As the motions that matter most will differ across diagnoses and applications, there will also be variance across the patients. The patient-to-patient variation here does not refer to the individualized preference of motion for increased quality of life, but rather the difference in severity of a patient’s underlying diagnosis. For example, the range of motor function impairment for children with spi- nal muscular atrophy (SMA) include those who can move independently and those whose only movement is a small flexion of the wrist. Comparative tra- jectory analysis is one method that can assess motion quality characteristics of wrist position and orientation, acceleration profile, and various angles.
In this work, we propose a new visualization framework that combi- nes analytical modeling with comparative trajectory analysis to model IMU motion data into meaningful information related to the quantity and quality of motion.
RELATED WORK
In this section, we summarize related work involving the use of IMU sen- sors for trajectory visualization as well as the methods for comparing the similarity between trajectories.
First, we define a trajectory as a continuous sequence ordered by time- stamps. We also define an IMU as an integrated sensor that combines a triaxial accelerometer, a triaxial gyroscope, and often times, a magneto- meter. Many attempts have been made to use IMU devices for tracking motion but very few put emphasis on visualizing the trajectory of that motion (Boukhechba & Barnes, 2020; Jia et al., 2019; Li et al., 2019; Narongw- ongwathana et al., 2019). Motion capture with these devices are becoming essential for research areas focused on sports performance analysis, rehabili- tation, and various medical applications as the market for wearable IMUs has become saturated with devices, ranging from smartwatches to high precision devices.
Motion trajectory analysis is more than just measuring human movement, but also visualizing and analyzing the data in a manner that provides feed- back for understanding differences, such as left versus right or current status compared to a baseline. The best motion tracking systems rely on video-based methods or a combination of devices (wearables, cameras, etc.), which are costly and impractical for capturing everyday motion (Destelle et al., 2014; Filippeschi et al., 2017; Galna et al., 2014). Wearable IMUs have the poten- tial to fill the gap where video-based motion tracking falters. With the vast amount of data available from IMUs, rehabilitation and sports performa- nce analysis can be optimized to determine how, when, and where a person should move to achieve the desired outcome. Thus, quantifying the simila- rity between IMU movement trajectories allows for the assessment of motion performance.
Using Inertial Measurement Units (IMU) and Comparative Trajectory Analysis 31
Next, we introduce a few of the methods commonly used for comparing the similarity between trajectories. Given two sequences of time series data, the sequences or trajectories can be compared directly through the use of a distance metric to produce a single value that represents the similarity betw- een them according to movement patterns. Su et al conducted a survey of trajectory distance measures, evaluating 15 distance measures based on data type (discrete versus continuous) and whether the measure considers tempo- ral information (Su et al., 2020). We will highlight a few of them, beginning with the most common distance metric, Euclidean Distance (ED). ED is defi- ned as the summation of the ordered point pair distances. However, ED has several limitations, especially in its ability to handle signal transformations, such as shifting and scaling, and the requirement for the sequences to be the same length. Dynamic Time Warping (DTW) is a distance measure that is robust to many of the limitations of ED, including shifts, scaling, and equal series length. DTW overcomes the length limitation by calculating a warping path that minimizes the distance between pairs of indices, subject to a few constraints (Berndt & Clifford, 1994). The warping path is essentially the performance of ED between multiple points along the sequences, allowing for a many-to-one comparison. The metric is then defined as the summation of the minimal distances for each point. While other distance measures may be used to align the trajectories, we focused on one method that requires all sample points to be matched pairs.
STUDY DESIGN To illustrate the applicability of our approach, we apply the framework to our novel dataset. Our dataset is an ongoing study, with 11 patients who have undergone anterior cruciate ligament reconstructive (ACLR) surgery and 10 healthy participants. The purpose of our study is to evaluate an individual’s likelihood for re-injury using muscle symmetry and forecast a patient’s progress toward return-to-sport (RTS). The study involves a wal- king gait analysis, a muscle strength assessment using the Biodex isokinetic dynamometer (Biodex Medical Systems Inc., NY, USA), followed by hopping tests, if able. Placing a Delsys Trigno™sensor (Delsys Inc., MA, USA) on each mid quadricep, we monitor these physical activities at two time points: (1) During rehabilitation, approximately half way through the rehabilitation process (3–4 months post-surgery) and (2) At the time of release to unrestri- cted physical activity (~6 months post-surgery). Using our framework, we can leverage the motion and EMG data to better inform rehabilitation programs and the RTS decision process on a patient’s progress.
Our proposed Comparative Trajectory Visualization framework In this section, we describe the steps of our framework. Note that our fra- mework assumes the following conditions: 1) trajectories are heterogeneous (reported in the same time reference), 2) movement is along one axis, and 3) is continuous.
Motion alignment: First, we select an algorithm that compares two time series sequences through ordered pairs. Though the occurrence of equal
length trajectories is rare to happen in the wild, the length limitation for using ED as a distance metric can be overcome through the use of more robust distance measures, such as DTW.
Time segmentation: Next, we use the matched indices used to align the trajectories as breakpoints for creating time windows. These linearly spa- ced points become the initial x-coordinate values in our graph. However, we found that it is more informative to show the elapsed time for a given move- ment of the query sequence. Using the timestamps of the query trajectory, we find the time delta between the time window indices, to show an elapsed time.
Feature representation: Select a statistical feature to aggregate the time windows and represent the Y-coordinate values (e.g., mean acceleration).
Divergence analysis: Compare the time window features from the query sequence to the reference sequence by finding the difference or through the use of a distance metric. This determines the dot size. Furthermore, the one- way ANOVA test can also be used to adjust the dot size if the difference is found to be significant.
Visualization: Plot the aligned query and template sequences with the Matching Index Segmentation Trajectory Analysis (MISTA) dots.
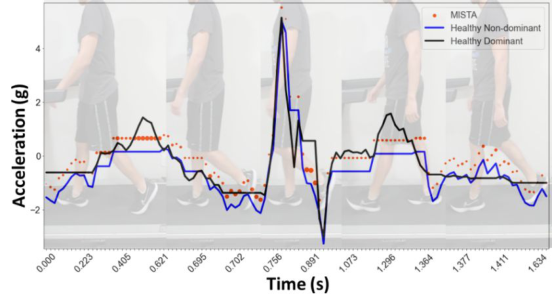
As an example, Figure 1 shows phases from a healthy participant (HP1)’s gait cycle with the corresponding framework plot that compares the symme- try between the acceleration of their dominant and non-dominant leg. The black line is the template or reference trajectory (participant’s dominant leg) while the blue line is the query trajectory (participant’s non-dominant leg). The framework plot in Figure 1 uses DTW to align the trajectories since the lengths were unequal. After extracting the matched indices to form our time windows, we selected the max to represent each window, which becomes the new y-coordinate values. Then, we found the difference of the max bin values between the query trajectory and the template trajectory. As an additi- onal measure, we also computed the one-way ANOVA test and adjusted the dot size three times larger if the difference was significant at an alpha of 0.05. Finally, we plot the new y values along the same range as the full trajectories, and use the new bin distance measure output as the dot size of each bin. The dot size indicates where the largest deviations are along the query trajectory.
By applying our framework to the acceleration profile of HP1healthy par- ticipant 1’s gait, we are able to visualize and extract the exact timing of deviations from symmetry. From Figure 1, we can see that the participant’s acceleration profile is generally the same for each leg, with the exception of two peaks from the dominant leg (template). The first peak around 0.493 seconds is in relation to the toe lift phase while the second peak around 1.2 seconds is the leg coming forward after the foot becomes flat with the ground. The acceleration and deceleration during the swing phase are nearly identical.
RESULTS
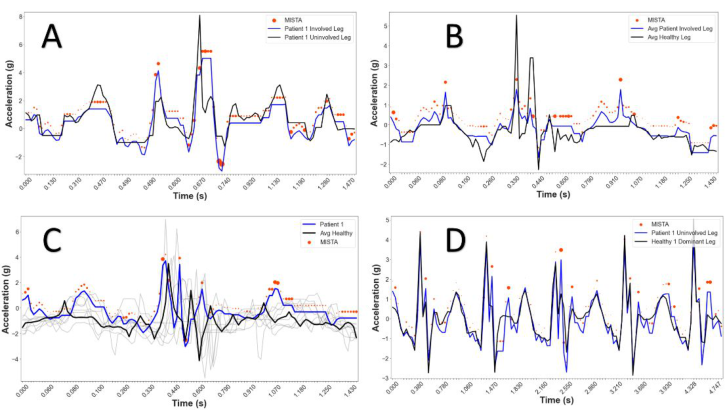
In this section, we demonstrate how MISTA can be used to visualize motion differences across groups and this on different scales. In Figure 2, plot A depi- cts the symmetry between patient 1’s gait cycle. Next, in plot B, we compare
Using Inertial Measurement Units (IMU) and Comparative Trajectory Analysis 33
Figure 1: Walking gait cycle and associated framework plot of healthy participant (HP1).Figure 2: Framework plot for walking gait cycle of patient 1 in 4 variations: (A) symme- try, (B) average patient vs average healthy, (C) average healthy comparison, and (D) multi-cycle assessment.
the average gait cycles from the injured leg of the 11 patients to the ave- rage gait cycle of both legs of the 10 healthy participants. Then, we compare patient 1’s injured leg gait cycle to the average gait cycle of all our healthy participants in plot C. Finally, plot D compares the patient 1’s motion across multiple gait cycles.
Analyzing the symmetry plot further, we used patient 1’s uninjured leg as the template and their injured leg as the query – patient had undergone ACLR surgery on the right knee. Using the same framework parameters as in Figure 1, we notice the uninjured leg is generally higher throughout the gait cycle. The lower acceleration exhibited by the patient’s injured leg is consistent with the lower acceleration found in plot B by the average patient compared to the average healthy participant. Then, there is a clear difference in the acceleration down from the swing phase, stemming from the patient’s
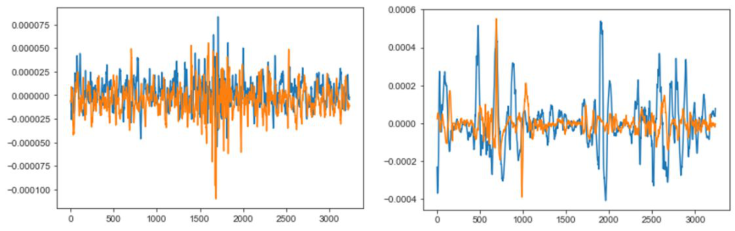
Figure 3: EMG plots of the gait cycle for healthy participant 1 (left) and patient 1 (right).
inability to keep their knee elevated. Then, we notice the number of large dots throughout the framework plot, appearing around most of the peaks and valleys. The larger dots indicate statistically significant differences of the max values during the gait acceleration profile. A key observation occurs just after 1.120 seconds, where the injured leg appears to show no acceleration. This translates to when the patient kept their foot on the ground and their leg straighter for a longer amount of time, followed by a double hitch as they again bring their foot forward. From our observation, Patient 1 had difficulty extending their injured leg and can be detected through our framework plot. Therefore, the patient’s gait currently lacks good symmetry.
As validation, we look to the EMG profiles during the same gait cycle displayed in Figure 2A. The left EMG plot in Figure 3 shows healthy partici- pant 1 exhibiting very good symmetry during their gate cycle, while the right EMG plot reveals the clear lack of symmetry of patient 1. Not only is the strength of the injured signal (orange) for patient 1 much less throughout the motion, but it is also less consistent.
CONCLUSION
Our framework allows for a customizable and visually enabled approach to quantify the relationship between two trajectories. Our approach provi- des the user with the ability to choose a variety of options, including the alignment algorithm, desired time window size based on extracted indices, statistical feature representation, distance metric, and preferred visual modi- fications. This allows researchers and physicians alike the ability to assess quantitative outcomes paired with measurable metrics on the quality of the movements, providing informative data for rehabilitation interventions and monitoring recovery.
REFERENCES
Auepanwiriyakul, C., Waibel, S., Songa, J., Bentley, P., & Faisal, A. (2020). Accuracy and Acceptability of Wearable Motion Tracking Smartwatches for Inpatient Monitoring. https://doi.org/10.1101/2020.07.24.20160663 Bortone, I., Leonardis, D., Mastronicola, N., Crecchi, A., Bonfiglio, L., Procopio,
C., Solazzi, M., & Frisoli, A. (2018). Wearable Haptics and Immersive Virtual
Using Inertial Measurement Units (IMU) and Comparative Trajectory Analysis 35
Reality Rehabilitation Training in Children With Neuromotor Impairments. IEEE Transactions on Neural Systems and Rehabilitation Engineering, 26(7), 1469– 1478. https://doi.org/10.1109/TNSRE.2018.2846814 Boukhechba, M., & Barnes, L. E. (2020). Swear: Sensing using wearables. Generalized human crowdsensing on smartwatches. International Conference on Applied Human Factors and Ergonomics, 510–516. Destelle, F., Ahmadi, A., O’Connor, N. E., Moran, K., Chatzitofis, A., Zarpalas, D.,
& Daras, P. (2014). Low-cost accurate skeleton tracking based on fusion of kinect and wearable inertial sensors. 2014 22nd European Signal Processing Conference (EUSIPCO), 371–375. Filippeschi, A., Schmitz, N., Miezal, M., Bleser, G., Ruffaldi, E., & Stricker, D. (2017). Survey of Motion Tracking Methods Based on Inertial Sensors: A Focus on Upper Limb Human Motion. Sensors (Basel, Switzerland), 17(6), 1257. https://doi.org/10.3390/s17061257 Galna, B., Barry, G., Jackson, D., Mhiripiri, D., Olivier, P., & Rochester,
L. (2014). Accuracy of the Microsoft Kinect sensor for measuring move- ment in people with Parkinson’s disease. Gait & Posture, 39(4), 1062–1068. https://doi.org/10.1016/j.gaitpost.2014.01.008 Jia, H., Wu, Y., Liu, J., Yao, L., & Hu, W. (2019). Mobile Golf Swing Tracking Using Deep Learning with Data Fusion: Poster Abstract. Proceedings of the 17th Conference on Embedded Networked Sensor Systems, 422–423. https://doi.org/10.1145/3356250.3361968 Li, C., Yu, L., & Fei, S. (2019). Real-Time 3D Motion Tracking and Reconstruction
System Using Camera and IMU Sensors. IEEE Sensors Journal, 19(15), 6460– 6466. https://doi.org/10.1109/JSEN.2019.2907716 Narongwongwathana, W., Punyabukkana, P., Kitisomprayoonkul, W., & Chonnaparamutt, W. (2019). WAAM: Wearable Assessment Arm Motion System. 2019 12th Biomedical Engineering International Conference (BMEiCON), 1–5. https://doi.org/10.1109/BMEiCON47515.2019.8990297 Porciuncula, F., Roto, A. V., Kumar, D., Davis, I., Roy, S., Walsh, C. J., & Awad, L.
N. (2018). Wearable Movement Sensors for Rehabilitation: A Focused Review of Technological and Clinical Advances. PM&R, 10(9, Supplement 2), S220–S232. https://doi.org/10.1016/j.pmrj.2018.06.013
LISTED IN THE AHFE DIGITAL BOOKSTORE CATALOGUE
Explore the complete digital volume
Human Factors and Wearable Technologies
Read this individual research paper free through the original publisher, or explore the full digital proceedings book.
ISBN 978-1-958651-05-6
Explore this ISBN in the AHFE Bookstore ↗Listed in the July 2026 bookstore catalogue; search by ISBN to confirm current availability · Digital book purchase optional