Lucky John Tutor, Yi Cai (2024). Monitoring Rehabilitation of Stroke Patients Using Automated Fugl-Meyer Assessment. In: Human Factors and Wearable Technologies. AHFE Open Access, vol. 141, pp. 105–113. https://doi.org/10.54941/ahfe1005059
The Fugl-Meyer Assessment (FMA) is a widely used method for evaluating the motor function of stroke patients. During the assessment, patients are instructed to perform a series of predefined motions outlined in the FMA manual, while an evaluator scores each motion using a 3-point Likert scale. A score of 2 is given for flawless execution, a score of 1 for partial completion, and a score of 0 for no execution or lack of motion. Traditional FMA assessments rely on manual visual inspection, but recent studies have explored automating the process using motion capture technology or IMU and EMG sensors. However, motion capture technology is limited in terms of portability due to its complex setup, making IMU and EMG sensors the preferred choice. Previous studies utilizing these sensors have collected data to train machine learning algorithms for predicting FMA scores. Although this approach eliminates manual inspection, it still yields a 3-point score based on the Likert scale, which can be ambiguous and fails to capture subtle improvements or differences in motor function during motion execution. To address this issue, the current study aims to implement a Modified Automated FMA that employs a percentage-based scoring system to overcome the ambiguity of the 3-point Likert scale. Scoring will be based on data collected from IMU and EMG sensors while participants perform various upper limb motions. A maximum threshold will be established as the baseline, representing the normal range of motion for individuals without mobility impairment. The assumption is that stroke patients with mobility impairments will struggle to achieve the normal range of motion indicated in the FMA manual, resulting in sensor data falling below the maximum threshold. The dataset will be obtained by instructing participants to perform a series of upper limb motions. Two scenarios will be simulated to train and test the algorithm. The first scenario involves full execution of the upper limb motions, serving as baseline data for the normal range of motion. The second scenario entails partial execution of the motions, representing data from individuals with mobility impairment. By training the algorithm on this dataset using Support Vector Machine (SVM) and Dynamic Time Warping (DTW), it will be capable of detecting whether a participant's motion falls within the normal range and providing immediate feedback in the form of percentage scores through, indicating the deviation from normal execution. In conclusion, the Modified Automated FMA, utilizing a percentage-based scoring system based on IMU and EMG sensors, offers a promising solution for assessing motor function in stroke patients. The percentage-based scoring system provides a precise assessment of motor function, capturing even subtle improvements which contribute to improved treatment planning and better tracking of rehabilitation outcomes. Additionally, the integration of digital twin technology with wearable devices allows for remote rehabilitation and personalized care. Patients can now engage in rehabilitation exercises from the comfort of their homes while healthcare professionals remotely monitor their progress. This innovative approach enhances the quality of life for stroke patients by providing convenient access to rehabilitation services and personalized feedback.
Numerous assessment methods have been employed to measure improve- ments in mobility following rehabilitation training. The Fugl-Meyer Assess- ment (FMA) is widely recognized as a valuable tool for evaluating motor function in both upper and lower extremities (Fugl Meyer et al., 1975), attributed to its high intra- and interrater reliability (Gladstone et al., 2002). This assessment employs a 3-point scale to evaluate patients’ current motor function capabilities, in which they are instructed to perform tasks as out- lined in the FMA guidelines and then assigned a score through manual visual inspection. A score of 2 is given for flawless execution, 1 for partial com- pletion, and 0 for no execution or lack of motion. The total score for both upper and lower limb motions is documented and serves as a basis for com- parison to gauge improvements in a patient’s recovery following a series of rehabilitation training.
Limitations of Fugl-Meyer Assessment Despite its comprehensive nature in evaluating specific motor functions and tracking progress from rehabilitation sessions, the Fugl-Meyer Assessment
(FMA) has limitations. Reliance on manual inspection introduces labour- intensive processes, observer bias, and potential human error. Moreover, accessibility is restricted to specific rehabilitation centers, limiting its reach, particularly in remote areas. Ambiguity in the current 3-point scaling sys- tem further impedes accurate documentation of incremental improvements in patients’ motor function capabilities.
Advances in Automating Fugl-Meyer Assessment Advances in technology have been harnessed to enhance the Fugl-Meyer Assessment (FMA) by automating data collection using various sensors and other available technologies. Promising results from studies by Kim et al. (2016) and Lee et al. (2018) have demonstrated the potential of motion capture technology, particularly utilizing Kinect motion data and advanced Kinect v2 with force sensing resistor, in automating FMA. However, motion capture technology is limited in terms of portability due to its complex setup, making IMU and EMG sensors the preferred choice. Pan et al. (2021) and Flury et al. (2021) utilized data from these combined sensors to evalu- ate upper limb motor function and daily life motor performance activities, respectively, in stroke patients. Meanwhile, Li et al. (2017) demonstrated the advantages of fusing data from IMU and EMG sensors for motor func- tion assessment over using either type of sensor independently. These findings underscore the potential of wearable sensor technologies in providing a more practical and convenient method for quantifying and automating FMA, particularly in the context of remote rehabilitation.
Modified Automated FMA Using Percentage-Based Scoring The use of EMG and IMU sensors are good alternative since it addresses sev- eral problems of the traditional way of conducting FMA: (1) it eliminates manual inspection by using the sensors in collecting data from the patients; (2) the sensors used are portable which means that it can be integrated into a wearable device to allow remote rehabilitation. However, another prob- lem that is still to be addressed is the ambiguity of the FMA scoring system. Currently, FMA uses a 3-point scale in scoring the patient’s execution of certain motions based on the level of completeness. Since the scoring only revolves around the 3-point scale, the motions that are partially done will have the same score of 1 regardless of how far or close it is to the com- plete execution. This means that the same score is given if the motion was not completed even if there is an improvement with the current execution as compared to the previous assessment. To address this, a modified FMA with a percentage-based scoring is proposed. This modified FMA will use the data collected from EMG and IMU sensors as a basis in calculating the percentage of similarity from the baseline data for complete execution. The baseline data recorded from complete execution will serve as the representa- tive data for normal range of motion. The assumption is that stroke patients with mobility impairments will exhibit extended movement time, altered tra- jectory, irregular or suboptimal movements when performing tasks outlined in the Fugl-Meyer Assessment (FMA) guidelines (Van Dokkum et al., 2014)
Monitoring Rehabilitation of Stroke Patients Using Automated Fugl-Meyer Assessment 107
which would exhibit different dataset from the baseline data. By doing this, partial execution from patients will be scored according to percentage sim- ilarity with the normal range of motion and the FMA percentage score will determine how far or close the patient’s current mobility function is from the normal range.
METHOD
In testing the validity of the proposed method, data was collected from human participants using the EMG and IMU sensors while executing selected upper limb motions from the FMA manual. Sensor data were processed and analysed using data modelling techniques.
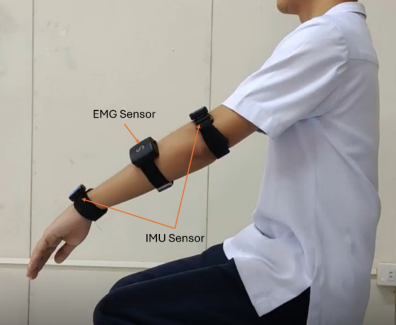
Data Collection Data was collected from 24 participants without prior upper arm mobil- ity related issues, aged 18-22. The participants were asked to perform one arm movement from the FMA Manual – Shoulder Flexion (0–90 degrees). Three sensors were attached to the dominant arm: one IMU sensor above the wrist joint, another IMU sensor above the elbow joint, and the EMG sensor in the forearm in between the two IMU sensors. Arm movement exe- cution while performing Shoulder Flexion was recorded simultaneously in the three sensors.
EMG sensors are used to record activity of the muscle by detecting elec- trical activity while IMU is a sensor system designed to gauge the linear and angular motion of an object and usually incorporates a blend of accelerome- ters, gyroscopes, and magnetometers. Sichiray EMG Gyroscope Arm Ring is used in recording EMG signals while the WitMotion WT9011DCL Bluetooth 5.0 is used in recording the Acceleration, Angular Rate, and Magnetic Field, as well as measuring the equivalent Angle Position in 3-axis XYZ. Both sen- sors record the data, process it, and transmit it to the host computer adapter through its Bluetooth capability.
Figure 1: Placement of EMG and IMU sensors.
108 Tutor and Cai
Classification and Percent Similarity Scoring The data collection process involved simulating two scenarios. The first scenario encompassed full execution of upper limb movements, providing baseline data for the normal range of motion. In contrast, the second sce- nario involved partial execution of arm movements, with participants asked to perform Shoulder Flexion to an angle less than 90 degrees, representing data from individuals with mobility impairment.
The algorithm was trained using Support Vector Machine (SVM) and Dynamic Time Warping (DTW) on this dataset. This enabled the algorithm to determine whether a participant’s motion fell within the normal range and provide immediate feedback in the form of percentage scores, indicating the deviation from normal execution. SVM is a widely utilized classification algo- rithm in machine learning, with diverse applications in various fields (Boser et al., 1992). It has been extensively employed as an assessment tool, partic- ularly in rehabilitation (Hamaguchi et al., 2020; Lau et al., 2009), as well as in motion recognition using EMG and IMU sensors (Wu et al., 2016; Tepe & Demir, 2022).
On the other hand, DTW is a technique used to compare time series data by calculating similarity scores. It has been proven effective and is widely applied in various domains, including sign language recognition (Lichtenauer et al., 2008), speaker recognition (Prayoga, 2019), and processing motion capture data (Switonski et al., 2019).
RESULT
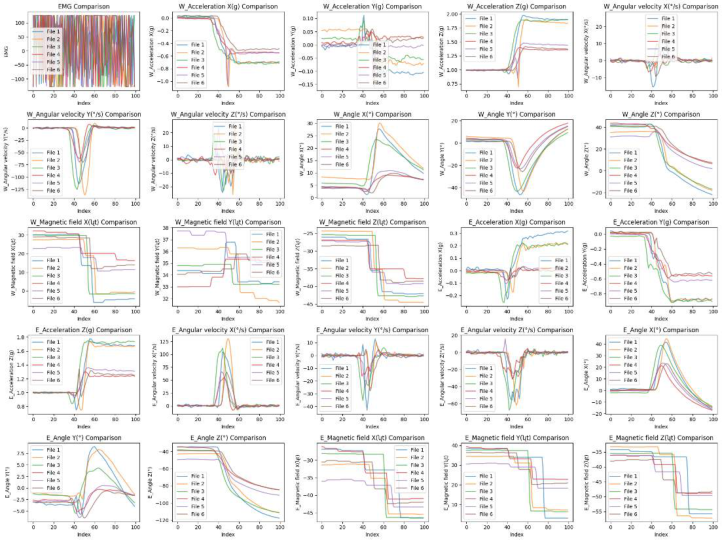
The data collected involves several features: 1 feature from EMG sensor which is the EMG signal, and 12 features each for the IMU sensor which includes Acceleration X(g), Acceleration Y(g), Acceleration Z(g), Angular velocity X(
/s), Angular velocity Y(
/s), Angular velocity Z(
/s), Angle X(
), Angle Y(
), Angle Z(
), Magnetic field X(t), Magnetic field Y(t), and Mag- netic field Z(t). In total, there are 25 features per sample. Each participant completed 3 trials for the first scenario and 3 trials for the second scenario, resulting in a total of 144 samples. To prepare the features for sample classi- fication, the mean, standard deviation, range, and maximum value for each feature were computed after centering and aligning the data.
Sample Classification The data underwent pre-processing and filtering. Upon review, dis- crepancies were observed in the recorded sensor data, with some datasets displaying greater ambiguity and less accuracy compared to others in graphical representations. To address this issue, the 144 samples were divided into two datasets: one containing 60 samples, representing more accurately recorded data, while the remaining 70 samples were filtered out due to inconsistencies with the graphical data.
Monitoring Rehabilitation of Stroke Patients Using Automated Fugl-Meyer Assessment 109
Figure 2: Sample plot of data features from EMG and IMU sensors.
The 60 filtered samples were categorized using KMeans Clustering to establish baseline data for normal and below normal ranges of motion. KMeans Clustering is an unsupervised learning algorithm used for cluster- ing unlabelled data. The results revealed that 29 samples were classified under Cluster 0 (normal range) and 31 samples were classified under Clus- ter 1 (below normal range), closely mirroring the original classification of 30 samples in each category. The results of the KMeans Clustering served as the basis for training the SVM model. The clustered dataset was then divided into training, testing, and validation sets. The SVM Model demonstrated promising potential as an effective tool for classifying samples into normal and below normal range clusters. The model achieved a mean cross-validation score of 90.83%. On the testing set, the Accuracy was recorded at 91.67%, Precision at 100%, Recall at 83.33%, and an F1-Score of 90.91%. In contrast, the results from the validation set showed an Accuracy of 100%, Precision of 100%, Recall of 100%, and an F1-Score of 100%. The samples that were initially fil- tered out from the KMeans clustering were re-classified using the trained, tested, and validated SVM model, resulting in a new classification for all 144 samples.
110 Tutor and Cai
Table 1. SVM model cross validation results (k = 10).
Table 2. SVM model performance metrics for testing set.
Table available in the original PDF paper.
Accuracy on the test set 0.9167 Precision on the test set 1.0 Recall on the test set 0.8333 F1-Score on the test set 0.9091 Classification report for the test set:
Precision Recall F1-score Support Below normal range 0.86 1.00 0.92 6 Normal range 1.00 0.83 0.91 6 Accuracy 0.92 12 Macro Avg 0.93 0.92 0.92 12 Weighted Avg 0.93 0.92 0.92 12
Table 3. SVM model performance metrics for validation set.
Table available in the original PDF paper.
Accuracy on the validation set 1.0 Precision on the validation set 1.0 Recall on the validation set 1.0 F1-Score on the validation set 1.0 Classification report for the test set:
Precision Recall F1-score Support Below normal range 1.00 1.00 1.00 7 Normal range 1.00 1.00 1.00 5 Accuracy 1.00 12 Macro Avg 1.00 1.00 1.00 12 Weighted Avg 1.00 1.00 1.00 12
DTW Scores and Percent Similarity DTW was utilized to quantify the percent similarity of the executed motions, aiming to provide insights into how closely the current motion aligns with the normal range. To achieve this, all variables in the dataset per sample were compared to the dataset recorded for the initial position of shoulder flexion prior to any movement. The DTW similarity score indicates the degree of resemblance to the initial position, with lower scores suggesting a narrower range of motion and higher scores indicating a wider range of motion.
In converting the DTW scores into their percentage equivalents, the max- imum score was identified by ranking the top values among the DTW scores
Monitoring Rehabilitation of Stroke Patients Using Automated Fugl-Meyer Assessment 111
and selecting the top value, while excluding outliers. Once the maximum score was determined, the percentage equivalent was calculated by dividing the DTW score by the maximum score. Subsequently, the samples with a per- cent similarity of 80% and above were classified as falling within the normal range of motion.
DISCUSSION
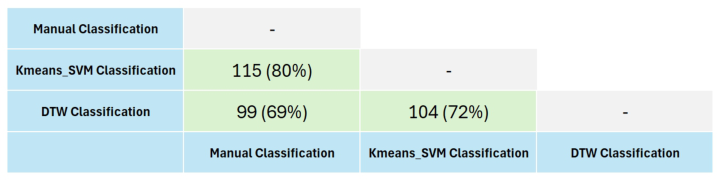
The application of KMeans and SVM models successfully classified samples into normal and below normal ranges of motion. Originally, sample labels were determined based on participant instructions during shoulder flexion execution under two specific cases. However, due to data inconsistencies, machine learning algorithms were deployed to reclassify the samples. The classification results using machine learning were found to be 80% similar to the manual classification, indicating consistent classification for 118 out of the 144 samples.
In an effort to reduce ambiguity in traditional FMA scoring, DTW was uti- lized to transform the 3-point scale scoring into a percentage-based system. The results demonstrate the potential of DTW in quantifying sample similar- ity and identifying those falling within the normal and below normal ranges of motion. The adoption of percentage-based scoring provides more compre- hensive insights into a patient’s progress. Notably, the DTW results exhibited a 72% similarity to the classifications achieved using machine learning algo- rithms, with 69% similarity to the original classifications across the 144 samples.
Figure 3: Similarity score among manual, KMeans_SVM, and DTW classifications.
Discrepancies observed between the original labels and those generated from KMeans, SVM, and DTW may stem from multiple factors, including the accuracy and precision of the sensors employed, as well as inconsistencies in the participants’ execution of shoulder flexion. Further exploration of the sensors used in data collection is warranted, as more advanced sensors have the potential to capture data with greater accuracy and precision, thereby improving overall results.
Moreover, addressing inconsistencies in the execution of shoulder flexion among participants is essential. It is possible that variations in the execution of the motion occurred, especially when participants were instructed to per- form the movement under different scenarios, potentially leading to instances where the executed motion falls below 90 degrees despite being intended as a
112 Tutor and Cai
full execution or normal range of motion, and vice versa. Enhancing data col- lection and validation methods is crucial to fortify the analysis and mitigate such discrepancies.
CONCLUSION
The Modified Automated FMA, utilizing a percentage-based scoring system based on IMU and EMG sensors, offers a promising solution for assessing motor function in stroke patients. Percentage scores from the FMA can be documented after each session to track progress, assess development, and evaluate the effectiveness of rehabilitation training. The data gathered may be utilized to refine or tailor rehabilitation programs to enhance recovery and mitigate potential discomfort or injuries. The percentage-based scoring sys- tem provides a precise assessment of motor function, capturing even subtle improvements which contribute to improved treatment planning and better tracking of rehabilitation outcomes. Additionally, it allows for the potential of the integration of digital twin technology with wearable devices for remote rehabilitation and personalized care. Findings of the study can be used to allow developments of solutions for patients to engage in rehabilitation exer- cises from the comfort of their homes while healthcare professionals remotely monitor their progress. This innovative approach enhances the quality of life for stroke patients by providing convenient access to rehabilitation services and personalized feedback.
ACKNOWLEDGMENT
The authors would like to acknowledge the Industrial Engineering Depart- ment of Xavier University – Ateneo de Cagayan for the full support provided during the data collection phase of the project. This project will also not be possible without the efforts and insights provided from RBM Group 25, alongside the Project Mentor, Co-Supervisors, and Supervisors behind the research group.
REFERENCES
Boser, B. E., Guyon, I. M. & Vapnik, V. N. (1992) Training algorithm for optimal margin classifiers. Proceedings of the Fifth Annual ACM Work- shop on Computational Learning Theory, pp. 144–152. Available from: <https://dl.acm.org/doi/10.1145/130385.130401> [Accessed 7 March 2024]. Van Dokkum, L., Hauret, I., Mottet, D., Froger, J., Métrot, J. & Laffont, I. (2014)
The contribution of kinematics in the assessment of upper limb motor recovery early after stroke. Neurorehabilitation and Neural Repair, 28 (1). Flury, D., Massé, F., Paraschiv-Ionescu, A., Aminian, K., Luft, A. R. & Gonzenbach, R. (2021) Clinical value of assessing motor performance in posta- cute stroke patients. Journal of NeuroEngineering and Rehabilitation, 18 (1). Fugl Meyer, A. R., Jaasko, L. & Leyman, I. (1975) The post stroke hemiplegic patient. I. A method for evaluation of physical performance. Scandinavian Journal of Rehabilitation Medicine, 7 (1).
Monitoring Rehabilitation of Stroke Patients Using Automated Fugl-Meyer Assessment 113
Gladstone, D. J., Danells, C. J. & Black, S. E. (2002) The Fugl-Meyer Assessment of Motor Recovery after Stroke: A Critical Review of Its Measurement Properties. Neurorehabilitation and Neural Repair, 16 (3). Hamaguchi, T., Saito, T., Suzuki, M., Ishioka, T., Tomisawa, Y., Nakaya, N.
& Abo, M. (2020) Support Vector Machine-Based Classifier for the Assessment of Finger Movement of Stroke Patients Undergoing Rehabilita- tion. Journal of Medical and Biological Engineering, 40 (1), pp. 91–100. Available from: <https://link.springer.com/article/10.1007/s40846-019-00491- w> [Accessed 7 March 2024]. Kim, W. S., Cho, S., Baek, D., Bang, H. & Paik, N. J. (2016) Upper extremity functional evaluation by Fugl-Meyer assessment scoring using depth-sensing camera in hemiplegic stroke patients. PLoS ONE, 11 (7). Lau, H. Yin, Tong, K. Yu & Zhu, H. (2009) Support vector machine for classifi-
cation of walking conditions of persons after stroke with dropped foot. Human Movement Science, 28 (4), pp. 504–514. Lee, S., Lee, Y. S. & Kim, J. (2018) Automated Evaluation of Upper-Limb Motor Function Impairment Using Fugl-Meyer Assessment. IEEE Transactions on Neural Systems and Rehabilitation Engineering, 26 (1). Li, Y., Zhang, X., Gong, Y., Cheng, Y., Gao, X. & Chen, X. (2017) Motor func-
tion evaluation of hemiplegic upper-extremities using data fusion from wearable inertial and surface EMG sensors. Sensors (Switzerland), 17 (3). Lichtenauer, J. F., Hendriks, E. A. & Reinders, M. J. T. (2008) Sign language recognition by combining statistical DTW and independent classification. IEEE Trans- actions on Pattern Analysis and Machine Intelligence, 30 (11), pp. 2040–2046. Pan, B., Huang, Z., Jin, T., Wu, J., Zhang, Z. & Shen, Y. (2021) Motor function
assessment of upper limb in stroke patients. Journal of Healthcare Engineering, 2021. Prayoga, N. F. I. (2019) Analisis Speaker Recognition Menggunakan Metode Dynamic Time Warping (DTW) Berbasis Matlab. AVITEC, 1 (1). Switonski, A., Josinski, H. & Wojciechowski, K. (2019) Dynamic time warping in
classification and selection of motion capture data. Multidimensional Systems and Signal Processing, 30 (3). Tepe, C. & Demir, M. C. (2022) Real-Time Classification of EMG Myo Armband Data Using Support Vector Machine. IRBM, 43 (4), pp. 300–308. Wu, J., Sun, L. & Jafari, R. (2016) A Wearable System for Recognizing American
Sign Language in Real-Time Using IMU and Surface EMG Sensors. IEEE Journal of Biomedical and Health Informatics, 20 (5), pp. 1281–1290.
LISTED IN THE AHFE DIGITAL BOOKSTORE CATALOGUE
Explore the complete digital volume
Human Factors and Wearable Technologies
Read this individual research paper free through the original publisher, or explore the full digital proceedings book.
ISBN 978-1-964867-17-5
Explore this ISBN in the AHFE Bookstore ↗Listed in the July 2026 bookstore catalogue; search by ISBN to confirm current availability · Digital book purchase optional