Wanchen Jia, Xu Wu, Xiang Xu, Lin Ding, Chongchong Miao (2024). An Intelligent Monitoring Method of Pilot's Operating State Based on PCA and WOA-KELM. In: Human Factors and Wearable Technologies. AHFE Open Access, vol. 141, pp. 121–129. https://doi.org/10.54941/ahfe1005061
In this paper, a pilot’s operating state monitoring method based on Whale Optimization Algorithm (WOA) and Kernel-based Extreme Learning Machine (KELM), is introduced to improve the monitoring accuracy of pilot’s operating state.In the first place, collect the peripheral physiological signal data via portable and wearable devices to construct a feature set containing 89 features. Secondly, the Principal Component Analysis (PCA) is employed to reduce the feature dimensionality, and iterative optimization is performed to the key parameters in KELM with Whale Optimization Algorithm. Finally, establish the WOA-KELM recognition model based on these optimized parameters to monitor the pilot’s operating state. The method also overcomes the challenges of poor robustness of single physiological signal, insufficient reliability of the selected features according to previous experience, as well as low recognition accuracy of the classification models. By comparison with the performance verification data of the typical recognition model, the proposed method presents a higher recognition accuracy in monitoring pilot’s operating state.The study firstly creates corresponding operating states and collects physiological data by carrying out flight mission experiment. Flight mission simulation platform is used to accomplish the flight test. This platform is composed of curved screen display, touch screen display, control components, simulator host and other hardware components. Depending on Falcon BMS flight simulation software, various actual combating missions by fighters can be simulated with high fidelity. In this study, the multi-modal human factor perception terminal PTES100 from PsychTech for the gathering of GSR and PPG signals is selected. The sampling frequency of the GSR sensor is 4 Hz, and the sampling frequency of the PPG sensor is 100 Hz. The bracelet is worn on the left wrist of the subject, and the data is transmitted to the computing terminal for processing through blue-tooth.14 subjects were recruited for this study, all of whom were practitioners with aviation knowledge background. After operation trainings, they were relatively familiar with the flight driving operation and had certain basis of using Falcon BMS flight simulation software.The study set the number of features after PCA dimensionality reduction to 10, reducing 89 features to 10 dimensions while preserving the original feature information as much as possible. Secondly, the data set was divided at a ratio of training set accounting for 80 percent, verification set for 10 percent and testing set for 10 percent, namely, 650 pieces of training data, 81 pieces of testing data, and 81 pieces of verification data. WOA algorithm was used to optimize the regularization parameter C and kernel parameter γ of KELM. The population quantity of the whale swarm was set to 100 and the number of iterations was set to 30 to find out the optimal model with the prediction accuracy of the verification set as the fitness function.In terms of model performance verification results, the prediction accuracy of this model in the test set is 96.3%, indicating that it has high recognition performance.
Human With the development of aviation technology, the flight environment and mission of aviation equipment have become increasingly complicated. The main task of pilots has shifted towards situational information monitor- ing and key tactical task decision-making (Xi et al., 2019). To upgrade the level of collaboration between human and equipment, the human-machine interaction system is required to be correspondingly advanced. One of the key points to improve the human-machine interaction system of the new gen- eration of military aircrafts is to enhance its intelligent perception of pilot’s operating state. Personnel state monitoring technology is widely applied in intelligent aviation field with the main purpose of raising pilot’s work effi- ciency and the level of safety, avoiding human errors, and achieving the optimal human-machine collaboration.
Traditionally, the personnel state evaluation on pilot primarily rests with expert interviews and questionnaire surveys, such as NASA-TLX Task Load
Scale and Fatigue Subjective Symptom Scale. However, there exist many disadvantages under these indirect analyses. The questionnaire surveys for personnel state evaluation are subjective, the results of which are largely affected by prejudiced factors of different individuals. The flight operations have to be interrupted due to the conduction of questionnaire survey, so it’s impossible to realize in actual flight missions. Additionally, continuous and task-related personnel state change monitoring information cannot be cap- tured in that subjective assessment is merely able to be carried out at discrete points in time.
To solve these problems, researchers have proposed more objective and time-continuous methods to identify personnel state through single physio- logical signals, such as eletrocardiogram, ocular measures, electroencephalo- gram, respiration, and electrodermal activity. Nevertheless, the recognition of a single physiological signal is often influenced by poor robustness, reduced data information, low reliability, inadequate discriminative ability, etc. Fur- thermore, despite the fact that some studies have extended to the combination of physiological signals (Oh et al., 2015). For example, pilot cognitive state recognition based on combination of physiological characteristics (Han et al., 2019), there is still no consensus in many aspects: which indicators should be regarded as inputs, or what kind of classification model should be adopted. With the deepening development of ergonomic sensor technology, chip tech- nology and algorithm technology (e.g., machine learning, deep learning), physiological computing has become a feasible mode. Therefore, real-time, highly accurate and robust personnel state monitoring capabilities can be developed by collecting multi-modal data, establishing classification models with the help of machine learning or deep learning, as well as characterizing the mapping relation between physiological data and personnel state.
This paper presents a method for pilot’s operating state recognition based on Principal Component Analysis (PCA) and WOA-KELM. Firstly, take advantage of PCA technology to reduce the dimensionality of the peripheral physiological feature sets acquired and calculated by portable and wearable devices. And then, have the aid of Whale Optimization Algorithm to seek the optimum parameters of KELM model during the iterative process, and finally establish the KELM recognition model drawing upon these optimal parameters. Compared with other programs, the one proposed in this paper shows excellent performance in personnel operating state monitoring.
Feature Construction Based on Peripheral Physiological Signals Peripheral physiological signals refer to physiological signals related to the peripheral nervous system, mainly including electrocardiogram, skin con- ductance, skin temperature, respiration, electro-oculogram (EOG) and elec- tromyography (EMG). When the pilot’s operating state changes, peripheral physiological signals vary accordingly. By extracting and calculating corre- sponding features of physiological signals, changes of the signals can be described, and thereby pilot’s operating state can be speculated. In this paper, based on the peripheral physiological signals acquired by galvanic skin response (GSR) and photoplethysmography (PPG) sensors, the window
An Intelligent Monitoring Method of Pilot’s Operating State Based on PCA and WOA-KELM 123
length and step length for signal treatment are selected. A total of 89 features are calculated and extracted to construct the feature set, which can better characterize the information acquired by GSR sensor and PPG sensor. The specific composition of 46 features in GSR feature set and 43 features in PPG feature set is shown as Table 1.
Table 1. Description of GSR and PPG feature sets.
Table available in the original PDF paper.
Serial No. Type Description of Specific Features GSR Feature Set 1–10 Skin conductance reaction (GSR) Number; rise time average; amplitude peak; area; average; median; standard deviation; variance; minimum value; maximum value 11–16 Skin conductance level (SCL)
Average; median; standard deviation; variance; minimum value; maximum value
Average; median; standard deviation; variance; minimum value; maximum value 17–22 GSR signal Average; median; standard deviation; variance; minimum value; maximum value 23–28 First-order difference of GSR signal Average; median; standard deviation; variance; minimum value; maximum value 29–34 Second-order difference of GSR signal
Average; median; standard deviation; variance; minimum value; maximum value
35–40 First-order derivative of GSR signal
Average; median; standard deviation; variance; minimum value; maximum value
41–46 Second-order derivative of GSR signal PPG Feature Set 1–8 PPG waveform time Rise time average; rise time standard deviation; fall time average; fall time standard deviation; average period; period standard deviation; average of ratio between rise time and fall time; standard deviation of ratio between rise time and fall time 9–16 PPG waveform area Rise area average; rise area standard deviation; fall area average; fall area standard deviation; period area average; period area standard deviation; average of ratio between rise area and fall area; standard deviation of ratio between rise area and fall area 17–22 PPG waveform amplitude
Rise amplitude average; rise amplitude standard deviation; fall amplitude average; fall amplitude standard deviation; average of ratio between rise amplitude and fall amplitude; standard deviation of ratio between rise amplitude and fall amplitude 23–29 Inter-beat interval (IBI)
Average of points between wave peaks; standard deviation of normal to normal (SDNN); root mean square of the successive differences (RMSSD); number of peak intervals greater than 20 ms (N20); ratio of the number of peak intervals greater than 20 ms (PNN20); number of peak intervals greater than 50 ms (N50); ratio of the number of peak intervals greater than 50 ms (PNN50) 30 Heart rate Average heart rate (HR) 31–37 PPG signal Average; standard deviation; energy; time domain pulse width; spectral bandwidth; time-bandwidth product; time-bandwidth ratio 38–42 Power spectral density
Low-frequency power spectral density: high-frequency power spectral density; total power spectral density; power spectral density of specific frequency; ratio between low frequency and high frequency power spectral density 43 Respiration Respiratory rate
PCA Feature Dimensionality Reduction Technology According to the studies above, there are 89 extracted feature dimension- alities, which is a relatively large number. In order to further overcome the possible curse of dimensionality, obtain the indicator features, save memory space, and remove redundancy features during the model establishment, in the present study, it’s necessary to reduce the dimensionality of the sample data prior to the construction of recognition models.
Principal Component Analysis (PCA) is a data dimensionality reduction technology initially proposed in 1901. Independently developed and defined by Hotelling in the early 1930s, it was named after a principle similar to the principal axis theorem in mechanics. Since then, PCA has been widely applied in multiple fields, and was given other names like KL transform, Hotelling transform, etc., due to its different variants in various application areas.
PCA is a commonly used technology for data dimensionality reduction, which can reduce the high dimensional data to low dimensional data and retain the main information of the original data. It transforms the original data to a new feature space by seeking a group of linear combinations, which makes the new features uncorrelated and keeps the main information of the original data as much as possible. Specifically, PCA selects the eigenvectors corresponding to the first k largest eigenvalues by calculating the eigenvalues and eigenvectors of the covariance matrix, and projects the original data to the subspace composed of these eigenvectors. The dimensionality reduced data can thus be obtained.
WOA-KELM ALGORITHM KELM Algorithm
Extreme Learning Machine (ELM) is a machine learning method based on single hidden layer feed-forward neural networks. Different with gra- dient descent method used by traditional neural networks, ELM randomly determines network weights between the input layer and the hidden layer, and directly calculates the weight matrix from the hidden layer to the out- put layer to obtain the output value. By contrast, Kernel-based Extreme Learning Machine (KELM) is an advanced algorithm combining extreme learning machine with kernel function. It has not solely inherited fast training speed and simple training process of ELM, but also prevented the dis- advantages of local optimal values and the need for a large number of iterations of the traditional gradient descent methods. In addition, KELM is capable of mapping the data set that is difficult to be separated in low dimensional space into a high dimensional space to achieve linear separa- tion, further improving the prediction accuracy of the model. Therefore, it is widely applied in the fields of classification and model establishment (Liu et al., 2022).
Since the result of KELM model is highly sensitive to the selection of reg- ularization coefficient C and kernel parameter γ , it is necessary to effectively optimize these 2 parameters.
An Intelligent Monitoring Method of Pilot’s Operating State Based on PCA and WOA-KELM 125
WOA Optimization Algorithm Mirjalili Seyedali first put forward the metaheuristic Whale Optimiza- tion Algorithm (WOA) in 2016 (Mirjalili et al., 2016). This algorithm can help to seek the solution quickly, requiring less parameters with rel- atively sound global convergence. It simulates three predation behaviors of humpback whale, namely, hunting, predation and searching. To be specific, this algorithm uses helical structure to simulate a humpback whale’s bubble net hunting. A humpback whale first dives deeply into the seabed, then it swims upwards in a spiral form, spitting bubbles of vari- ous sizes which eventually form a cylindrical or tubular bubble net around its prey. This kind of action can force prey into the center of the bub- ble net, making it easier for the humpback whale to swallow with an opened mouth.
Process of KELM Optimization With WOA Taking KELM as the master line, WOA optimization algorithm is adopted to select regularization parameter C and kernel parameter γ of KELM. The specific process is as follows: Firstly, the population quantity N of the whale swarm, the maximum number of iterations tmax and the position vector of the whale swarm are initialized, among which the regularization parameter C and kernel parameter γ are mapped as the position of the whale swarm (C, γ ). Then, taking the classification accuracy rate of pilot’s operating state as the fitness function, the fitness corresponding to each whale’s position is calculated. Subsequently, update corresponding coefficients by determining the whale position, and select corresponding iteration equation to update the whale position until the maximum number of iterations is met, and regular- ization parameter C and kernel parameter γ of the optimal KELM are output. Finally, according to the original sample data, the training set and testing set are divided and the data is normalized. Training set data is used for training and the pilot’s operating state recognition model is obtained. The testing set data is substituted into the trained model to predict and classify the pilot’s operating state.
MODEL PERFORMANCE VERIFICATION Experimental Platform and Equipment
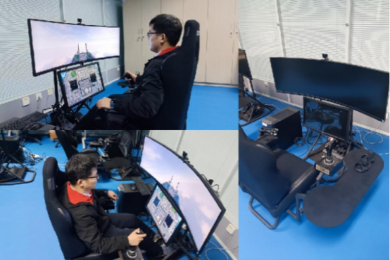
The study firstly creates corresponding operating states and collects phys- iological data by carrying out flight mission experiment. Flight mission simulation platform is used to accomplish the flight test. This platform is composed of curved screen display, touch screen display, control components, simulator host and other hardware components. Depending on Falcon BMS flight simulation software, various actual combating missions by fighters can be simulated with high fidelity, see Fig. 1.
Figure 1: Flight mission experiment platform.
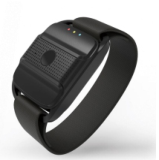
In this study, the multi-modal human factor perception terminal PTES100 from PsychTech for the gathering of GSR and PPG signals is selected, as shown in Fig. 2. The sampling frequency of the GSR sensor is 4 Hz, and the sampling frequency of the PPG sensor is 100 Hz. The bracelet is worn on the left wrist of the subject, and the data is transmitted to the computing terminal for processing through blue-tooth.
Figure 2: Physiological data acquisition equipment.
Data Acquisition Description of Flight Mission 14 subjects were recruited for this study, all of whom were practitioners with aviation knowledge background. After operation trainings, they were rela- tively familiar with the flight driving operation and had certain basis of using Falcon BMS flight simulation software. Data set of three types of operating state was acquired:
1. Resting state data. 2. Data of low operating load state. 3. Data of high operating load state.
Data Set Construction The experiment used different flight missions to set up the operating state. However, these fragments cannot successfully create corresponding operat- ing state from the very beginning, and the acquired physiological data thereby
An Intelligent Monitoring Method of Pilot’s Operating State Based on PCA and WOA-KELM 127
needed segmenting to obtain the most representative data fragment for anal- ysis. In this study, according to the interview after the flight experiment, the mission fragments which could best produce corresponding operating state was confirmed and marked.
In consideration of the need for real-time monitoring of the operating state, the window length of the signal processing was set to 20 seconds and the step length was set to 2 seconds, based on which corresponding feature values were computed. Finally, 812 pieces of data were obtained by calcu- lation, among which there were 191 pieces in “resting state”, 318 pieces in “low operating load state” and 303 pieces in “high operating load state”. Each piece of data included specific values for a total of 89 features of GSR and PPG.
Model Performance Analysis Model Based on PCA and WOA-KELM The study set the number of features after PCA dimensionality reduction to 10, reducing 89 features to 10 dimensions while preserving the original fea- ture information as much as possible. Secondly, the data set was divided at a ratio of training set accounting for 80 percent, verification set for 10 percent and testing set for 10 percent, namely, 650 pieces of training data, 81 pieces of testing data, and 81 pieces of verification data. WOA algorithm was used to optimize the regularization parameter C and kernel parameter γ of KELM. The population quantity of the whale swarm was set to 100 and the number of iterations was set to 30 to find out the optimal model with the prediction accuracy of the verification set as the fitness function.
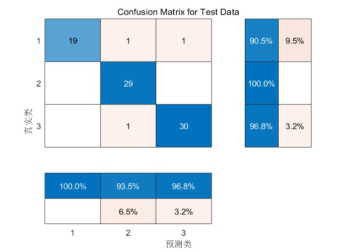
Input testing set data to the model to verify the model performance. And the final accuracy of the program proposed herein based on the testing set is 0.9630. The confusion matrix of the testing set is shown as Fig. 3. This model has two wrong predictions in “resting state”, and only one in “high operating load state”, indicating its good performance.
Figure 3: Confusion matrix results of the program in the paper.
Performance Comparison With Other Technical Programs In order to further verify the performance of the model proposed in this paper, other programs were also tested, including: 1) only using support vector machine (SVM); 2) principal component analysis and support vector machine; 3) principal component analysis and multi-layer perceptron (MLP); 4) principal component analysis and kernel-based extreme learning machine. The results are shown as Table 2.
Table 2. Comparison of program performance results.
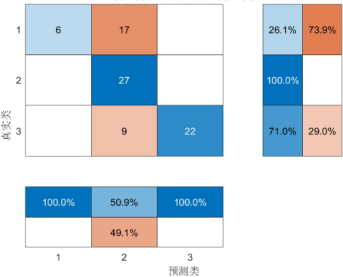
The confusion matrix result of “SVM” program is shown as Fig. 4. After the analysis of these results, it is shown that using only support vector machines as classifiers makes it hard to distinguish between “resting state” data and “low operating load” data, resulting in many recognition errors. After using PCA to reduce the dimensionality, the accuracy rate is signifi- cantly improved. By comparing programs of “PCA+SVM”, “PCA+MLP” and “PCA+KELM”, it can be seen that in the classification task of this study, KELM has a better performance as a classifier. To further raise monitoring accuracy rate, WOA algorithm is added in this study to optimize the KELM hyperparameters, making the model performance and the accuracy rate a higher level.
Figure 4: Confusion matrix results of SVM program.
CONCLUSION
In terms of the pilot’s operating state monitoring, the paper proposes a predic- tion method based on PCA and WOA-KELM model, which includes feature
An Intelligent Monitoring Method of Pilot’s Operating State Based on PCA and WOA-KELM 129
construction, feature dimensionality reduction, model training, parameter optimization, etc. The following conclusions are drawn:
1. Compared with electroencephalogram and ocular measures, and other similar physiological data acquisition technologies, the program of using portable physiological bracelet to acquire peripheral physiological signals is more suitable for long-term monitoring of the pilot’s operating state. 2. PCA dimensionality reduction technology is used to reduce the dimen- sionality of the peripheral physiological signal feature set with a relatively large number of features, to overcome the curse of dimensionality and remove useless noise information, thus improving the efficiency and performance of machine learning. 3. Whale Optimization Algorithm is used to optimize key parameters of KELM model to avoid influences on model performance caused by selecting parameters based on experience. 4. The program proposed in this paper shows a better performance in pilot’s operating state monitoring, which can be integrated into the cock- pits of the new generation of aircrafts, providing support for a more intelligent human-machine interaction interface design to expect a better improvement of the human-machine collaboration level.
REFERENCES
Han, S. Y., Kim, J. W. and Lee, S. W., 2019, February. Recognition of pilot’s cognitive states based on combination of physiological signals. In 2019 7th International Winter Conference on Brain-Computer Interface (BCI) (pp. 1–5). IEEE. Liu, L., Wei, Y., Song, X. and Zhang, L., 2022. Fault Diagnosis of Wind Turbine
Bearings Based on CEEMDAN-GWO-KELM. Energies, 16(1), p. 48. Mirjalili, S. and Lewis, A., 2016. The whale optimization algorithm. Advances in engineering software, 95, pp. 51–67. Oh, H., Hatfield, B. D., Jaquess, K. J., Lo, L. C., Tan, Y. Y., Prevost, M. C.,
Mohler, J. M., Postlethwaite, H., Rietschel, J. C., Miller, M. W. and Blanco, J. A., 2015. A composite cognitive workload assessment system in pilots under various task demands using ensemble learning. In Foundations of Augmented Cognition: 9th International Conference, AC 2015, Held as Part of HCI International 2015, Los Angeles, CA, USA, August 2–7, 2015, Proceedings 9 (pp. 91–100). Springer International Publishing. Xi, P., Law, A., Goubran, R. and Shu, C., 2019, June. Pilot workload prediction from ECG using deep convolutional neural networks. In 2019 IEEE International Symposium on Medical Measurements and Applications (MeMeA) (pp. 1–6). IEEE.
LISTED IN THE AHFE DIGITAL BOOKSTORE CATALOGUE
Explore the complete digital volume
Human Factors and Wearable Technologies
Read this individual research paper free through the original publisher, or explore the full digital proceedings book.
ISBN 978-1-964867-17-5
Explore this ISBN in the AHFE Bookstore ↗Listed in the July 2026 bookstore catalogue; search by ISBN to confirm current availability · Digital book purchase optional