Sun guoqiang, Xu wu (2023). Ergonomics Experiment Research on Visual Characteristics of Head-Up-Display Failure Warning. In: Intelligent Human Systems Integration (IHSI 2023): Integrating People and Intelligent Systems. AHFE Open Access, vol. 69, pp. 217–222. https://doi.org/10.54941/ahfe1002839
With the gradual adaptation of HUD (Head-Up-Display) in civil transportation, it was normal for civil pilots or even drivers to use it. Howev-er, any failure warning of airplane HUD was so fatal that required pilot to search for it immediately and make correct response to recover. As the pri-mary indicator of HUD warning, failure flag was well-designed especially in visual coding, which directly affected pilot’s recognition and acquisition of warning information. This research developed ergonomics experiment of HUD simulation interface and designed character size of failure flag as ex-periment variable. The participants were required to perform signal detection task and response to signal (warning occurred) or noise (no warning) accord-ingly. Therefore, both sensitivity and response bias were measured to analyze visual characteristics of failure flag and its influence on HUD warning.The mechanical failures of airplane were mainly caused by unreasonable mecha-nism structures or improper system operations, which was excluded from conse-quence of any manually operation or other outside factors . And the failure flag was shown on HUD when the sensor status was unavailable and the same parameter from different sources did not match . The representative mechanical failure flags were included with indicated airspeed warning, barometrical altitude warning, head-ing warning and ground proximity warning. Moreover, HUD failure warning could be displayed in various channels of visual, auditory and tactile manners, and the first two were most widely used channels . The visual channel of HUD failure warning was normally designed in visual coding technology, which was involved with size, position, salient of blink or textbox frame. And the auditory channel focused on volume and tone of warning voice. Specifically, the minimum character size of failure flag was 1/200 of the visual field distance, i.e., at least 0.18-inch character was required to be shown on HUD at distance of 36-inch away. In addition, the aspect ratio for English letter was required as 3:5 , and its typeface was selected as Arial . To analyze the effect of visual coding on failure flag on HUD, this research firstly developed HUD interface simu-lation, and then carried out ergonomics experiment to validate the influence of char-acter size.3.2Experiment InterfaceAs shown in Fig.3, the experiment interface was displayed on 17-inch computer screen with visual distance of 60cm. The screen resolution was 1440×900 and aver-age luminance was 120cd/m2. The participants were required to interact with exper-iment computer through normal mouse and keyboard. The HUD interface was simu-lated on GL Studio platform, and the experiment was realized using C++ and net communication technology on Visual Studio 2012. Each interaction with experiment computer was recorded and output when the experiment task was completed.3.4Experimental TaskThe participants were required to perform signal detection task during the experi-ment block, followed by the order of Latin Square fashion. And each block lasted for ten minutes with interval of five minutes. Moreover, the failure flag was designed to occur at possibility of 75%, with noise-signal ratio as 1:3. To response each failure flag, they need to press corresponding button of W/A/S/D/E on keyboard according to the specific warning. And SPACE button was expected to be pressed when no warning was shown.ResultsBoth statistics analysis and signal detection method were used to process the exper-iment results. First, descriptive statistics was used to illustrate central tendency and dispersion degree of detection performance. Then, repeated measured ANOVA was used to examine the effect of character size. In addition, sensitivity d’ and response bias were processed to evaluate the influence of failure warning based on signal detection theory.
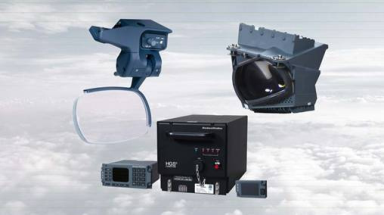
Originated from military fighter technology, HUD has been largely applied in modern civil airplane since 1980s, which gradually became most important component in cockpit display system, as shown in Fig. 1. On the contrary, just a few civil airplanes were currently equipped with HUD in China. Howe- ver, most Chinese trunk airliner manufacturers provided researching airplane with available installation option of HUD, and some of that even regulated HUD as standard configuration, which was encouraged by the next 10-year future plan of Civil Aviation Administration of China. Therefore, the new domestic C919 has adopted HUD technology to enhance flight performa- nce and ensure flight safety. But the fact we must encounter with was that the application of HUD in China was still suffered on the beginning stage and lacked of certain experience in both basic theory and scientific resea- rch. As a typical system of human-in-loop, airplane cockpit was required to balance and coordinate pilot-airplane interaction, which demanded human factors design and ergonomics validation of cockpit display interface. This research concentrated on the failure warning design of HUD, and attempted to investigate the influence of visual characteristics design on pilot detection performance through ergonomics experiment and data analysis.
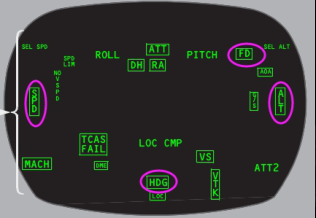
Figure 1: Typical HUD.Figure 2: Failure flags of HUD warning.
The mechanical failures of airplane were mainly caused by unreasonable mechanism structures or improper system operations, which was excluded from consequence of any manually operation or other outside factors (Boeing Company, 2008). And the failure flag was shown on HUD when the sensor status was unavailable and the same parameter from different sources did not match (FAA(AC) 25.11B, 2014). The representative mechanical failure flags were included with indicated airspeed warning, barometrical altitude warning, heading warning and ground proximity warning, as shown in Fig. 2.
Moreover, HUD failure warning could be displayed in various channels of visual, auditory and tactile manners, and the first two were most widely used channels (FAA(AC) 25.1322, 2010). The visual channel of HUD failure warning was normally designed in visual coding technology, which was invo- lved with size, position, salient of blink or textbox frame. And the auditory channel focused on volume and tone of warning voice. Specifically, the mini- mum character size of failure flag was 1/200 of the visual field distance, i.e., at least 0.18-inch character was required to be shown on HUD at distance of 36-inch away. In addition, the aspect ratio for English letter was required as 3:5 (HB 7289-1996, 1996), and its typeface was selected as Arial or sans serif ((SAE) ARP5288, 2008). To analyze the effect of visual coding on failure flag on HUD, this research firstly developed HUD interface simulation, and then carried out ergonomics experiment to validate the influence of character size.
Ergonomics Experiment Research on Visual Characteristics 219
HUD INTERFACE DESIGN Interface Prototype Design
Based on abstract method of entities into components, the HUD interface was de-signed in reference with common civil airplane HUD and built up by four primary parts: airspeed indicator, altitude indicator, attitude indicator and heading indicator according to the requirements of corresponding avia- tion standard (HB 8448-2014, 2014). First, the entities were combined using the given template on GL Studio software platform. The semi-cycle scale of heading indicator was initialized by its physical characteristics, including start angle, interval angle, ticks, length, and other parameters. Therefore, each component was built up by several entities, and all components were construct-ed as the whole HUD interface. In consideration of simulation fidelity, it was suggest-ed to contrast with the actual interface layout and proportion, and graphic photo of HUD interface was adopted to chartlet its texture when necessary. Besides, the hierarchy design was used to distinguish the corresponding relationship between each entity and component.
Socket Design During the prototype simulation, each HUD component was designed as five opening sockets: airspeed, altitude, rolling angle, pitching angle, and hea- ding angle, which were defined as float values and driven by outside data source. In fact, the received variables were processed and finally distributed for different entities to be applied with. Therefore, each working component was driven by inside written program and variables sent by the sockets. UDP (User Datagram Protocol) method was adopted to facilitate the procedure of variable communication, which was normally consisted by initialization, data reception and transmission, and closure.
Interaction Design To measure detection performance of failure flag on HUD, the interaction metrics was selected as evaluation index in this research. The HUD simu- lation was available to provide input interface of manual operation and output interface of document record, which realized real-time measurement of response time, correct rate and response error.
METHODS
Subject Sixteen subjects were recruited in this experiment with 12 males and 4 fema- les. They were all informed with the detail of experiment procedure, and voluntarily agreed to participate in the experiment.
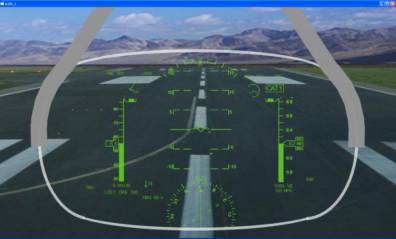
Experiment Interface As shown in Fig. 3, the experiment interface was displayed on 17-inch compu- ter screen with visual distance of 60cm. The screen resolution was 1440×900
Figure 3: Experiment interface of HUD.Table 1. Experiment variable design of character size.
Table available in the original PDF paper.
Block Height (cm) Breadth (cm) A 0.9 0.54 B 0.6 0.36 C 0.3 0.18
and average luminance was 120cd/m2. The participants were required to inte- ract with experiment computer through normal mouse and keyboard. The HUD interface was simulated on GL Studio platform, and the experiment was realized using C++ and net communication technology on Visual Studio 2012. Each interaction with experiment computer was recorded and output when the experiment task was completed.
Experimental Design The failure flag was selected as “SPD”, “ALT”, “HDG”, “FD” and “PULL UP” on HUD warnings, which were required to occur once at a time. The experiment was designed as three blocks to examine the effect of character size, therefore, the variable was selected as the height and breadth of each failure flag. The specific experiment design was shown in Table 1.
Experimental Task The participants were required to perform signal detection task during the experiment block, followed by the order of Latin Square fashion. And each block lasted for ten minutes with interval of five minutes. Moreover, the fai- lure flag was designed to occur at possibility of 75%, with noise-signal ratio as 1:3. To response each failure flag, they need to press corresponding but- ton of W/A/S/D/E on keyboard according to the specific warning. And SPACE button was expected to be pressed when no warning was shown.
RESULTS
Both statistics analysis and signal detection method were used to process the experiment results. First, descriptive statistics was used to illustrate central
Ergonomics Experiment Research on Visual Characteristics 221
Table 2. Behavioural performances of warning and no warning (M±SD).
Table available in the original PDF paper.
Block Warning No warning Correct rate (%) Response time (ms) Correct rate (%) Response time (ms) A 90±6 880±78 89±8 1148±105 B 82±11 944±71 83±12 1191±93 C 70±15 976±58 61±21 1186±165
Table 3. Signal detection indices (M±SD).
Table available in the original PDF paper.
Block Sensitivity d’ Response bias β A 2.47±1.08 1.24±1.16 B 2.14±0.94 1.77±2.00 C 1.04±1.10 1.33±1.66
tendency and dispersion degree of detection performance. Then, repeated measured ANOVA was used to examine the effect of character size. In addi- tion, sensitivity d’ and response bias were processed to evaluate the influence of failure warning based on signal detection theory.
Behavioural Performance As shown in Table 2, descriptive statistics revealed better performance of larger character in both conditions with or without failure warning. And it showed better performance of failure flag rather than normal conditions, especially in shorter response time.
Repeated Measurement of ANOVA One-way ANOVA of noise detection performance (no warning) showed significant main effect of character size on correct rate (P = 0.000) but insi- gnificant main effect on response time (P = 0.669). Also, one-way ANOVA of signal detection performance (failure flag) showed significant main effect of character size on both correct rate (P = 0.001) and response time (P = 0.000).
Signal Detection The descriptive results of signal detection were shown in Table 3, which revealed higher sensitivity d’ with incensement of character size. Moreover, one-way ANOVA showed significant main effect on d’ (P = 0.005) and post- hoc test showed significant differences between small size and middle size (P = 0.000), small size and big size (P = 0.006) and insignificant differences between middle size and big size (P = 0.424). However, one-way ANOVA showed insignificant main effect on response bias β (P = 0.607) and post-hoc test showed no significant differences.
CONCLUSION
In conclusion, the character size of failure flag had significant influence on both correct rate and response time of warning detection, which indicated
bigger size was much easier to be found. Moreover, there was obvious dif- ference of warning detection between failure flags of each indicator, due to the uneven attention allocation caused by information salient and position. And the theory and method of signal detection could be applied in ergono- mics research to guide experiment design and result process. In addition, the sensitivity d’ seemed to reveal some positive correlation with character size, however, the response bias β was failed to explain such impact.
ACKNOWLEDGMENT
The authors would like to acknowledge.
REFERENCES
Boeing B737-700/800 Flight Control Operation Manual. Boeing Company, 2008. Federal Aviation Administration, Advisory Circular (AC) 25.11B, Electronic Flight Deck Displays. October 7, 2014. Federal Aviation Administration, Advisory Circular (AC) 25.1322, Flight Crew
Alerting. December 13, 2010. HB 7289–1996. Requirement for cockpit indicator, display and controller of civil aircraft. Beijing, 1996. HB 8448–2014. General specification for the head-up display of civil aircraft. Beijing,
2014. Society of Automotive Engineers (SAE) ARP5288, Transport Category Airplane
Head Up Display (HUD) Systems. January, 2008.
LISTED IN THE AHFE DIGITAL BOOKSTORE CATALOGUE
Explore the complete digital volume
Intelligent Human Systems Integration (IHSI 2023): Integrating People and Intelligent Systems
Read this individual research paper free through the original publisher, or explore the full digital proceedings book.
ISBN 978-1-958651-45-2
Explore this ISBN in the AHFE Bookstore ↗Listed in the July 2026 bookstore catalogue; search by ISBN to confirm current availability · Digital book purchase optional